You Down With OTT? An Overview Of The Competitive Video Ecosystem
|
|
|
- Shanon Walton
- 6 years ago
- Views:
Transcription


1 You Down With OTT? An Overview Of The Competitive Video Ecosystem 1
2 Contents The Math of OTT 3 Definition 4 OTT Video Landscape 5-15 Connected Devices Streaming Services Consumer Behaviors Key Takeaways 44 Glossary 45 Contact Information 46 2
3 The Math Of OTT: A Formula Of Addition, Not Subtraction With 820 million connected video devices in the U.S. and hundreds of different streaming services, the over-the-top video ecosystem is about delivering more to the consumer More Distribution 71% of Internet users use an OTT service at least once a month More Content Consumers have a voracious appetite for content, in fact a large majority of OTT HHs (70%) also have a multichannel subscription More Choice Nearly one-third of OTT subscribers hold 3 or more means of accessing OTT content, an eight-fold increase over just the last two years More Convenience 45% of streamers say it s important to them to be able to watch TV programs on the go while 81% say it s important to them to watch TV programs whenever they want More Advertising Opportunities Currently, advertising comprises 45% of all online video revenue and is projected to grow to almost 60% over the next 10 years 65% of people who use a second screen while streaming have looked up info on a product that s been advertised in a TV show 3


 Viewers")

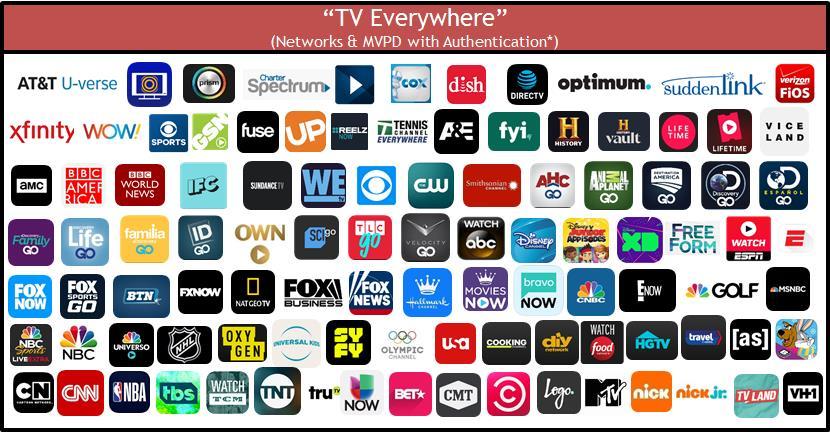
4 What is OTT (Over-The-Top)? Definition: Premium long form video content that is streamed over the internet through an app or device onto a TV (or PC, Tablet, or Smartphone) without requiring users to subscribe to a wired cable, telco or satellite TV service. OTT consumer journey: OTT leverages apps to stream video content to a television via an internet connection. Viewing methods include: (a) on-demand where viewers select and watch content when they choose to, and (b) linear/live where viewers watch at the particular time, channel or app (live content is streamed in real time as the event happens) Viewers stream TV content from the Internet using either a smart TV, OTT device, connected game console or IP set top box that received signals from digital video ad server All major networks are making their content available either through their own app or via a virtual MVPD like Hulu or Sling TV Content is streamed and plays instantly in full-screen and can be ad-supported if the network chooses 4
5 The Math of OTT: More Distribution Points Currently, 71% of Internet users use an OTT service 5
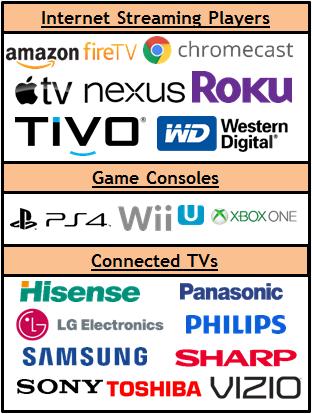
6 OTT Content Can Be Accessed In Several Ways And Falls Primarily Into Two Groups Devices Connected Devices allows the streaming of specific, selected content. Devices include Streaming Players/Sticks (e.g. Roku/Amazon Fire TV), Gaming Consoles (e.g. PS4), and Smart TVs Streaming Services Means of access are ad-supported, subscription, rental, or purchase. These access points can take the form of OTT content aggregators (e.g. Crackle), Standalone apps (e.g. ABC), or virtual MVPDs (e.g. Sling). Streaming services and devices often work in tandem. For example, streaming Hulu content from a mobile phone to the television via Google Chromecast. Source: SNL Kagan 6


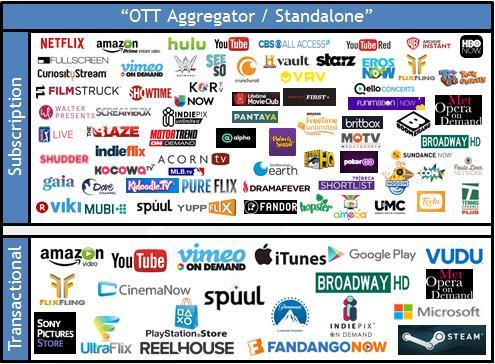
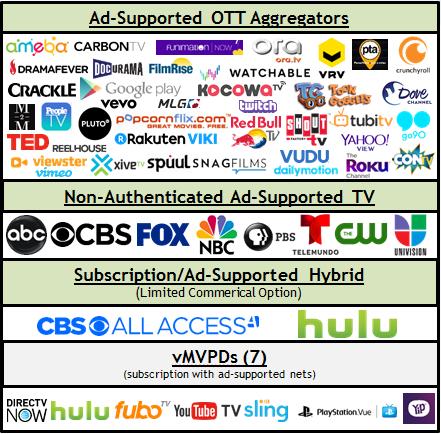
7 OTT Streaming Services & Devices Ecosystem Note: the above reflects a representative sampling of services and devices and each segment does not necessarily reflect every offering available. 7
8 U.S. Households (M) OTT Households Are Growing And Currently Represent 14.1MM Homes OTT-only Household Trend OTT households nearly tripled since OTT-only HHs Source: 2017 S&P Global Market Intelligence, Kagan and 2014 data as of June 2014; data as of June OTT HHs (multichannel substitutes) are HHs that rely on unmanaged Internet or OTT delivery to view television shows or movies in lieu of a traditional multichannel subscription. Figure does not include subscribers to virtual service providers such as Sling TV, PlayStation Vue or DIRECTV NOW. - Virtual service providers (vmvpds) characterized by unmanaged (Internet/OTT) delivery of aggregated live, linear networks and on-demand content similar to a traditional multichannel offering for a monthly subscription 8

 Multichannel HHs - Residential multichannel household count excludes DBS overlap created by households taking multiple multichannel subscriptions.")
 OTT HHs (multichannel substitutes) are HHs that rely on unmanaged Internet or OTT delivery to view television shows or movies in lieu of a")

9 Which Translates To 11% Of TV Homes; However Three-Fourths Of All Homes Are Multi-channel TV Households Video HHs by Method of Delivery OTA HHs vmvpds-only 12% HHs 3% 2017 OTT-only HHs 11% Multichannel HHs 74% ¾ of homes are multi-channel TV HHs Source: 2017 S&P Global Market Intelligence, Kagan. As of June (1) Multichannel HHs - Residential multichannel household count excludes DBS overlap created by households taking multiple multichannel subscriptions. Includes cable, DBS, telco and other multichannel platforms. Excludes commercial subs. (2) OTT HHs (multichannel substitutes) are HHs that rely on unmanaged Internet or OTT delivery to view television shows or movies in lieu of a traditional multichannel subscription. Figure does not include subscribers to virtual service providers such as Sling TV, PlayStation Vue or DIRECTV NOW. (3) Virtual service providers (vmvpds) characterized by unmanaged (Internet/OTT) delivery of aggregated live, linear networks and on-demand content similar to a traditional multichannel offering for a monthly subscription. (4) OTA HHs - Households that receive broadcast network signals using an antennae. Does not exclude households that also access OTT content 9
10 U.S. Households (M) While MVPD Subscriptions Will Maintain A Large Share Of HHs, OTT-Only HHs Are Projected To Grow to 17.9MM Homes By Projected Video HHs by Method of Delivery CAGR % -2.4% +8.2% +1.9% +43.4% Multichannel HHs OTT-only HHs vmvpd-only HHs OTA HHs Source: 2017 S&P Global Market Intelligence, Kagan. As of June (1) Multichannel HHs - Residential multichannel household count excludes DBS overlap created by households taking multiple multichannel subscriptions. Includes cable, DBS, telco and other multichannel platforms. Excludes commercial subs. (2) OTT HHs (multichannel substitutes) are HHs that rely on unmanaged Internet or OTT delivery to view television shows or movies in lieu of a traditional multichannel subscription. Figure does not include subscribers to virtual service providers such as Sling TV, PlayStation Vue or DIRECTV NOW. (3) Virtual service providers (VSPs) characterized by unmanaged (Internet/OTT) delivery of aggregated live, linear networks and on-demand content similar to a traditional multichannel offering for a monthly subscription. (4) Households that receive broadcast network signals using an antennae. Does not exclude households that also access OTT content 10
11 By 2021, About 200 Million US Consumers Will Use An OTT Video Service Or Connected TV At Least Once Per Month US OTT Video Service Users and Connected TV Users Millions and % of Internet Users 70.8% 61.5% % 72.1% 72.7% 73.1% 65.3% 66.9% 67.5% 67.9% OTT Video Service Users Connected TV Users # = users in millions Source: emarketer, July 2017, Programmatic Connected TV And OTT Video Advertising: Automation, Audience Attracts Digital And TV Ad Buyers.. Note: OTT Video Service Users reflect individuals of any age who watch video via any app or website at least once per month that provides steaming video content over the internet and bypasses traditional distribution; examples include HBO Now, Hulu, Netflix and YouTube. Connected TV Users reflect individuals of any age who use the internet through a connected TV at least once per month. 11
12 The Math of OTT: More Access To More Content 70% of OTT households also have an MVPD subscription 12
 Custom Reporting, U.")
13 The Overwhelming Majority Of OTT Users Also Have A Cable or Satellite Subscription Looking at those households that have OTT capabilities, 70% also have a Cable+ subscription Over-the-Top (OTT) Households by Service Type Streaming Only 15% Streaming + Cordless Antenna 15% Cable Plus 70% Source: ComScore Total Home Custom Reporting, U.S. December 2016; comscore Single-Source (TV+OTT) Custom Reporting, U.S. December
14 Because Of This, Streaming - While Growing - Still Only Accounts for a Fraction of Total TV Viewing Hours Streaming s Share of TV Viewing Hours A18-49, October % 8% 5% Source: Pivotal Research Analysis of Nielsen Data, A18-49, October 2017; Roku Inc. 14
15 Even As The Number Of People That Access TV Content From The Internet Grew By Double-Digits Over The Last Two Years Do You Access TV Content From The Internet? 87% 82% 77% 76% 86% 90% 78% 65% 63% 53% 49% 48% P18-24 P25-34 P35-49 P Source: PwC Consumer Intelligence Services video survey, 2017 from Consumer Intelligence Series: I stream, you stream Report PricewaterhouseCoopers LLP, a Delaware limited liability partnership. 15
16 Let s Take A Closer Look At Connected Devices Devices / Platforms Internet Streaming Players e.g. Game Consoles e.g. Connected TVs e.g. 16
17 There Are Currently 820 Million Connected Video Devices in the U.S. The largest segments are smartphones (30% of devices), smart TVs (20%) and PCs/Home Media Servers (15%) 300 U.S. Connected Devices, (in millions) device ownership Streaming Sticks 4% Game Consoles 8% Streaming Media Players Blu-ray 6% Players 6% Smartphone users 30% Tablets in use 11% Desktop/Laptop/Home Media Servers 15% Smart TVs 20% Smartphone Users Tablets in Use Game Consoles Smart TVs Home Media Servers/Desktop/laptop Streaming Sticks Source: 2017 SNL Kagan, a division of S&P Global Market Intelligence. As of October (1) Gaming Consoles - Includes the subset of game consoles that are connected to the Internet such as Sony Playstation, Microsoft Xbox and Nintendo Wii. (2) Streaming Media Players - Includes installed base of Internet-connected standalone set-tops designed for online video viewing such as AppleTV, Roku, GoogleTV, standalone TiVo and other devices. (3) Streaming Sticks - Includes installed base of streaming sticks designed for online content viewing such as Chromecast and the Roku Streaming Stick, often in conjunction with another connected device. (4) Tablets - Excludes enterprise tablets in use. 17
18 The Preferred Device For Viewing Streaming Video Is The Television, Either On a Smart TV Or On A TV Using a Streaming Media Player Preferred method of watching online video 0% 5% 10% 15% 20% 25% 30% On Smart TV On TV using SMP 25% 25% On TV using gaming console On computer On TV using computer 9% 11% 11% On TV using DVD/Blu-ray player 6% On tablet On smartphone 3% 4% Other 1% No OTT TV viewing 6% % internet adults Source: 2017 SNL Kagan, a division of S&P Global Market Intelligence 18
19 Viewing On-Demand Video Content Is A Top Activity Across All Connected TV Devices Smart TV Activities % of Device Owners Streaming Media Player Activities % of Device Owners Gaming Console Activities % of Device Owners Viewed SVOD Content 70% Viewed Live Sports 53% Viewed TV Everywhere Content Viewed Premium Network VOD 43% 34% Streamed Online Music 30% Download Online Rented Video Download Online Purchased Video 27% 24% Played a Video Game 22% Purchased Physical Goods 13% Viewed SVOD Content 71% Viewed TV Everywhere Content 41% Streamed Online Music 34% Viewed Premium Network VOD 29% Viewed Live Sports 27% Download Online Rented Video Download Online Purchased Video 26% 25% Played a Video Game 14% Purchased Physical Goods 12% Played a Video Game 73% Viewed SVOD Content 43% Streamed Online Music 22% Viewed TV Everywhere Content Viewed Premium Network VOD Download Online Purchased Video Download Online Rented Video 21% 19% 16% 16% Viewed Live Sports 15% Purchased Physical Goods 11% Source: 2017 SNL Kagan, a division of S&P Global Market Intelligence, excludes watching TV for smart TV activities. 19
20 The Majority Of Long-Form Streaming Occurs On A Television Viewers prefer watching longer-form streaming video on a TV, and secondly on Mobile devices Primary type of service used to access video, by device Television 80% 10% 3% 7% Mobile Device 58% 22% 3% 17% Desktop/Laptop 42% 34% 4% 21% 0% 20% 40% 60% 80% 100% Subscription Streaming (e.g. Netflix, Hulu) video-sharing (e.g. YouTube, Vine) Digital Download or Rental (e.g. itunes, Google Play) Other Source: emarketer,
21 Streaming Sticks/Boxes & Smart TVs Are The Most Popular Primary OTT Streaming Devices Streaming Sticks/Boxes Smart TVs 38 MM U.S. HHs with this device 28 MM U.S. HHs with this device 73% Of these HHs used their streaming stick/box to stream OTT 63% Of these HHs used their smart TV to stream OTT Source: comscore Connected Home and OTT Intelligence, U.S., April
22 It s Projected That Smart TVs Will Widen Their Penetration Gap Against The Next Largest Connected TV Device By 2021 US Connected TV Users, by Device (Millions) Smart TV Connected Game Console Roku Google Chromecast Amazon Fire TV Blu-Ray Player Apple TV Total Source: emarketer, August 2017, Programmatic Connected TV And OTT Video Advertising: Automation, Audience Attracts Digital And TV Ad Buyers. Note: reflects individuals of any age who use the internet through a connected TV at least once per month. The total reflects the US connected TV user universe, therefore figures by device are not additive for the total. 22
23 Roku Has The Highest Cumulative Weekly Time Spent Out Of All The Devices Available For Viewing OTT Content Aggregate Weekly Hours (MM) of Internet Video Consumption by Device Roku Amazon Fire TV/Stick PlayStation Samsung Smart TV Xbox Vizio Smart TV LG Smart TV Apple TV Google Chromecast Sony Source: Kantar Millward Brown / Roku Streaming Leadership Study, Q3 2017; Roku Inc. 23
24 The Math of OTT: More Choice There s been an eight-fold increase recently in people who have access to 3+ OTT subscription services 24


25 Let s Take A Closer Look At Streaming Services Streaming Services OTT Aggregators e.g. Standalone TV (Authenticated Apps) e.g. Subscription e.g. (with limited commercial option) 25
26 50% Of Internet Users Access An Online Video Subscription Once A Week, Followed Closely By Network TV Apps Frequency of Viewing 50% 49% 56% 18% 32% 21% 30% 25% 19% 22% 22% 6% Online Video Subscription Network TV Apps Pay-TV VOD TV Everywhere (e.g. HBO, Showtime) Frequently (1x+ wk) Infrequently (less than 1x wk) Never Source: 2017 SNL Kagan, a division of S&P Global Market Intelligence; U.S. 3Q 2017 Survey Summary Report. Base: 2,526 A18+ internet users. Q. Over the past three (3) months, how often did you perform these activities? 26
27 Nearly One-Third of OTT Subscribers Hold 3 or More Means of Accessing OTT Content, An Eight-Fold Increase vs. Just 2 Years Ago 70% 60% 50% 60% Number of Subscriptions* 45% 40% 30% 20% 36% 34% 21% 37% 31% 32% 10% 0% 4% One Two Three or more * Subscriptions includes Netflix, Hulu, Amazon, Network Standalones (HBO Now, CBS All Access, etc.) and vmvpds (Sling, YouTube TV, etc) Source: Hub What s TV Worth, April 2017; Survey fielded to 2,026, ages
28 However, Consumers Actually Only Watch Half Of The Subscription Video Services That They Have Access To Number of Services Available to Me* vs. Number of Services I Watch Regularly Average Number of Services Regularly Watched Number of Services Available to Me Traditional Pay TV Subscribers* Cord Trimmers Cord Cutters + Cord Nevers Source: PwC Consumer Intelligence Services video survey, 2017 from Consumer Intelligence Series: I stream, you stream Report PricewaterhouseCoopers LLP, a Delaware limited liability partnership. *Due to heightened levels of password sharing, PwC reports on access to a service rather than subscription to a service. * Reflects Cable/Telco/Satellite subscribers 28


29 Millennials And Gen X Are Most Likely To Be Streaming OTT Content And Are Highly Likely To Have 4+ Subscriptions SVOD usage is seen across all generations, with heaviest concentration in Millennials & Gen Z 28% (72 Index) 27% (100 Index) 44% (129 Index) 100% 80% 60% 40% 20% The # of subs is highest for the younger generations 41% 28% 32% % SOV users by generation 26% 24% 31% 43% 26% 51% 13% 22% 65% Gen Z/Millennials Gen X Boomers/Seniors 0% 1 Paid OTT video Subscription 2 Paid OTT Video Subscriptions 3 Paid OTT Video Subscriptions 4+ Paid OTT Video Subscriptions Indices are to population size of each generation Gen Z/Millennials Gen X Boomers/Seniors Source: 2017 SNL Kagan, a division of S&P Global Market Intelligence 29
30 Currently, The Four Major OTT Streaming Services (+YouTube) Average 2+ Hours Of Usage Per Viewing Day Per User Household However, this usage pales in comparison to ad-supported TV which averages 7.9 hours of usage per active TV household everyday Viewing Metrics for Selected Over-the-Top (OTT) Streaming Services 12.3 Monthly Viewing Days per Household 2.9 Hours per HH per Viewing Day Source: comscore OTT Intelligence, U.S., April 2017; streaming usage based on consumption across TV-connected devices only. TV data based on Nielsen Npower R&F Time Period Report, 4/1/17 4/30/17, Total Day, Live+SD, Households, ad-supported cable TV + broadcast TV. 30
31 Avg. Monthly Viewing Hrs. per HH While Netflix Leads Major OTT Streaming Services In HH Penetration, It Trails Hulu For The Most Streaming Hours Per HH 35.0 Selected Over-the-Top (OTT) Streaming Services by Wi-Fi Household Penetration & Engagement % 5% 10% 15% 20% 25% 30% 35% 40% 45% Wi-Fi Household Penetration How to read the chart: Netflix is watched in 40% of Wi-Fi households for an average of 27 hours per month per user household Source: comscore OTT Intelligence, U.S., April 2017; streaming usage based on consumption across TV-connected devices only. 31
32 The Four Major OTT Streaming Services Account For Nearly 80% Of OTT Viewing Time For OTT Households Share (%) of Total OTT Viewing Hours Other 21% 40% 7% 14% 18% Source: comscore OTT Intelligence, U.S., April 2017; streaming usage based on consumption across TV-connected devices only. 32
33 Among The Major SVOD Services, Acquired Network TV Content Is As Popular, Or Even More Popular, Than Original Series Content Types Viewed on Netflix, Hulu & Amazon Prime Video 77% 74% 74% 74% 73% 74% 49% 58% 57% 54% 66% 64% 57% 52% 40% Netflix Hulu Amazon Prime Video Recent Movies Older Movies Network TV Series: Prior Seasons Network TV Series: Current Season Original TV Programs (released within past 2 years) (released over 2 years ago) Source: Kagan, a media research group within the TMT offering of 2018 S&P Global Market Intelligence. Results from an online consumer survey conducted in September 2017, base: Netflix users 1,480; Hulu users 549; Amazon Prime Video users 938. Question: You indicated that you currently have a subscription to (online video service). Which of the following types of video content do you view from the service? 33

 Other (1%) Other (2%)")
 Original TV Programs (17%) Movies")
 Acquired TV Network Series (29%) Movies")


 and older movies (released over 2 years ago).")
34 Collectively, Subscribers Also Find Acquired Network TV Series To Be More Enjoyable Than Original Content On These Services Content Most Enjoyed on Netflix, Hulu and Amazon Prime Video Other (1%) Other (1%) Other (2%) Original TV Programs (35%) Movies (29%) Acquired TV Network Series (35%) Original TV Programs (17%) Movies (17%) Acquired TV Network Series (64%) Original TV Programs (25%) Acquired TV Network Series (29%) Movies (44%) Source: Kagan, a media research group within the TMT offering of 2018 S&P Global Market Intelligence. Results from an online consumer survey conducted in September 2017, base: Netflix users 1,480; Hulu users 549; Amazon Prime Video users 938. Question: Of the content you view on (online video service) which would you say is the content you most enjoy viewing? Movies include recent movies (released within past 2 years) and older movies (released over 2 years ago). Acquired Network TV Series includes prior seasons of network TV series and current season of network TV episodes. 34
 7% TV Network App Households: Share (%) of Total OTT Viewing Time 14% 19% 14% 29% 16% Network TV Apps Hulu Netflix YouTube Amazon")
35 Furthermore, Within Households That Watch Network TV Apps, These Apps + Hulu Account For More Viewing Time Than Netflix 10.1 MM HHs That View Network TV Apps via OTT (on connected-tv devices) 7% TV Network App Households: Share (%) of Total OTT Viewing Time 14% 19% 14% 29% 16% Network TV Apps Hulu Netflix YouTube Amazon Video All Other Source: comscore OTT Intelligence, U.S., April *Network TV App definition excludes premium networks such as HBO and Showtime and Skinny Bundles such as Sling. HHs based on consumption across TV-connected devices only. 35
36 The Math of OTT: More Convenience 81% of streamers say it s important to them to watch TV programs whenever they want 36
37 Many Consumers Don t Keep Their Video Subscriptions After Signing Up For A Trial Or Just Share Someone Else s Passwords The #1 Reason for Ending a Subscription is I didn t use it enough (29%) 55% 33% 81% of Cord Trimmers Regularly Subscribe to a Trial Version of a Service Don t Typically Keep the Subscription After the Trial Period is Over of Focus Group Participants Report That They Share Passwords With Friends and Family Source: PwC Consumer Intelligence Services video survey, 2017 from Consumer Intelligence Series: I stream, you stream Report PricewaterhouseCoopers LLP, a Delaware limited liability partnership. 37
38 % Agree & index vs. Adults OTT Is About Convenience, Both From A Time & Place Perspective Flexibility on when and where they watch is important for OTT viewers Important to me when watching TV programs 100% 90% 80% 70% 60% 50% 40% 30% 20% 10% 0% 81% 72% 45% 33% Index vs. A18+ Pop Index vs. A18+ Pop Watch on the Go Watch whenever I want Connected Device Owners Streamers Source: Gfk MRI 2016 Doublebase: Definitions Connected Device Owner (Television Sets Most Recent Purchase-Features Smart TV/Internet Connectable or Internet Video Devices for TV Household Owns Any or All Household Owns Video Game Systems); Streamers Definition (Watch TV through a TV network s app or through another online streaming TV service.) 38
39 Additional Research Continues To Validate That Convenience Is The Primary Reason Why Viewers Use OTT Services Reasons to use OTT Services Convenience It's cheaper Ability to watch certain TV shows and whole seasons No commercials or ads Ability to watch TV/movies on your computer Better selection Easier to find what you're looking for I enjoy the original content offered by these services Ability to watch TV/movies on your smartphone Ability to watch TV/movies on your tablet I don't use monthly subscription services or third party rental services 17.6% 15.6% 18.3% 18.0% 23.5% 22.3% 29.0% 29.0% 28.5% 33.9% 37.7% Viewers use OTT to get access to more content Source: TiVo Q Online Video and Pay TV Trends Report, December
40 % Agree & index vs. Adults OTT Viewers Also Crave Quality, Engaging TV Programming They also demand quality programming and access to a variety of library TV content Important to me when watching TV programs 100% 90% 80% 70% 60% 50% 40% 30% 20% 10% 0% 83% 87% 79% 83% 80% 71% Quality of TV Programs Variety of Programs Access to Older TV Episodes Access to TV series not on air 63% 74% Index vs.a18+ Pop Connected Device Owners Streamers Source: Gfk MRI 2016 Doublebase: Definitions Connected Device Owner Definition - (Television Sets Most Recent Purchase-Features Smart TV/Internet Connectable or Internet Video Devices for TV Household Owns Any or All Household Owns Video Game Systems); Streamers Definition - (Watch TV through a TV network s app or through another online streaming TV service.) 40
41 The Math of OTT: More Advertising Opportunities 65% of people who use a second screen while streaming have looked up info on a product advertised in a TV show 41
42 Advertising Is The Largest Revenue Model Across The Entire Online Video Ecosystem & Its Share Is Projected To Grow Currently, advertising comprises 45% of all online video revenue and is projected to grow to almost 60% over the next 10 years 20,684 10,015 24,657 11,901 27,414 29,739 13,166 14,449 Online Video Revenues (All video, not only OTT video) $ in Millions 31,679 15,759 33,585 35,215 36,884 38,536 40,219 41,890 43,597 17,104 18,458 19,830 21,217 22,646 24,091 25, Subscription Purchase Rental Advertising Source: 2017 SNL Kagan, a division of S&P Global Market Intelligence; The State of the Online Video Delivery, 2017 Edition 42
43 Two-Thirds Of Second Screen Users Look Up Info About A Product They See While Streaming A TV Show % of Those Using A Second Screen for Each of the Following (Frequently + Sometimes) Look Up Who's Acting/Playing in the Show/Game Communicate with Friends Unrelated to Show/Game 81% 78% Look Up Info on Product Featured on a Show Look Up Info on Product Advertised in a Show Communicate with Friends About the Show/Game 65% 65% 64% Post on Social Media About the Show/Game Browse Merchandise Related to the Show Check Fantasy Sports Stats 46% 44% 50% Purchase Merchandise Related to the Show/Game 35% Source: PwC Consumer Intelligence Services video survey, 2017 from Consumer Intelligence Series: I stream, you stream Report PricewaterhouseCoopers LLP, a Delaware limited liability partnership. 43

44 So, Are You Down With OTT? If you like more then you should be since the math of OTT is a formula of addition, not subtraction. Consumers have a voracious appetite for video content, especially for premium multiplatform TV, and they can satisfy their cravings anywhere, anytime through a wide selection of devices and streaming services Distribution 71% of Internet users use an OTT service at least once a month 65% of people who use a second screen while streaming have looked up info on a product advertised in a TV show Advertising Opportunities More Content 70% of OTT HHs also have a multichannel subscription 81% of streamers say it s important to them to watch TV programs whenever they want Convenience Choice Eight-fold increase in people who have access to 3+ OTT subscription services 44
45 Glossary Ad Networks: provides an outsourced sales capability for publishers and a means to aggregate inventory and audiences from numerous sources in a single buying opportunity for media buyers Buy-Side / Demand-Side Platforms (DSPs): a technology platform that provides centralized & aggregated media buying from multiple sources including ad exchanges, ad networks and sell side platforms, often leveraging real-time bidding capabilities of these sources Multichannel HHs: Households that subscribe to a service offering multiple channels of video programming through either a cable, telco or satellite provider (often referred to as an MVPD multichannel video programming distributor) OTA HHs (Over-The-Air): Households that receive broadcast network signals using an antennae; it does not exclude households that also access OTT content OTT (Over-The-Top): Premium long form video content that is streamed over the internet through an app or device onto a TV (or PC, Tablet, or Smartphone) without requiring users to subscribe to a wired cable, telco or satellite TV service OTT Aggregator: wide range of content from multiple providers delivered over the internet through one streaming source (i.e. Netflix) without the involvement of a traditional multichannel subscription OTT-only HHs: Households that rely on unmanaged Internet or OTT delivery to view television shows or movies in lieu of a traditional multichannel subscription Sell-Side / Supply-Side Platforms (SSPs): a technology platform that provides outsourced media selling and ad network management services for publishers. The business model resembles that of an ad network in that it aggregates ad inventory however they serve publishers exclusively and does not provide services for advertisers Standalone App: content from one provider delivered directly to the consumer over the internet without the involvement of a traditional multichannel subscription (i.e. CBS All Access) TV Everywhere (TVE): apps that allow viewers to access content over the internet by logging in with their Multichannel Video Programming Distributor (MVPD) subscription user name / password authentication (i.e. Watch ESPN, Fox Now) vmpvds (virtual multichannel video programming distributor): unmanaged (Internet/OTT) delivery of aggregated live, linear networks and on-demand content similar to a traditional multichannel offering for a monthly subscription 45
46 For More Information Visit Us Online TheVAB.com Follow Like us: facebook.com/videoadvertisingbureau 46
State of OTT An in-depth look at today s over-the-top content consumption and device usage
 State of OTT An in-depth look at today s over-the-top content consumption and device usage Mike Rich VP of Emergent Products Andrew Lipsman SVP of Marketing & Insights For info about the proprietary technology
Left To Your Own Devices
 V I D E O A D V E R T I S I N G B U R E A U - R E P O R T 2 0 1 8... Left To Your Own Devices Understanding Consumption In Today s Connected World Q1 2018 Contents Summary 3 The Impact of Connected Devices
State of OTT. An in-depth look at today s over-the-top content consumption and device usage. Susan Engleson SENIOR DIRECTOR, EMERGENT PRODUCTS
 State of OTT An in-depth look at today s over-the-top content consumption and device usage Susan Engleson SENIOR DIRECTOR, EMERGENT PRODUCTS comscore, Inc. Proprietary. For info about the proprietary technology
State of OTT An in-depth look at over-the-top consumption
 State of OTT An in-depth look at over-the-top consumption Mike Rich VP of Emergent Products For info about the proprietary technology used in comscore products, refer to http://comscore.com/patents comscore,
V I D E O A D V E R T I S I N G B U R E A U - R E P O R T Linear TV and OTT: Living Together in Harmony
 V I D E O A D V E R T I S I N G B U R E A U - R E P O R T 2 0 1 8 Linear TV and OTT: Living Together in Harmony 2 Contents 1 Delivering More To Marketers 2 Linear and OTT Dynamics 3 More Viewer Engagement
Time-Shifting: More Choices For Watching More Content
 Time-Shifting: More Choices For Watching More Content Time-Shifting refers to the ability of a consumer to access premium TV content when, where, and how it is most convenient for them. The options for
OTT Video Opportunity, threat or something else?
 OTT Video Opportunity, threat or something else? 1 Rick Paulsen Client Relations Manager 2 A little background info MACC is a BSS/OSS provider based in Blair, Nebraska with a nation wide client base This
Reality. Myth. OTT is highly cannibalistic of traditional TV. Only somewhat. OTT TV Myth #3: OTT Is Highly Cannibalistic of Traditional TV
 OTT TV Myth #3: OTT Is Highly Cannibalistic of Traditional TV Alarmist statements abound regarding the predatory nature of over-the-top (OTT) and how it is poaching traditional TV viewers. Myth Reality
Watch TV & Movies on the Internet! Skokie Public Library Aug. 2017
 Watch TV & Movies on the Internet! Skokie Public Library Aug. 2017 Let s talk about I m Amy Koester Youth & Family Program Supervisor Devices you can use Content services Frequently Asked Questions The
Direct Brands and the Ad-Supported OTT Video Viewer
 Direct Brands and the Ad-Supported OTT Video Viewer Excerpts from Ad Receptivity and the Ad-Supported OTT Video Viewer October 2018 Objectives and Methodology Objective: The study Ad Receptivity and the
2017 REPORT HIGHLIGHTS
 NIELSEN HOME ENTERTAINMENT VIDEO 360 2017 REPORT HIGHLIGHTS Copyright 2017 The Nielsen Company 1 INTRODUCTION Welcome to the Nielsen Video 360 2017 Report Highlights, which offer a flavor of the home entertainment
Leichtman Research Group Research Notes
 2Q 2018 Leichtman Research Group Research Notes Actionable Research on the Broadband, Media & Entertainment Industries In this issue: Symbiotic Relationships I Symbiotic Relationships 74% of U.S. TV Households
Home Sweet Digital Home Mike Rich, Susan Engleson & Angela Bryant June 7, 2016
 Home Sweet Digital Home Mike Rich, Susan Engleson & Angela Bryant June 7, 2016 For info about the proprietary technology used in comscore products, refer to http://comscore.com/about_comscore/patents Agenda
THE POWER OF OTT. CTV Media, Inc 2018
 THE POWER OF OTT CTV Media, Inc 2018 THE WAY YOU WATCH TV IS CHANGING Live Linear TV Set Top Box VOD (in your living room) TV Everywhere Mobile Laptop Tablet OTT : Roku Amazon Fire TV Chromecast, Apple
The OTT Co-Viewing Experience: 2017 November 2017
 The OTT Co-Viewing Experience: 2017 November 2017 Sponsored by Objectives IAB Digital Video Center of Excellence has identified OTT/Connected TV as one of its research priorities in 2017. During the first
CONNECTED TV GUIDE: WHERE CAN I SERVE MY VIDEO ASSET?
 CONNECTED TV GUIDE: WHERE CAN I SERVE MY VIDEO ASSET? APRIL 2018 INTRODUCTION Does your digital video strategy reach audiences where they view video? A major video challenge for advertisers is how viewership
CUTTING THE CORD: DITCHING CABLE TO SAVE MONEY
 CUTTING THE CORD: DITCHING CABLE TO SAVE MONEY DISCLAIMER The information contained in this presentation is the speaker s personal knowledge and experience. It does not reflect the beliefs, opinions, or
Measuring the impact of IoT. Alison Robart Director, Client Services
 Measuring the impact of IoT Alison Robart Director, Client Services Looking Ahead to the Voice Era July 2017 Alison Robart Director Client Insights comscore, Inc. For info about the proprietary technology
Cut the Cord. How to stop paying for cable without ditching your television!
 Cut the Cord How to stop paying for cable without ditching your television! Why cut the cord? The average cable, internet, & phone bill has risen to $107/mo. (Fortune.com, 2018) Do you need a home phone
THE STATE OF ONLINE VIDEO 2017
 EXPERIENCE FIRST MARKET RESEARCH THE STATE OF ONLINE VIDEO 2017 The State of Online Video is Limelight Networks latest in a series of surveys that explores consumer perceptions and behaviors around digital
OTT Churn and Retention: Increasing Lifetime Subscriber Value
 OTT Churn and Retention: Increasing Lifetime Subscriber Value September 6 11:00 AM CT Sponsored by Webcast Recording Playback Parks Associates invites you to view and listen to the webcast recording. Click
What is Video Streaming?
 Video Services What is Video Streaming? The ability to watch videos via an Internet connection Emerging field of technology Only a few years old Constant Improvements DVR Local channels Original Content
Investment in Crackle UK. Overview June 2013
 Investment in Crackle UK Overview June 2013 Internet Usage in the UK The UK internet user market is one of the most advanced in the world with the highest Internet penetration rate in Western Europe 74%
Apple TV. Sun Lakes Apple Users Group April 8, Presented by Gary Tougas
 Apple TV Sun Lakes Apple Users Group April 8, 2019 Presented by Gary Tougas What is Apple TV? A device that delivers live and on-demand access to movies, TV shows, sports, your music and your photos right
Contending with Another Challenger
 A Special Report from THE MEDIACENTER Contending with Another Challenger When you re King of the Hill, challengers, pretenders and wannabes come at you from all sides. For traditional TV, it started with
Entertainment Services: The future is mobile White Paper December 2016
 Entertainment Services: The future is mobile White Paper December 2016 Entertainment Services: The future is mobile White Paper Published December 2016 Version 1.0 Report Number: 042016-07 igr 12400 W.
Cutting the Cord. How I Learned to Love Streaming Television
 Cutting the Cord OR How I Learned to Love Streaming Television What Are We Talking About? What Are We Talking About? Why Should I Care? What Are We Talking About? Why Should I Care? Okay, I m Sold. What
U.S. Digital Video Benchmark Adobe Digital Index Q2 2014
 U.S. Digital Video Benchmark Adobe Digital Index Q2 2014 Table of contents Online video consumption 3 Key insights 5 Online video start growth 6 Device share of video starts 7 Ad start per video start
COMPARABLE METRICS Q4 2015
 COMPARABLE METRICS Q4 2015 Copyright 2016 The Nielsen Company 1 welcome Welcome to the Q4 2015 Nielsen Comparable Metrics Report! This is an in-depth study of users and usage averaged across the U.S. population
VAB REPORT: MVPD S VOD DRIVING ENGAGEMENT & AD LIFT
 PGM VAB REPORT: MVPD S VOD DRIVING & AD LIFT MVPD s VOD Insights MVPD s On-demand platform is a top preference for viewing programming content VOD is available in 62% of the Homes Growth driven by improved
GLOBAL VIDEO INDEX Q3 2012
 GLOBAL VIDEO INDEX Q3 2012 Table of Contents ABOUT OOYALA S GLOBAL VIDEO INDEX...3 EXECUTIVE SUMMARY...4 GOING LONG: LONG-FORM VIDEO...5 TABLET AND MOBILE VIDEO...7 LIVE VIDEO VIEWING...8 Viewer Behavior
The Future of Digital Platforms Smartphones, Streaming Video & Smart Speakers
 The Future of Digital Platforms Smartphones, Streaming Video & Smart Speakers Local Online Advertising Conference 2018 Dr. Gian Fulgoni Chairman & Co-Founder For info about the proprietary technology used
STREAMING DEVICES & STREAMING SERVICES. Ford s Colony Computer & Technology Club May 16, 2016
 STREAMING DEVICES & STREAMING SERVICES Ford s Colony Computer & Technology Club May 16, 2016 WHAT IS STREAMING? Streaming media is multimedia that is constantly received by and presented to an end-user
(Leaving Satellite or Cable) Richard Steinfeldt
 Richard Steinfeldt") Cutting the Cord (Leaving Satellite or Cable) Richard Steinfeldt Why? Because I looked at my DirecTV bill! We are a TV-Heavy House TV in living room with DVR. ($25/month for DVR) TV in library using DVR
Cutting the Cord (Leaving Satellite or Cable) Richard Steinfeldt Why? Because I looked at my DirecTV bill! We are a TV-Heavy House TV in living room with DVR. ($25/month for DVR) TV in library using DVR
The Nielsen Comparable Q2 2016
 The Nielsen Comparable Metrics Report Q2 2016 The Comparable Metrics Series Q2 2016 Copyright 2016 The Nielsen Company 1 welcome Welcome to the Q2 2016 Nielsen Comparable Metrics Report! This is an in-depth
DIGITAL MEDIA CONSUMPTION IS GROWING, EVERYTHING ELSE IS SHRINKING
 DIGITAL MEDIA CONSUMPTION IS GROWING, EVERYTHING ELSE IS SHRINKING US Consumer Media Consumption Share 2011 2012 2013 2014 2015 43.2% 40.9% 35.2% Mobile 30.0% Desktop/laptop 14.0% 12.0% 6.6% 5.8% 2.9%
CUTTING THE CABLE CORD!
 CUTTING THE CABLE CORD! Paul Juarez 5/25/2017 WHAT IS STREAMING? WHAT DO YOU NEED TO BE ABLE TO STREAM? Streaming Device-(Roku, Chromecast, Apple TV, Amazon Firestick) Streaming Service-(Netflix, Hulu,
Wave 9 Summary. Sept
 Sept 2016 www.decipher-blog.co.uk/ Tracking how emerging media technology impacts behaviour & consumption Will Smart TV s or dongles become the OTT device of choice? Will SVOD services be used mainly in
THE POWER OF BROADCAST MEDIA IN NEBRASKA
 THE POWER OF BROADCAST MEDIA IN NEBRASKA - 2017 NEBRASKA ASSOCIATION OF BROADCASTERS Presented by: Tony Hereau / VP, Audience Insights tony.hereau@nielsen.com Copyright 2017 The Nielsen Company 1 THE POWER
April 2018 r/cordcutters Survey Results By r/k6usy 3102 Total Responses. Age
 April 08 r/cordcutters Survey Results By r/kusy 0 Total Responses General Questions Age -7 8-8 5-0 580-0 7-50 08 5-0 + 5 Prefer not to say 8 0 00 00 00 800 000 00 00 00 Adults in Household One Adult 5
Future of Digital Home Entertainment
 Future of Digital Home Entertainment This report analyzes trends, technologies and business models of the enablers and providers of digital content. It examines six meta-themes that can be used as a template
COMPARABLE METRICS Q1 2016
 COMPARABLE METRICS Q1 2016 Copyright 2016 The Nielsen Company 1 welcome Welcome to the Q1 2016 Nielsen Comparable Metrics Report! This is an in-depth study of users and usage averaged across the U.S. population
U.S. Mobile Consumers and OTT Services: Who uses which apps to watch video and connect? Market Study 2Q 2017
 U.S. Mobile Consumers and OTT Services: Who uses which apps to watch video and connect? Market Study 2Q 2017 U.S. Mobile Consumers and OTT Services: Who uses which apps to watch video and connect? Market
DRAFT FOR DISCUSSION Crackle Russia Business Plan
 Crackle Russia Business Plan July 2013 Russian Market Overview Russia has the Largest Online Population of any European Country Broadband households in Russia are expected to grow at a 8% CAGR from 18.7mm
IAB Ireland Video On Demand 2017
 IAB Ireland Video On Demand 2017 October 2017 In association with: Study Methodology 2 iab Ireland wants to understand and provide marketers with a wide range of insights into the consumption and attitudes
Youtube tv channels guide
 Youtube tv channels guide 2 days ago. Google's new live TV service YouTube TV offers live broadcast TV, a ton of live sports, and more. Here are the available YouTube TV Channels. article didn't answer
Quality of. The importance of TV-like quality on every device. experience. Quality matters.
 The importance of TV-like quality on every device. Quality of experience Quality matters. Video Streaming Quality Report 2016 Content Quality matter to online viewers 3 Executive summary 4 Multiscreen
Over-the-Top: An Overview of the New World of Content Distribution
 Over-the-Top: An Overview of the New World of Content Distribution Brad Ruskin Sean Alford Andrew Nightingale Over-the-Top The Basics What does Over-the-Top (OTT) mean? - OTT means the delivery of audio
Q Conviva s State of the Streaming TV Industry
 1 Conviva s State of the Streaming TV Industry Q3 2018 Conviva is the real-time measurement and intelligence platform for streaming TV, with a global footprint of 50 billion streams per year across 3 billion
Session 3 - OTT and its multi faceted impacts
 Session 3 - OTT and its multi faceted impacts Guillaume Mascot December, 2015 1 ACCELERATING PACE OF CHANGE Source : Ray Kurzweil Moore s Law now resulting in big, big jumps in computing power. The Singularity
Q THE RISE OF MOBILE AND TABLET VIDEO GLOBAL VIDEO INDEX LONG-FORM VIDEO CONTINUES TO ENGAGE LIVE VIDEO DOMINATES ON-DEMAND MEDIA
 THE RISE OF MOBILE AND TABLET VIDEO LONG-FORM VIDEO CONTINUES TO ENGAGE LIVE VIDEO DOMINATES ON-DEMAND MEDIA Q3 2013 GLOBAL VIDEO INDEX TABLE OF CONTENTS Executive Summary...3 The Rise of Mobile and Tablet
DISCOVERABILITY. How Canadians Find TV Content
 DISCOVERABILITY How Canadians Find TV Content Table of Contents Introduction...3 Executive Summary...4 TV Viewing is Diverse... 6 Discoverability... 10 Paid, Owned and Earned...18 Appendix Methodology
streaming options POWERED BY
 streaming options POWERED BY Channel PlayStation Vue Sling TV DirecTV Now Hulu with Live TV NEWS CNN Access Orange, Blue Live a Little Yes Fox News Access No Live a Little Yes MSNBC Access News Extra Live
5 Reasons why Telcos need a Converged OTT Video Strategy
 5 Reasons why Telcos need a Converged OTT Video Strategy 1 Introduction Deutsche Telekom s CEO Timothy Hoettges in August 2015 announced that the company plans to be a content aggregator rather than an
How Many, How Often & How Long:
 How Many, How Often & How Long: Comparable Metrics & Any Given Minute Update 2Q 2017 Nielsen s Comparable Metrics Report Provides An Apples-To- Apples View of Media Consumption Nielsen s Q2 2017 Comparable
A Portrait of Today s Smartphone User
 A Portrait of Today s Smartphone User August 2012 Conducted in partnership with www.online-publishers.org Frank N. Magid Associates, Inc. Who We Are: Frank N. Magid Associates, Inc. is a leading research-based
Multi-Screen TV Brands Vs. AdTech
 Multi-Screen TV Brands Vs. AdTech A Comparison of Time Spent By Demo March 2018 Despite Media Hype, Consumers of All Ages Spend More Time With Multi-Screen TV Brands Than The Major Ad-Tech Platforms Against
Consumer Insights. YouGov Omnibus, 5 th -6 th April
 Consumer Insights YouGov Omnibus, 5 th -6 th April 2018 research@iabuk.net Methodology asked a series of questions to consumers to support the release of the Full Year 2017 Adspend Report Quantitative
Cable Cord-Cutting Workshop
 Cable Cord-Cutting Workshop Informational Packet June 27 th, 2017 Sponsored by: Randy Hunt, CPA State Representative, 5 th Barnstable District Mark Forest - Adjunct Professor, Cape Cod Community College
THE NIELSEN TOTAL AUDIENCE REPORT Q Copyright 2018 The Nielsen Company (US), LLC. All Rights Reserved.
, LLC. All Rights Reserved.") THE NIELSEN TOTAL AUDIENCE REPORT Q2 2018 PETER KATSINGRIS, SVP AUDIENCE INSIGHTS Technology is intertwined in how we all live our lives, but particularly so among younger generations. They have always
THE NIELSEN TOTAL AUDIENCE REPORT Q2 2018 PETER KATSINGRIS, SVP AUDIENCE INSIGHTS Technology is intertwined in how we all live our lives, but particularly so among younger generations. They have always
THE NIELSEN TOTAL AUDIENCE REPORT Q Copyright 2018 The Nielsen Company (US), LLC. All Rights Reserved.
, LLC. All Rights Reserved.") THE NIELSEN TOTAL AUDIENCE REPORT Q1 2018 Which came first more consumer choices that drove fundamental shifts in our media behavior or lifestyle changes that begged for new technologies that fit the new
THE NIELSEN TOTAL AUDIENCE REPORT Q1 2018 Which came first more consumer choices that drove fundamental shifts in our media behavior or lifestyle changes that begged for new technologies that fit the new
Creating a TV- Anywhere Platform
 Creating a TV- Anywhere Platform 2012 Business Overview The demand for smartphones, handheld multimedia devices and tablets is at an all time high, with Google and Apple battling for market share by launching
Q THE NIELSEN LOCAL WATCH REPORT THE EVOLVING OVER-THE-AIR HOME. Copyright 2019 The Nielsen Company (US), LLC. All Rights Reserved.
, LLC. All Rights Reserved.") Q2 2018 THE NIELSEN LOCAL WATCH REPORT THE EVOLVING OVER-THE-AIR HOME INTRODUCTION JUSTIN LAPORTE VP, LOCAL INSIGHTS Do you remember your first TV? If it had rabbit ears, a channel dial, access to only
Q2 2018 THE NIELSEN LOCAL WATCH REPORT THE EVOLVING OVER-THE-AIR HOME INTRODUCTION JUSTIN LAPORTE VP, LOCAL INSIGHTS Do you remember your first TV? If it had rabbit ears, a channel dial, access to only
The Edge: Delivering the Quality of Experience of Digital Content
 The Edge: Delivering the Quality of Experience of Digital Content 2016 EDITION By Conviva for EdgeConneX As video consumption evolves from single screen to multi-screen, the burden on the Internet and
OTT / IPTV / MULTISCREEN PVR / CATCH-UP / VOD / SVOD
 OTT / IPTV / MULTISCREEN PVR / CATCH-UP / VOD / SVOD OTT / IPTV In broadcasting, OTT refers to delivery of video over the Internet without the involvement of a the Internet Service Provider (ISP) in the
LatAm to add 24 million SVOD subscriptions
 LatAm to add 24 million SVOD subscriptions Latin American SVOD subscriptions are forecast to reach 51.10 million by 2024; almost double the 27.12 million recorded at end-2018. The top six regional platforms
The Mobile Consumer Lifestyle. Implications for Marketers
 The Mobile Consumer Lifestyle Implications for Marketers June 12, 2012 The mobile web is changing user behavior By 2015, more people in the US will be going online via a mobile device than on a computer
Device & Manufacturer Data
 #MobileMix Device & Manufacturer Data Top Manufacturers (all devices) CHART A Top 0 Devices CHART B RANK MANUFACTURERS 9 0 Apple Samsung LG HTC Motorola Amazon Nokia SonyEricsson HUAWEI ZTE Asus Sony Kyocera
Days of channel hopping are over as the average TV viewer only watches 12 of the 215 channels they sign up to
 Days of channel hopping are over as the average TV viewer only watches 12 of the 215 channels they sign up to New study by netgem.tv reveals how people s viewing habits are rapidly changing Streaming platforms
A Portrait of Today s Tablet User
 A Portrait of Today s Tablet User Magid Media Futures Sponsored by the OPA June 2011 Conducted in partnership with www.online-publishers.org Frank N. Magid Associates, Inc. Frank N. Magid Associates has
CE Adoption and Trends
 By John Barrett, Director, Consumer Analytics; Barbara Kraus, Director of Research; Yilan Jiang, Manager of Consumer Research; and David Mitchel, Research Analyst, Parks Associates SYNOPSIS 360 View: CE
Leichtman Research Group Research Notes
 4Q 2018 Leichtman Research Group Research Notes Actionable Research on the Broadband, Media & Entertainment Industries In this issue: An Evolving Internet A An Evolving Internet 83% of U.S. Households
TOP 5 SNEAK PEEK. A Brief Review of MTM s Latest Findings
 A Brief Review of MTM s Latest Findings Introduction The latest MTM data is here, and it s time to review some of our newest and most interesting findings. Clients will have access to new information on
The Smartphone Consumer June 2012
 The Smartphone Consumer 2012 June 2012 Methodology In January/February 2012, Edison Research and Arbitron conducted a national telephone survey offered in both English and Spanish language (landline and
GLOBAL VIDEO INDEX Q4 2013
 GLOBAL VIDEO INDEX TABLE OF CONTENTS Introduction...3 Executive Summary...4 Mobile + Tablet Video...5 Long-form Video...7 Live Video...8 Sports Video...9 Online Video Outlook...11 Turning Information into
Nintendo Consoles/Handhelds
 How to find MAC Addresses Please follow the instructions below to find the MAC Address of game consoles, streaming devices, smart TVs, smart phones, tablets, or computers. Nintendo 3DS To locate the MAC
IPSOS / REUTERS POLL DATA Prepared by Ipsos Public Affairs
 Ipsos Poll Conducted for Reuters Streaming Services 07.12.2017 These are findings from an Ipsos poll conducted June 8-26, 2017 on behalf Thomson Reuters. For the survey, a sample of roughly 4,453 adults
TOP 5 SNEAK PEEK. A Brief Review of MTM s Latest Findings
 A Brief Review of MTM s Latest Findings Introduction The Spring 2018 MTM data has arrived, and with it comes a tonne of new and exciting insights. This spring, clients will have access to new information
THE NIELSEN TOTAL AUDIENCE REPORT Q Copyright 2019 The Nielsen Company (US), LLC. All Rights Reserved.
, LLC. All Rights Reserved.") THE NIELSEN TOTAL AUDIENCE REPORT Q3 2018 Considering what connecting with media was like five, 10 or 20 years ago, consumers today are pretty lucky. They can customize their media behaviors and fit them
THE NIELSEN TOTAL AUDIENCE REPORT Q3 2018 Considering what connecting with media was like five, 10 or 20 years ago, consumers today are pretty lucky. They can customize their media behaviors and fit them
TODAY S TV IS AVAILABLE ON EVERY PLATFORM, ANYWHERE AND AT ANY TIME
 TV ANYTIME ANYWHERE TODAY S TV IS AVAILABLE ON EVERY PLATFORM, ANYWHERE AND AT ANY TIME TV AND ITS BABIES Television Viewing When Live (In-home Linear & Streaming) On-Demand (Playback & VOD) How In-home
Focus on potential and usage of platforms Thomas Fuchs, Conference of Directors of the Media Authorities (DLM)
") Focus on potential and usage of platforms Thomas Fuchs, Conference of Directors of the Media Authorities (DLM) EPRA Meeting Yerevan, October 2016 Illustrations: Rosendahl Berlin 1 Potential of audiovisual
Focus on potential and usage of platforms Thomas Fuchs, Conference of Directors of the Media Authorities (DLM) EPRA Meeting Yerevan, October 2016 Illustrations: Rosendahl Berlin 1 Potential of audiovisual
GLOBAL VIDEO INDEX REPORT Q1 2012
 GLOBAL VIDEO INDEX REPORT Q1 2012 TABLE OF CONTENTS EXECUTIVE SUMMARY... 3 VIEWER BEHAVIOR & ENGAGEMENT... 4 Viewers Watching Longer, Everywhere... 5 Time & Day of Week... 6 Individual Viewer Behavior...
TV Evolution Briefing
 TV Evolution Briefing Unleashing the power of the Investor/Promoter and Consumer Engagement, through Brand Extension & Monetization. While providing embedded data streams for Distributors, Content Creators
DOES YOUR OTT SERVICE HAVE TOO MANY MOVING PARTS? Evaluating the multi-vendor vs single vendor approaches
 DOES YOUR OTT SERVICE HAVE TOO MANY MOVING PARTS? Evaluating the multi-vendor vs single vendor approaches TABLE OF CONTENTS INTRODUCTION... 3 THE PRESENT: OTT INDUSTRY TODAY... 5 THE FUTURE: PERSONALIZED
INDUSTRY RESEARCH: MEDIA AND ENTERTAINMENT. Connected Audience Report Consumer insights on the biggest factors transforming the media industry
 INDUSTRY RESEARCH: MEDIA AND ENTERTAINMENT Connected Audience Report Consumer insights on the biggest factors transforming the media industry Table of Contents Executive Summary 3 01 02 03 04 05 Consumers
Sneak Peek StreamOn Report Preview
 Sneak Peek StreamOn Report Preview The following is an excerpt of some pages from the 2017 StreamOn research. Should you find this preview interesting and want to discuss the results further, please contact
Transitioning from Physical to Electronic Content Delivery
 Transitioning from Physical to Electronic Content Delivery Jim Taylor Chief Technologist, Rovi Corporation MEDIA-TECH Las Vegas, March 2011 The Evolution of Home Content Delivery Video Audio From VHS tapes
TECH TRACKER QUARTERLY RELEASE: Q4 2013
 TECH TRACKER QUARTERLY RELEASE: Q4 2013 QUARTERLY TRACKER - TRENDS IN INTERNET USAGE, TECH OWNERSHIP AND THE CONNECTED HOME GB FACE TO FACE SURVEY via Ipsos MORI Capibus LATEST WAVE QUARTER 4 2013 (Field
YouGov and the Digital Television Group
 YouGov and the Digital Television Group September 2014 Shaun Austin, Director Media Russell Feldman, Director Technology 020 7012 6090 Shaun.Austin@yougov.com 020 7012 6033 Russell.Feldman@yuogov.com Agenda
Monthly Performance Pack December Christopher Duggan, BBC iplayer BBC Communications
 Monthly Performance Pack ember 2014 Christopher Duggan, BBC iplayer BBC Communications 07753302778 christopher.duggan@bbc.co.uk Monthly summary ember 2014 Requests to BBC iplayer were virtually stable
Tech Tracker + Social Networking module Quarterly Release: Q1 2012
 1 Tech Tracker + Social Networking module Quarterly Release: Q1 2012 Quarterly tracker into trends in tech ownership, internet access areas covered Social Network Internet usage and the connected home
Accenture Pulse of Media survey: Mastering disruption in the digital world 2. PWC Entertainment & Media Outlook in Italy
 Today s tech-savvy, on-the-go consumers seek personalized television and video content at the time and place of their own choosing rather than being tied down by a broadcast schedule. The majority of these
Viewing Sources w/9.5 cume or higher Viewing Sources w/2.5 cume or higher. Fixed dayparts Standard and custom dayparts
 LOCAL TV Nielsen evip - FAQs OVERVIEW Q: What is Nielsen evip? Nielsen s evip is the official Browser and Tablet Application for Nielsen s Local TV Audience Estimates for subscribing Nielsen clients Q:
OTT IN THAILAND: AN ANALYSIS OF THE OPPORTUNITIES AND CONSTRAINTS
 OTT IN THAILAND: AN ANALYSIS OF THE OPPORTUNITIES AND CONSTRAINTS SIRIWAN ANANTHO Ph.D. Center for Communication Policy Study, School of Communication Arts, Sukhothai Thammathirat Open University E-mail:
 ClearPass Registration Guide ClearPass is a system at SVSU that allows users and residents to manage devices like gaming systems and digital media players for use with the campus wireless network. Users
Cisco Visual Networking Index: Forecast and Methodology,
 Cisco Visual Networking Index: Forecast and Methodology, June 6, 2017 This forecast is part of the Cisco Visual Networking Index (Cisco VNI ), an ongoing initiative to track and forecast the impact of
THE ONLINER A VIP FOR MARKETERS. Slovenia
 I THE ONLINER A VIP FOR MARKETERS Slovenia I INTERNET USAGE Internet usage is still growing slightly and is now close to the saturation point. Underlying developments such as a higher daily reach are stemming
IAB Ireland Video On Demand 2016
 IAB Ireland Video On Demand 2016 June 2016 In association with: 2 Agenda REACH TRENDS TIME REACTION What is the reach of VOD & who is a VOD user & how has this changed in the past year? (Market Reach &
White Label HD Broadcasting Enterprise Solution
 White Label HD Broadcasting Enterprise Solution 1 TikiLIVE Features Unlimited SD/HD/4K channels and VOD supported Auto-record every live event VOD and LIVE Transcoding Broadcast Live and Recorded media
Monthly Performance Pack November Christopher Duggan, BBC iplayer BBC Communications
 Monthly Performance Pack ember 2014 Christopher Duggan, BBC iplayer BBC Communications 07753302778 christopher.duggan@bbc.co.uk Monthly summary ember 2014 ember saw a record-breaking 334 million requests,