Data Analysis using SPSS
|
|
|
- Ralf Snow
- 6 years ago
- Views:
Transcription

1 Data Analysis using SPSS 2073/03/05 03/07 Bijay Lal Pradhan, Ph.D.
2 Ground Rule Mobile Penalty Participation Involvement
3 Introduction to SPSS Day /03/05 Session I Bijay Lal Pradhan, Ph.D.
4 Object of session I Define Statistics and SPSS Install SPSS 20 and crack Open and exit SPSS Importing and exporting data Different format of files
5 What is Statistics? Singular form: The process of collection, organization, presentation, analysis and interpretation of number facts. Plural form: Aggregate of facts which has different characteristics. Comparable Numerous factors effects Numerically expressed Systematically collected Purposefully collected Accurate reasonably
6 Introduction: What is SPSS? Originally it is an acronym of Statistical Package for the Social Science but now it stands for Statistical Product and Service Solutions One of the most popular statistical packages which can perform highly complex data organization, presentation and analysis with simple instructions.
7 The Three Windows: Data editor Output viewer Syntax editor

8 The Three Windows: Data Editor Data Editor Spreadsheet-like system for defining, entering, editing, and displaying data. Extension of the saved file will be sav.

9 The Three Windows: Output Viewer Output Viewer Displays output and errors. Extension of the saved file will be spv.

10 The Three Windows: Syntax editor Syntax Editor Text editor for syntax composition. Extension of the saved file will be sps.
11 The basics of managing software.
12 Installation of SPSS 20.0 You have software SPSS 20.0 in your computer There are two folders namely setup and crack Open setup folder and double click on application file setup. Follow the instruction and install SPSS in your computer. Don t go for licensing process. Copy "lservrc" from crack folder and paste it into the installed directory (C:\Programme\ IBM\SPSS\Statistics\20)

13 Opening Screen From start button click on IBM SPSS Statistics 20

14 Obtain the data Open your saved file with SPSS data1.sav 14

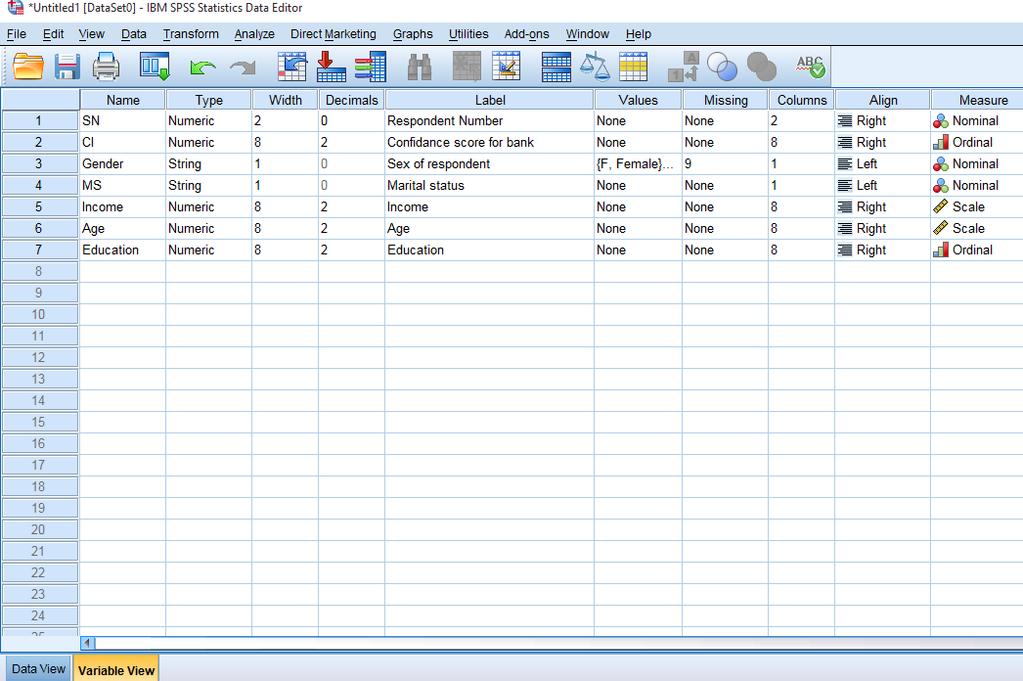
15 Variable descriptions Drop down menus Variable View Action buttons 15

16 Variable View window: Type Type Click on the type box. The two basic types of variables that you will use are numeric and string. This column enables you to specify the type of variable.
17 Variable View window: Width Width Width allows you to determine the number of characters SPSS will allow to be entered for the variable
18 Variable View window: Decimals Decimals Number of decimals It has to be less than or equal to
19 Variable View window: Label Label You can specify the details of the variable You can write characters with spaces up to 256 characters

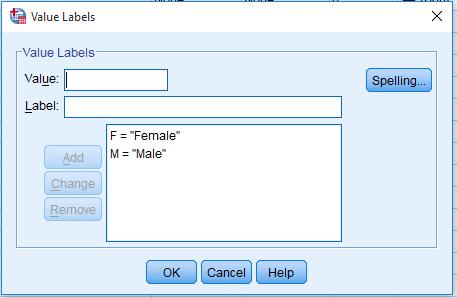
20 Variable View window: Values Values This is used and to suggest which numbers represent which categories when the variable represents a category


21 Defining the value labels Click the cell in the values column as shown below For the value, and the label, you can put up to 60 characters. After defining the values click add and then click OK. Click

22 Measure scale?? Nominal Ordinal Scale

23 Nominal Gender Caste Marital status

24 Ordinal? First Second Third..

25 Scale Scale
26 Scales of Measure Scale Basic Characteristics Nominal Numbers identify & classify objects Ordinal Ratio Nos. indicate the relative positions of objects but not the magnitude of differences between them Zero point is fixed, ratios of scale values can be compared Examples Examples Social Security nos., numbering of football players Quality rankings, rankings of teams in a tournament Length, weight Brand nos., store types Preference rankings, market position, social class Age, sales, income, costs Permissible Statistics Descriptive Inferential Percentages, mode Percentile, median quartile deviation Arithmatic, Geometric harmonic mean range MD SD Chi-square, binomial test Rank-order correlation, Friedman ANOVA Z test, t-test, ANOVA test all other tests

27 Data Editor Action buttons

28 SPSS output viewer Drop down menus Action buttons Navigation window 28

29 SPSS Viewer export results 29

30 Syntax Editor Drop down menus Action buttons Navigation window 30
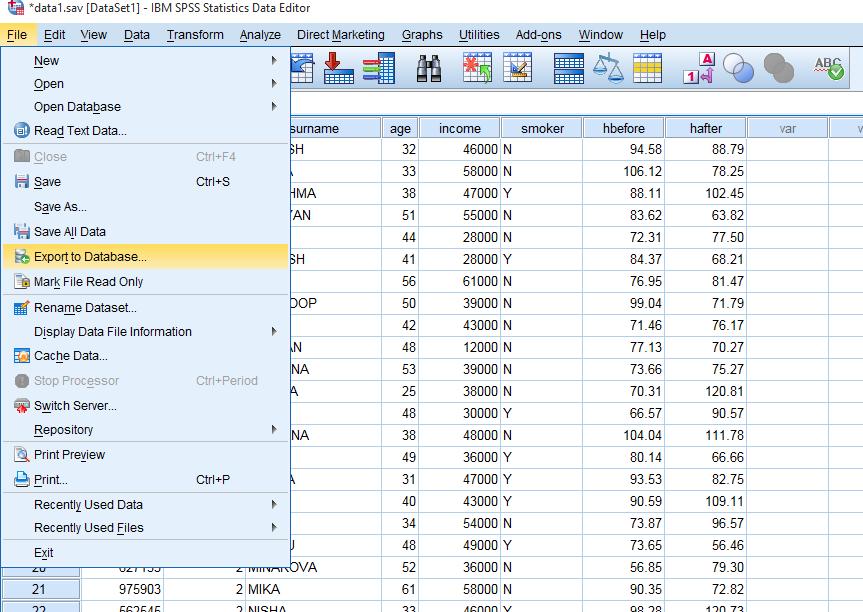
31 Export
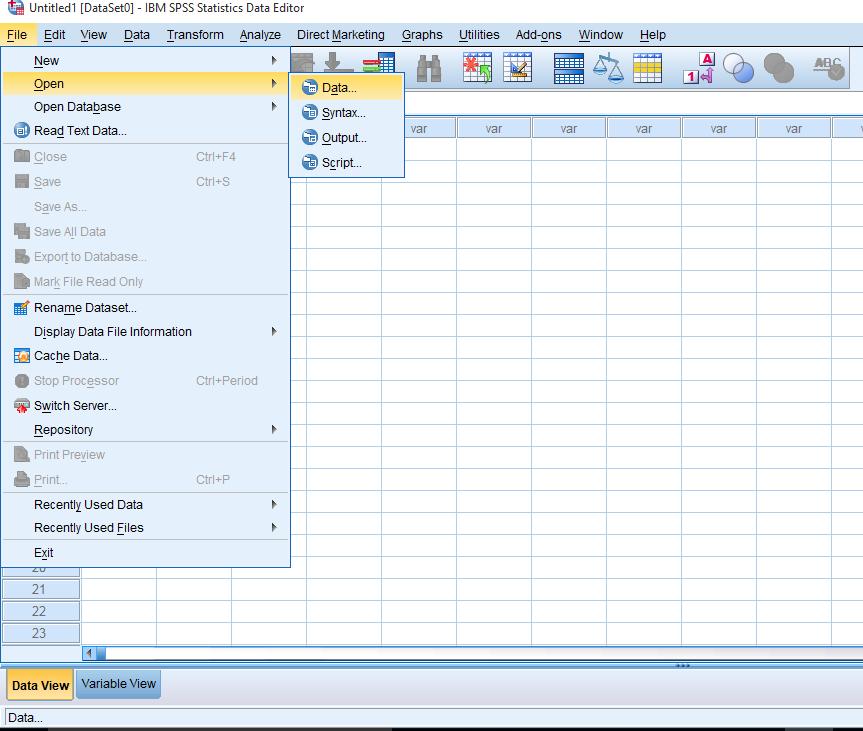
32 Import
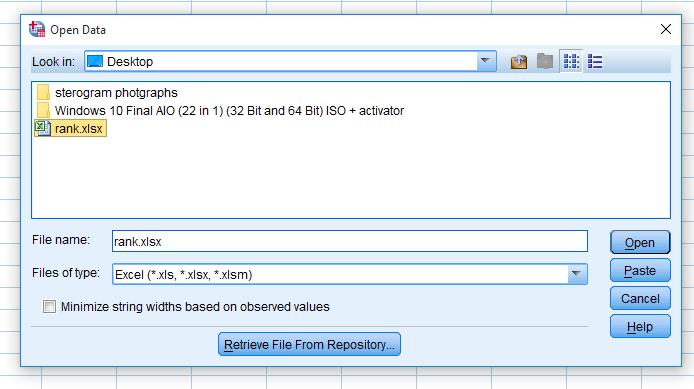
33 Import
34 Data management with SPSS Day /03/05 Session II
35 Practice 1 Construct the following variables in the variable view on the basis of following information A study was conducted to know the attitude of a bank s customer towards the bank. The question asked to the customer was: Do you feel safe in your transactions with the bank? The respondents were to answer the question on a seven-point scale (1 = Strongly Disagree, 7 = Strongly Agree). There were other variables mentioned below on which data was collected.
36 Other variable 1. Sex of the respondent Male - M Female - F 2. Marital status Married - M Single - S 3. Income of the respondent (in rupees) 4. Age of the respondent (in years) 5. Educational background of the respondent Below higher secondary - 1 Higher secondary - 2 Graduation - 3 Post graduation - 4
37 Click

38 Entering Data Copy paste can be done to copy it from word to SPSS. First copy paste in to MS Excel and then to SPSS. Save the data in Excel and import to SPSS Or save in CSV format then to SPSS
39 Variable/Case in and out Entering new variable Deleting the existing variable Entering new case Deleting the existing cases

40 Saving the data To save the data file you created simply click file and click save as. You can save the file in different forms by clicking Save as type. Click

41 Sorting the data Click Data and then click Sort Cases
")


42 Sorting the data (cont d) Double Click Name of the students. Then click ok. Click Click

43 Transforming data Click Transform and then click Compute Variable

44 Transforming data (cont d) Example: Adding a new variable named corrected_ci which is corrected confidence interval Type in corrected_ci in the Target Variable box. Then type in 8-CI in the Numeric Expression box. Click OK Click
45 Transforming data (cont d) In the same way find the log(income) Type in ln_income in the Target Variable box. Then type in lnincome in the Numeric Expression box. Click OK In the similar manner Create a new variable named sqrtage which is the square root of age.
46 Visual Binning Visual Binning is the process of arranging data in a suitable class. So that we can tabulate data and can be drawn conclusion from the scale type of data.
47 For further Questions:
IENG484 Quality Engineering Lab 1 RESEARCH ASSISTANT SHADI BOLOUKIFAR
 IENG484 Quality Engineering Lab 1 RESEARCH ASSISTANT SHADI BOLOUKIFAR SPSS (Statistical package for social science) Originally is acronym of Statistical Package for the Social Science but, now it stands
Statistical Package for the Social Sciences INTRODUCTION TO SPSS SPSS for Windows Version 16.0: Its first version in 1968 In 1975.
 Statistical Package for the Social Sciences INTRODUCTION TO SPSS SPSS for Windows Version 16.0: Its first version in 1968 In 1975. SPSS Statistics were designed INTRODUCTION TO SPSS Objective About the
INTRODUCTION TO SPSS OUTLINE 6/17/2013. Assoc. Prof. Dr. Md. Mujibur Rahman Room No. BN Phone:
 INTRODUCTION TO SPSS Assoc. Prof. Dr. Md. Mujibur Rahman Room No. BN-0-024 Phone: 89287269 E-mail: mujibur@uniten.edu.my OUTLINE About the four-windows in SPSS The basics of managing data files The basic
Research Data Analysis using SPSS. By Dr.Anura Karunarathne Senior Lecturer, Department of Accountancy University of Kelaniya
 Research Data Analysis using SPSS By Dr.Anura Karunarathne Senior Lecturer, Department of Accountancy University of Kelaniya MBA 61013- Business Statistics and Research Methodology Learning outcomes At
1. Basic Steps for Data Analysis Data Editor. 2.4.To create a new SPSS file
 1 SPSS Guide 2009 Content 1. Basic Steps for Data Analysis. 3 2. Data Editor. 2.4.To create a new SPSS file 3 4 3. Data Analysis/ Frequencies. 5 4. Recoding the variable into classes.. 5 5. Data Analysis/
Data analysis using Microsoft Excel
 Introduction to Statistics Statistics may be defined as the science of collection, organization presentation analysis and interpretation of numerical data from the logical analysis. 1.Collection of Data
Mr. Kongmany Chaleunvong. GFMER - WHO - UNFPA - LAO PDR Training Course in Reproductive Health Research Vientiane, 22 October 2009
 Mr. Kongmany Chaleunvong GFMER - WHO - UNFPA - LAO PDR Training Course in Reproductive Health Research Vientiane, 22 October 2009 1 Object of the Course Introduction to SPSS The basics of managing data
INTRODUCTORY SPSS. Dr Feroz Mahomed Swalaha x2689
 INTRODUCTORY SPSS Dr Feroz Mahomed Swalaha fswalaha@dut.ac.za x2689 1 Statistics (the systematic collection and display of numerical data) is the most abused area of numeracy. 97% of statistics are made
User Services Spring 2008 OBJECTIVES Introduction Getting Help Instructors
 User Services Spring 2008 OBJECTIVES Use the Data Editor of SPSS 15.0 to to import data. Recode existing variables and compute new variables Use SPSS utilities and options Conduct basic statistical tests.
Basic concepts and terms
 CHAPTER ONE Basic concepts and terms I. Key concepts Test usefulness Reliability Construct validity Authenticity Interactiveness Impact Practicality Assessment Measurement Test Evaluation Grading/marking
Introduction (SPSS) Opening SPSS Start All Programs SPSS Inc SPSS 21. SPSS Menus
 Opening SPSS Start All Programs SPSS Inc SPSS 21. SPSS Menus") Introduction (SPSS) SPSS is the acronym of Statistical Package for the Social Sciences. SPSS is one of the most popular statistical packages which can perform highly complex data manipulation and analysis
Introduction (SPSS) SPSS is the acronym of Statistical Package for the Social Sciences. SPSS is one of the most popular statistical packages which can perform highly complex data manipulation and analysis
Creating a data file and entering data
 4 Creating a data file and entering data There are a number of stages in the process of setting up a data file and analysing the data. The flow chart shown on the next page outlines the main steps that
SPSS for Survey Analysis
 STC: SPSS for Survey Analysis 1 SPSS for Survey Analysis STC: SPSS for Survey Analysis 2 SPSS for Surveys: Contents Background Information... 4 Opening and creating new documents... 5 Starting SPSS...
A Simple Guide to Using SPSS (Statistical Package for the. Introduction. Steps for Analyzing Data. Social Sciences) for Windows
 for Windows") A Simple Guide to Using SPSS (Statistical Package for the Social Sciences) for Windows Introduction ٢ Steps for Analyzing Data Enter the data Select the procedure and options Select the variables Run the
A Simple Guide to Using SPSS (Statistical Package for the Social Sciences) for Windows Introduction ٢ Steps for Analyzing Data Enter the data Select the procedure and options Select the variables Run the
Dr Wan Nor Arifin Unit of Biostatistics and Research Methodology, Universiti Sains Malaysia.
 Introduction to SPSS Dr Wan Nor Arifin Unit of Biostatistics and Research Methodology, Universiti Sains Malaysia. wnarifin@usm.my Outlines Introduction Data Editor Data View Variable View Menus Shortcut
22/10/16. Data Coding in SPSS. Data Coding in SPSS. Data Coding in SPSS. Data Coding in SPSS
 DATA CODING IN SPSS STAFF TRAINING WORKSHOP March 28, 2017 Delivered by Dr. Director of Applied Economics Unit African Heritage Institution Enugu Nigeria To code data in SPSS, Lunch the SPSS The Data Editor
UNIT 4. Research Methods in Business
 UNIT 4 Preparing Data for Analysis:- After data are obtained through questionnaires, interviews, observation or through secondary sources, they need to be edited. The blank responses, if any have to be
DEPARTMENT OF HEALTH AND HUMAN SCIENCES HS900 RESEARCH METHODS
 DEPARTMENT OF HEALTH AND HUMAN SCIENCES HS900 RESEARCH METHODS Using SPSS Topics addressed today: 1. Accessing data from CMR 2. Starting SPSS 3. Getting familiar with SPSS 4. Entering data 5. Saving data
IBMSPSSSTATL1P: IBM SPSS Statistics Level 1
 SPSS IBMSPSSSTATL1P IBMSPSSSTATL1P: IBM SPSS Statistics Level 1 Version: 4.4 QUESTION NO: 1 Which statement concerning IBM SPSS Statistics application windows is correct? A. At least one Data Editor window
How to Use a Statistical Package
 APPENDIX D How to Use a Statistical Package Candace M. Evans, Lisa M. Gilman, Jeffrey Xavier, Joan Saxton Weber Computers and statistical software such as the Statistical Package for the Social Sciences
Research Methods for Business and Management. Session 8a- Analyzing Quantitative Data- using SPSS 16 Andre Samuel
 Research Methods for Business and Management Session 8a- Analyzing Quantitative Data- using SPSS 16 Andre Samuel A Simple Example- Gym Purpose of Questionnaire- to determine the participants involvement
INTRODUCTION TO SPSS. Anne Schad Bergsaker 13. September 2018
 INTRODUCTION TO SPSS Anne Schad Bergsaker 13. September 2018 BEFORE WE BEGIN... LEARNING GOALS 1. Be familiar with and know how to navigate between the different windows in SPSS 2. Know how to write a
Summarising Data. Mark Lunt 09/10/2018. Arthritis Research UK Epidemiology Unit University of Manchester
 Summarising Data Mark Lunt Arthritis Research UK Epidemiology Unit University of Manchester 09/10/2018 Summarising Data Today we will consider Different types of data Appropriate ways to summarise these
IBM SPSS Statistics 22 Brief Guide
 IBM SPSS Statistics 22 Brief Guide Note Before using this information and the product it supports, read the information in Notices on page 77. Product Information This edition applies to version 22, release
Introduction to SPSS
 Introduction to SPSS Purpose The purpose of this assignment is to introduce you to SPSS, the most commonly used statistical package in the social sciences. You will create a new data file and calculate
Nuts and Bolts Research Methods Symposium
 Organizing Your Data Jenny Holcombe, PhD UT College of Medicine Nuts & Bolts Conference August 16, 3013 Topics to Discuss: Types of Variables Constructing a Variable Code Book Developing Excel Spreadsheets
Surviving SPSS.
 Surviving SPSS http://dataservices.gmu.edu/workshops/spss http://dataservices.gmu.edu/software/spss Debby Kermer George Mason University Libraries Data Services Research Consultant Mason Data Services
Handling Your Data in SPSS. Columns, and Labels, and Values... Oh My! The Structure of SPSS. You should think about SPSS as having three major parts.
 Handling Your Data in SPSS Columns, and Labels, and Values... Oh My! You might think that simple intuition will guide you to a useful organization of your data. If you follow that path, you might find
MHPE 494: Data Analysis. Welcome! The Analytic Process
 MHPE 494: Data Analysis Alan Schwartz, PhD Department of Medical Education Memoona Hasnain,, MD, PhD, MHPE Department of Family Medicine College of Medicine University of Illinois at Chicago Welcome! Your
Data Analysis and Solver Plugins for KSpread USER S MANUAL. Tomasz Maliszewski
 Data Analysis and Solver Plugins for KSpread USER S MANUAL Tomasz Maliszewski tmaliszewski@wp.pl Table of Content CHAPTER 1: INTRODUCTION... 3 1.1. ABOUT DATA ANALYSIS PLUGIN... 3 1.3. ABOUT SOLVER PLUGIN...
Create Custom Tables in No Time
 PASW Custom Tables 18 Create Custom Tables in No Time Easily analyze data and communicate your results with PASW Custom Tables Show the results of analyses clearly and quickly You often report the results
AcaStat User Manual. Version 8.3 for Mac and Windows. Copyright 2014, AcaStat Software. All rights Reserved.
 AcaStat User Manual Version 8.3 for Mac and Windows Copyright 2014, AcaStat Software. All rights Reserved. http://www.acastat.com Table of Contents INTRODUCTION... 5 GETTING HELP... 5 INSTALLATION... 5
How to Use a Statistical Package
 APPENDIX F How to Use a Statistical Package With the assistance of Lisa M. Gilman and Jeffrey Xavier and with contributions by Joan Saxton Weber Computers and statistical software such as the Statistical
Econ Stata Tutorial I: Reading, Organizing and Describing Data. Sanjaya DeSilva
 Econ 329 - Stata Tutorial I: Reading, Organizing and Describing Data Sanjaya DeSilva September 8, 2008 1 Basics When you open Stata, you will see four windows. 1. The Results window list all the commands
LSP 121. LSP 121 Math and Tech Literacy II. Topics. Quartiles. Intro to Statistics. More Descriptive Statistics
 Greg Brewster, DePaul University Page 1 LSP 121 Math and Tech Literacy II More Descriptive Statistics Greg Brewster DePaul University Topics More Descriptive Statistics Quartiles Percentiles Categorical
Computers and statistical software such as the Statistical Package for the Social Sciences (SPSS) make complex statistical
 make complex statistical") Appendix C How to Use a Statistical Package With The Assistance of Lisa M. Gilman and with Contributions By Joan Saxton Weber Computers and statistical software such as the Statistical Package for the
Appendix C How to Use a Statistical Package With The Assistance of Lisa M. Gilman and with Contributions By Joan Saxton Weber Computers and statistical software such as the Statistical Package for the
How to Use a Statistical Package
 E App-Bachman-45191.qxd 1/31/2007 3:32 PM Page E-1 A P P E N D I X E How to Use a Statistical Package WITH THE ASSISTANCE OF LISA M. GILMAN AND WITH CONTRIBUTIONS BY JOAN SAXTON WEBER Computers and statistical
Frequency Distributions and Descriptive Statistics in SPS
 230 Combs Building 859.622.3050 studentcomputing.eku.edu studentcomputing@eku.edu Frequency Distributions and Descriptive Statistics in SPSS In this tutorial, we re going to work through a sample problem
StatCalc User Manual. Version 9 for Mac and Windows. Copyright 2018, AcaStat Software. All rights Reserved.
 StatCalc User Manual Version 9 for Mac and Windows Copyright 2018, AcaStat Software. All rights Reserved. http://www.acastat.com Table of Contents Introduction... 4 Getting Help... 4 Uninstalling StatCalc...
Introduction to SPSS Edward A. Greenberg, PhD
 Introduction to SPSS Edward A. Greenberg, PhD ASU HEALTH SOLUTIONS DATA LAB JANUARY 7, 2013 Files for this workshop Files can be downloaded from: http://www.public.asu.edu/~eagle/spss or (with less typing):
STATA 13 INTRODUCTION
 STATA 13 INTRODUCTION Catherine McGowan & Elaine Williamson LONDON SCHOOL OF HYGIENE & TROPICAL MEDICINE DECEMBER 2013 0 CONTENTS INTRODUCTION... 1 Versions of STATA... 1 OPENING STATA... 1 THE STATA
Introduction. About this Document. What is SPSS. ohow to get SPSS. oopening Data
 Introduction About this Document This manual was written by members of the Statistical Consulting Program as an introduction to SPSS 12.0. It is designed to assist new users in familiarizing themselves
Digital literacy training
 Digital literacy training SPSS Introduction 2018 ANU Library anulib.anu.edu.au/training digital.literacy@anu.edu.au Table of Contents To start SPSS... 1 Import Excel files... 1 The Data View window...
Correctly Compute Complex Samples Statistics
 SPSS Complex Samples 15.0 Specifications Correctly Compute Complex Samples Statistics When you conduct sample surveys, use a statistics package dedicated to producing correct estimates for complex sample
Organizing Your Data. Jenny Holcombe, PhD UT College of Medicine Nuts & Bolts Conference August 16, 3013
 Organizing Your Data Jenny Holcombe, PhD UT College of Medicine Nuts & Bolts Conference August 16, 3013 Learning Objectives Identify Different Types of Variables Appropriately Naming Variables Constructing
SPSS. (Statistical Packages for the Social Sciences)
") Inger Persson SPSS (Statistical Packages for the Social Sciences) SHORT INSTRUCTIONS This presentation contains only relatively short instructions on how to perform basic statistical calculations in SPSS.
Inger Persson SPSS (Statistical Packages for the Social Sciences) SHORT INSTRUCTIONS This presentation contains only relatively short instructions on how to perform basic statistical calculations in SPSS.
Opening a Data File in SPSS. Defining Variables in SPSS
 Opening a Data File in SPSS To open an existing SPSS file: 1. Click File Open Data. Go to the appropriate directory and find the name of the appropriate file. SPSS defaults to opening SPSS data files with
Fact Sheet No.1 MERLIN
 Fact Sheet No.1 MERLIN Fact Sheet No.1: MERLIN Page 1 1 Overview MERLIN is a comprehensive software package for survey data processing. It has been developed for over forty years on a wide variety of systems,
Brief Guide on Using SPSS 10.0
 Brief Guide on Using SPSS 10.0 (Use student data, 22 cases, studentp.dat in Dr. Chang s Data Directory Page) (Page address: http://www.cis.ysu.edu/~chang/stat/) I. Processing File and Data To open a new
Hypermarket Retail Analysis Customer Buying Behavior. Reachout Analytics Client Sample Report
 Hypermarket Retail Analysis Customer Buying Behavior Report Tools Used: R Python WEKA Techniques Applied: Comparesion Tests Association Tests Requirement 1: All the Store Brand significance to Gender Towards
Chapter 2. Basic Operations. you through the routine procedures that you will use nearly every time you work with SPSS.
 1 Chapter 2 Basic Operations Chapter 1 presented a very conceptual overview of SPSS. The present chapter will walk you through the routine procedures that you will use nearly every time you work with SPSS.
Ivy s Business Analytics Foundation Certification Details (Module I + II+ III + IV + V)
") Ivy s Business Analytics Foundation Certification Details (Module I + II+ III + IV + V) Based on Industry Cases, Live Exercises, & Industry Executed Projects Module (I) Analytics Essentials 81 hrs 1. Statistics
Ivy s Business Analytics Foundation Certification Details (Module I + II+ III + IV + V) Based on Industry Cases, Live Exercises, & Industry Executed Projects Module (I) Analytics Essentials 81 hrs 1. Statistics
Example how not to do it: JMP in a nutshell 1 HR, 17 Apr Subject Gender Condition Turn Reactiontime. A1 male filler
 JMP in a nutshell 1 HR, 17 Apr 2018 The software JMP Pro 14 is installed on the Macs of the Phonetics Institute. Private versions can be bought from
7.4 Tutorial #4: Profiling LC Segments Using the CHAID Option
 7.4 Tutorial #4: Profiling LC Segments Using the CHAID Option DemoData = gss82.sav After an LC model is estimated, it is often desirable to describe (profile) the resulting latent classes in terms of demographic
2016 SPSS Workshop UBC Research Commons
 " 2016 SPSS Workshop #2 @ UBC Research Commons Part 1: Data Management The Select Cases Command Menu: Data Select Cases 1. Option 1- randomly selecting cases Select Random sample of cases, click on Sample,
There are 3 main windows, and 3 main types of files, in SPSS: Data, Syntax, and Output.
 U6310 Quantitative Techniques Lab - September 2001 Intro to SPSS SPSS works like this: You have a data set (either you create one or use an existing file such as the GSS). You choose analysis techniques
DATA DEFINITION PHASE
 Twoway Analysis of Variance Unlike previous problems in the manual, the present problem involves two independent variables (gender of juror and type of crime committed by defendant). There are two levels
17 - VARIABLES... 1 DOCUMENT AND CODE VARIABLES IN MAXQDA Document Variables Code Variables... 1
 17 - Variables Contents 17 - VARIABLES... 1 DOCUMENT AND CODE VARIABLES IN MAXQDA... 1 Document Variables... 1 Code Variables... 1 The List of document variables and the List of code variables... 1 Managing
How to extract suicide statistics by country from the. WHO Mortality Database Online Tool
 Instructions for users How to extract suicide statistics by country from the WHO Mortality Database Online Tool This guide explains how to access suicide statistics and make graphs and tables, or export
STATS PAD USER MANUAL
 STATS PAD USER MANUAL For Version 2.0 Manual Version 2.0 1 Table of Contents Basic Navigation! 3 Settings! 7 Entering Data! 7 Sharing Data! 8 Managing Files! 10 Running Tests! 11 Interpreting Output! 11
2.1 Objectives. Math Chapter 2. Chapter 2. Variable. Categorical Variable EXPLORING DATA WITH GRAPHS AND NUMERICAL SUMMARIES
 EXPLORING DATA WITH GRAPHS AND NUMERICAL SUMMARIES Chapter 2 2.1 Objectives 2.1 What Are the Types of Data? www.managementscientist.org 1. Know the definitions of a. Variable b. Categorical versus quantitative
ARTIFICIAL INTELLIGENCE (CS 370D)
") Princess Nora University Faculty of Computer & Information Systems ARTIFICIAL INTELLIGENCE (CS 370D) (CHAPTER-18) LEARNING FROM EXAMPLES DECISION TREES Outline 1- Introduction 2- know your data 3- Classification
Princess Nora University Faculty of Computer & Information Systems ARTIFICIAL INTELLIGENCE (CS 370D) (CHAPTER-18) LEARNING FROM EXAMPLES DECISION TREES Outline 1- Introduction 2- know your data 3- Classification
SPSS QM II. SPSS Manual Quantitative methods II (7.5hp) SHORT INSTRUCTIONS BE CAREFUL
 SHORT INSTRUCTIONS BE CAREFUL") SPSS QM II SHORT INSTRUCTIONS This presentation contains only relatively short instructions on how to perform some statistical analyses in SPSS. Details around a certain function/analysis method not covered
SPSS QM II SHORT INSTRUCTIONS This presentation contains only relatively short instructions on how to perform some statistical analyses in SPSS. Details around a certain function/analysis method not covered
 Example 1 - Joining datasets by a common variable: Creating a single table using multiple datasets Other features illustrated: Aggregate data multi-variable recode, computational calculation Background:
Navigating in SPSS. C h a p t e r 2 OBJECTIVES
 C h a p t e r 2 Navigating in SPSS 2.1 Introduction and Objectives As with any new software program you may use, it is important that you are able to move around the screen with the mouse and that you
APPENDIX B EXCEL BASICS 1
 APPENDIX B EXCEL BASICS 1 Microsoft Excel is a powerful application for education researchers and students studying educational statistics. Excel worksheets can hold data for a variety of uses and therefore
ICT & MATHS. Excel 2003 in Mathematics Teaching
 ICT & MATHS Excel 2003 in Mathematics Teaching Published by The National Centre for Technology in Education in association with the Project Maths Development Team. Permission granted to reproduce for educational
UNESCO, Division for Planning and Development of Education Systems, Section for Sector Policy Advice and ICT in Education (ED/PDE/PAD)
") Guidelines for On- line Data E ntry and Downloading Impact of the Global Financial and Economic Crisis on Education in Selected Developing Countries (DFID RIVAF) UNESCO, Division for Planning and Development
Guidelines for On- line Data E ntry and Downloading Impact of the Global Financial and Economic Crisis on Education in Selected Developing Countries (DFID RIVAF) UNESCO, Division for Planning and Development
AND NUMERICAL SUMMARIES. Chapter 2
 EXPLORING DATA WITH GRAPHS AND NUMERICAL SUMMARIES Chapter 2 2.1 What Are the Types of Data? 2.1 Objectives www.managementscientist.org 1. Know the definitions of a. Variable b. Categorical versus quantitative
ICSSR Data Service Indian Social Science Data Repository R : User Guide Indian Council of Social Science Research
 http://www.icssrdataservice.in/ ICSSR Data Service Indian Social Science Data Repository R : User Guide Indian Council of Social Science Research ICSSR Data Service Contents 1. Introduction 1 2. Installation
MKTG 460 Winter 2019 Solutions #1
 MKTG 460 Winter 2019 Solutions #1 Short Answer: Data Analysis 1. What is a data table and how are the data values organized? A data table stores the data values for variables across different observations,
MAXQDA Stats Reference Manual. Statistical Analysis with MAXQDA
 MAXQDA Stats Reference Manual Statistical Analysis with MAXQDA Support, Distribution: VERBI Software. Consult. Sozialforschung. GmbH Berlin/Germany http://www.maxqda.com MAXQDA is a registered trademark
Barchard Introduction to SPSS Marks
 Barchard Introduction to SPSS 22.0 3 Marks Purpose The purpose of this assignment is to introduce you to SPSS, the most commonly used statistical package in the social sciences. You will create a new data
4. Descriptive Statistics: Measures of Variability and Central Tendency
 4. Descriptive Statistics: Measures of Variability and Central Tendency Objectives Calculate descriptive for continuous and categorical data Edit output tables Although measures of central tendency and
Tests of difference for two sample designs. Bivariate and multiple regression. Analysis of covariance and multivariate analysis of variance
 Chapter 1 Introduction 1 Chapter 2 Chapter 3 Chapter 4 Chapter 5 Chapter 6 Chapter 7 Chapter 8 Chapter 9 Chapter 10 Chapter 11 Chapter 12 Chapter 13 Data entry in SPSS Exploring data in SPSS Data handling
Averages and Variation
 Averages and Variation 3 Copyright Cengage Learning. All rights reserved. 3.1-1 Section 3.1 Measures of Central Tendency: Mode, Median, and Mean Copyright Cengage Learning. All rights reserved. 3.1-2 Focus
Making Tables and Figures
 Making Tables and Figures Don Quick Colorado State University Tables and figures are used in most fields of study to provide a visual presentation of important information to the reader. They are used
LESSON 3: CENTRAL TENDENCY
 LESSON 3: CENTRAL TENDENCY Outline Arithmetic mean, median and mode Ungrouped data Grouped data Percentiles, fractiles, and quartiles Ungrouped data Grouped data 1 MEAN Mean is defined as follows: Sum
Contents. 1. Survey Background and Methodology. 2. Summary of Key Findings. 3. Survey Results. 4. Appendix
 Mobile Trends 2014 Contents 1. Survey Background and Methodology 2. Summary of Key Findings 3. Survey Results 4. Appendix 2 Research Methodology Method Sample Size Online survey programmed and hosted by
R for IR. Created by Narren Brown, Grinnell College, and Diane Saphire, Trinity University
 R for IR Created by Narren Brown, Grinnell College, and Diane Saphire, Trinity University For presentation at the June 2013 Meeting of the Higher Education Data Sharing Consortium Table of Contents I.
CLAREMONT MCKENNA COLLEGE. Fletcher Jones Student Peer to Peer Technology Training Program. Basic Statistics using Stata
 CLAREMONT MCKENNA COLLEGE Fletcher Jones Student Peer to Peer Technology Training Program Basic Statistics using Stata An Introduction to Stata A Comparison of Statistical Packages... 3 Opening Stata...
Select Cases. Select Cases GRAPHS. The Select Cases command excludes from further. selection criteria. Select Use filter variables
 Select Cases GRAPHS The Select Cases command excludes from further analysis all those cases that do not meet specified selection criteria. Select Cases For a subset of the datafile, use Select Cases. In
8. MINITAB COMMANDS WEEK-BY-WEEK
 8. MINITAB COMMANDS WEEK-BY-WEEK In this section of the Study Guide, we give brief information about the Minitab commands that are needed to apply the statistical methods in each week s study. They are
THE BASICS OF USING SPSS OCTOBER 22, 2008
 Faculty Research Center College of Education http://frc.coe.nau.edu/ OCTOBER 22, 2008 PRESENTED BY: Robert A. Horn, Ph.D. Assistant Professor, Educational Psychology 928-523-0545 Robert.Horn@nau.edu PRESENTATION
SPSS. Faiez Mussa. 2 nd class
 SPSS Faiez Mussa 2 nd class Objectives To describe opening and closing SPSS To introduce the look and structure of SPSS To introduce the data entry windows: Data View and Variable View To outline the components
WINCROSS EXECUTIVE Getting Started
 WINCROSS EXECUTIVE Getting Started The Analytical Group, Inc. WinCross Executive 1 Getting Started 2 Version 1 Copyright 2018, The Analytical Group, Inc. Editor: Pete Hilmers All rights reserved. No part
Introduction to Stata - Session 2
 Introduction to Stata - Session 2 Siv-Elisabeth Skjelbred ECON 3150/4150, UiO January 26, 2016 1 / 29 Before we start Download auto.dta, auto.csv from course home page and save to your stata course folder.
Selected Introductory Statistical and Data Manipulation Procedures. Gordon & Johnson 2002 Minitab version 13.
 Minitab@Oneonta.Manual: Selected Introductory Statistical and Data Manipulation Procedures Gordon & Johnson 2002 Minitab version 13.0 Minitab@Oneonta.Manual: Selected Introductory Statistical and Data
Surviving SPSS.
 Surviving SPSS http://dataservices.gmu.edu/workshops/spss http://dataservices.gmu.edu/software/spss Debby Kermer George Mason University Libraries Data Services Research Consultant Mason Data Services
StatsMate. User Guide
 StatsMate User Guide Overview StatsMate is an easy-to-use powerful statistical calculator. It has been featured by Apple on Apps For Learning Math in the App Stores around the world. StatsMate comes with
OneView. User s Guide
 OneView User s Guide Welcome to OneView. This user guide will show you everything you need to know to access and utilize the wealth of information available from OneView. The OneView program is an Internet-based
Beyond 20/20. QuickStart Guide. Version 7.0, SP3
 Beyond 20/20 QuickStart Guide Version 7.0, SP3 Notice of Copyright Beyond 20/20 Desktop Browser Version 7.0, SP3 Copyright 1992-2006 Beyond 20/20 Inc. All rights reserved. This document forms part of the
Quantitative - One Population
 Quantitative - One Population The Quantitative One Population VISA procedures allow the user to perform descriptive and inferential procedures for problems involving one population with quantitative (interval)
Table of Contents (As covered from textbook)
") Table of Contents (As covered from textbook) Ch 1 Data and Decisions Ch 2 Displaying and Describing Categorical Data Ch 3 Displaying and Describing Quantitative Data Ch 4 Correlation and Linear Regression
Table of Contents (As covered from textbook) Ch 1 Data and Decisions Ch 2 Displaying and Describing Categorical Data Ch 3 Displaying and Describing Quantitative Data Ch 4 Correlation and Linear Regression
Simmons OneView SM. How to Interpret Quick Reports Simmons OneView: How to Interpret Quick Reports Page 1
 Simmons OneView SM How to Interpret Quick Reports Simmons OneView: How to Interpret Quick Reports Page 1 Demographic Profile (No Base, Population Weighted) Median Household Income: The median household
Login: Quick Guide for Qualtrics May 2018 Training:
 Qualtrics Basics Creating a New Qualtrics Account Note: Anyone with a Purdue career account can create a Qualtrics account. 1. In a Web browser, navigate to purdue.qualtrics.com. 2. Enter your Purdue Career
Introduction to SPSS Faiez Mossa 2 nd Class
 Introduction to SPSS 16.0 Faiez Mossa 2 nd Class 1 Outline Review of Concepts (stats and scales) Data entry (the workspace and labels) By hand Import Excel Running an analysis- frequency, central tendency,
Stata v 12 Illustration. First Session
 Launch Stata PC Users Stata v 12 Illustration Mac Users START > ALL PROGRAMS > Stata; or Double click on the Stata icon on your desktop APPLICATIONS > STATA folder > Stata; or Double click on the Stata
Chapter 1. Manage the data
 1.1. Coding of survey questions Appendix A shows a questionnaire with the corresponding coding sheet. Some observations of the selected variables are shown in the following table. AGE SEX JOB INCOME EDUCATE
IST Computational Tools for Statistics I. DEÜ, Department of Statistics
 IST 1051 Computational Tools for Statistics I 1 DEÜ, Department of Statistics Course Objectives Computational Tools for Statistics-I course can increase the understanding of statistics and helps to learn