Research Methods for Business and Management. Session 8a- Analyzing Quantitative Data- using SPSS 16 Andre Samuel
|
|
|
- Lawrence Haynes
- 6 years ago
- Views:
Transcription
1 Research Methods for Business and Management Session 8a- Analyzing Quantitative Data- using SPSS 16 Andre Samuel
2 A Simple Example- Gym Purpose of Questionnaire- to determine the participants involvement in adult fitness Reasons for going to the gym Kinds of activities adults participate in to determine if Involvement is associated with attitudinal loyalty Issues related to gender and age
3 Using SPSS Step 1- use coded Questionnaire to Define Variables using Variable Viewer. Each question is a Variable. Step 2- Input data into Data Viewer. Each completed questionnaire is a case. Step 3- Analyze data using Analyze Menu and Graphs Menu

4 SPSS Data Viewer Each Column represents a Variable Each Row represents a Case

5 Step 1- Defining Variables Click on the Variable View tab at the bottom of the Data Viewer

6 For each variable (question) enter a Name, Label, Values and Measure Enter variable in a new row
7 Enter Name For each variable enter a name Click on the first cell in the Name column Type the name e.g. Q1 or Gender The name must not be longer than 8 characters and cannot contain spaces
8 Enter Label You can give each variable a more detailed name, known as a Label Click on the first cell under the Label column Type in the label you want to use e.g. reasons for visiting gym
9 Enter Values This procedure generally applies to variables that are not interval or scale Click on the Values column relating to the variable Click on the button with the 3 dots on it The Value Label dialog box will appear Click on the box next to value, enter 1 Click on the box next to Label, enter Male Click on Add Repeat for each value (response option) Click OK when complete

10 Value Label Dialog Box Enter Value and Label Click Add to save entry and add another Click when complete
11 Enter Measures Are there more than two categories? YES NO Dichotomous Can the categories be rank ordered? YES NO Nominal Are the distances between categories equal? YES NO Ordinal Interval/Scale
12 Gym Questionnaire Measures Question Type of Measure Number 1 Dichotomous/Nominal 2 Interval/Scale 3 Nominal 4 Ordinal 5 Ordinal 6 Ordinal 7 Nominal 8 Dichotomous/Nominal 9 Nominal 10 Interval/Scale 11 Interval/Scale 12 Interval/Scale

13 For each variable use drop down list and choose appropriate type Repeat for all variables

14 Step 2- Input Data Click on the Data View tab to the bottom Click on the Value label button to switch between Label and Value Enter the responses for each question Each row represents a filled out questionnaire
15 Step 3- Analyze Data Frequency Tables- provides the number of people and the percentage belonging to each categories for the variable in question Can be used for all types of variables An example can be derived for Q3- Reason for visiting the Gym
16 Click on Analyze Menu Click on Descriptive Statistics Click on Frequencies The Frequencies Dialog box opens Choose variable from list on left hand, click on the arrow to send into Variable box Click OK Frequency Table will be displayed on Output Viewer


17 1. Choose Variable from list 2. Click on arrow to send to variable box 3. Click OK to complete
18 Measures of Central Tendency- Used to calculate Mean, Median, Mode, Standard Deviation An example, Q2- Age
19 Click on Analyze Menu Click on Descriptive Statistics Click on Explore The Explore Dialog box opens Choose variable from list on left hand, click on the arrow to send into Dependent List Click OK

20 1. Choose Variable 2. Click on Arrow to send to Dependent List 3. Click OK
21 Diagrams- Used to display quantitative data Easy to interpret and understand Bar chart and Pie charts use Ordinal and Nominal variables An Example can be a Bar Chart to display Q6- Frequency of Visit
22 Click on Graphs Menu Click on Chart Builder Make sure Gallery tab is selected Click on Bar from list on left hand side Choose format you want and drag and drop it onto the area above Choose variable from list on left side- Visit Frequency Drag and drop onto X axis Click OK

23 1. Make sure Gallery tab is selected 2. Select Bar 3. Select format drag and drop

24 4. Choose Variable- Visit Frequency 5. Drag and Drop onto X Axis 6. Click OK
25 Another Example could be a Pie Chart for Q7- Accompaniment From List Click on Pie/Polar Choose format you want and drag and drop it onto the area above Choose variable from list on left side- Accompaniment Drag and drop onto Slice By Click OK

26 3. Choose Variable and drag and drop onto Slice by 2. Select format and drag and drop 1. Choose Pie/Polar
27 Same steps apply to any other chart e.g. Histogram Choose Histogram Select format, drag and drop onto area Choose Variable, drag and drop onto X Axis
28 Cross Tabulation- Allows two variables to be simultaneously analyzed so that relationships can be examined Normal for Cross tab tables to include percentages The percentages can be shown either by row or column An example, gender and reasons for visiting, to determine if there is any association. Why do Men visit or Why do Women visit?
29 Click on Analyze Menu Click on Descriptive Statistics Click on Crosstabs Choose Variable for Row from list on left side, use arrow to select Choose Variable for Column, use arrow to select Click on Cell button on right In the Percentage section Check the boxes for Row or Column or both

30 1. Choose Variable for Row 2. Click on Arrow to select 3. Choose Variable for Column 4. Click on Arrow to select 5. Click on Cells Button

31 6. Check appropriate option Click on Continue Click OK to generate cross tabulation
32 Pearson s r- Is a method for examining relationships between interval/scale variables The coefficient lie between -1 (perfect negative relationship) and 1 (perfect positive relationship), where 0 (no relationship) An example, we can find out if there is any relationship between Age and Cardio minutes Age and Weight minutes
33 Click on Analyze Menu Click on Correlate Click on Bivariate The Bivariate dialog box opens Select variables (age, Minutes on Cardio, Minutes on Weight) from list, use arrow to send to variables box Ensure Pearson s is checked in the Correlation Coefficient box Click OK

34 1. Select variables from list 2. Use arrow to send to Variable box 3. Make sure Pearson is checked 4. Click OK
35 Coefficient of Determination Express how much of the variation in one variable is due to the other variable COD = r 2 COD as a percentage = r 2 X 100 Using the example of Min on Cardio and Age COD % = 1.2% This means that just 1.2% of the variation of Mins on Cardio is accounted for by Age
36 Spearman s- Is designed for use of pairs of ordinal variables But also used when one variable is ordinal and the other interval/scale Same as Pearson s, i.e. coefficient lie between -1 and 1 An Example, to find out if there is any relationship between visit frequency and Minutes on other activities
37 Click on Analyze Menu Click on Correlate Click on Bivariate The Bivariate dialog box opens Select variables (Visit frequency, Minutes on other activities) from list, use arrow to send to variables box Ensure Spearman is checked in the Correlation Coefficient box Click OK
38 1. Select variables 2. Use arrow to send to Variable box 3. Ensure Spearman is checked 4. Click OK
39 Scatterplots- Used to plot the relationship between two variables One variable on the X axis and the other on the Y Axis Best fit line is added to show correlation An example, for Minutes on cardio and Age
40 Click on Graphs Menu Click on Chart Builder Make sure Gallery tab is selected Click on Scatter/Dot from list on left hand side Choose format you want and drag and drop it onto the area above Choose variable from list on left side- Age, Drag and drop onto X axis Choose variable from list on left side- Minutes on Cardio, Drag and drop onto Y axis Click OK

41 3. Select variable, drag to X Axis 4. Select variable, drag to Y Axis 2. Select the format, drag and drop to area 1. Select Scatter/Dot 5. Click OK
42 Hypothesis Testing A hypothesis is a claim or statement about a property of a population A hypothesis test is a standard procedure for testing a claim Usually have a Null Hypothesis: H 0 Alternative Hypothesis: H 1 General Rule: If absolute value of the Test Statistic exceeds the Critical Values then Reject H 0 Otherwise, fail to reject H 0
43 Hypothesis Testing for a Correlation Use a Student t Distribution Test Statistic = (r- µ r ) / S r r is Pearson s correlation coefficient µ r is the claimed value of the mean S r is the claimed value of the Standard Deviation H 0 : p=0 (there is no linear correlation) H 1 : p 0 (there is a linear correlation) So, If H 0 is Rejected, conclude that there is a significant relationship between the two variables if you fail to Reject H 0, then there is not sufficient evidence to conclude that there is a relationship
44 Click on Analyze Menu Click on Compare Means Click on Paired-Samples T Test Choose variable from list on left side- Age, use arrow to send to variables box Choose variable from list on left side- Minutes on Cardio, use arrow to send to variables box Click OK

45 1. Choose first Variable- Age 2. Choose second Variable- Mins on Cardio 3. Click on OK
46 Using a Significance level of 5%, twotailed, The Critical Value = t = Since t > Critical Value we Reject H 0 conclude that there is a significant correlation between Age and Min on Cardio
47 More functions of SPSS and Analyzing Qualitative Data
48 Multivariate Analysis This entails simultaneous analysis of three or more variables There are three contexts: Could the relationship be Spurious? Could there be an intervening variable? Could a third variable moderate the relationship?
49 Could the relationship be Spurious Spurious relationship exists when there appears to be a relationship between two variables, but the relationship is not real That is, it is being produced because each variable is itself related to a third variable For example, lets say we found a relationship between Visit Frequency and minutes on cardio equipment We might ask could the relationship be an artefact of age
50 The older one is, the more likely you are to visit the gym, and The older you get the more likely you are to spend more time on cardio equipment Age Visit Frequency Minutes on Cardio
51 Could there be an intervening variable? Let us say that we do not find the relationship to be spurious We might ask why there is a relationship between two variables? In other words is there a more complex relationship between the two variables? For example What if we explore the relationship between Visit Frequency and Total Fitness? We might find that there is a relationship
52 That is, the more you visit the gym the more likely you would be fit But, we might want to further explore this relationship We could speculate that the older you get visit frequency will be higher is associated, which in turn leads to enhanced fitness Visit Frequency Age Total Fitness
53 Could a third variable moderate the relationship? We might ask- does the relationship between two variables hold for men but not for women? If it does then the relationship is said to be moderated by Gender For example Whether the relationship between Age and whether visitors have other sources of exercise is moderated by gender
54 This would imply, if we find a pattern relating to age to other sources of exercise, that pattern will vary by gender Table 1
55 Table 2
56 Table 1 Suggest that the age group are less likely to have other sources of exercise than the 30 and under and 41 and over age groups Table 2 which breaks the relationship down by gender, suggests that the pattern for males and females is somewhat different Among males the pattern is very pronounced But for females the likelihood of having other sources of exercise decline with gender
57 Using SPSS to generate a Cross Tabulation with three variables Click on Analyze Menu Click on Descriptive Statistics Click on Crosstabs Choose other sources of exercise add to rows use arrow Choose agegp3 (recoded variable) add to columns use arrow Choose gender add to box below Layer 1 of 1 use arrow
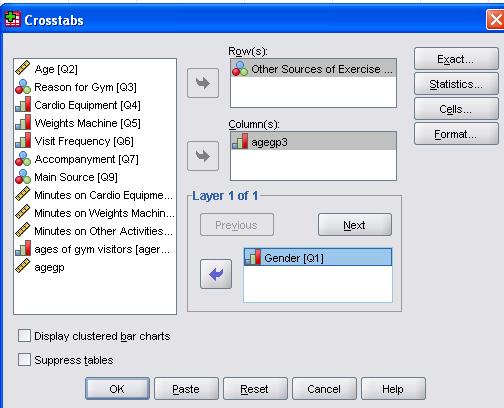
58

59 Click on cells button Check the observed option in the Count box Check column option in the Percentage box Click continue crosstab:cell display will close Then click OK in the
60 Recoding Variables Using Age as the example Click on Transform Menu Click on Recode into Different Variables Choose age from variable list Use arrow to send to Input Variable Type the agegp in the Output Variable Name Click on change button

61 Original name of variable Recoded (new) name of variable Change Button Old and New Values Button
62 Click on Old and New Values button Choose the radio buttons next to System or user missing under old Value and System missing under new value Click Add

63 Next, under Old Value choose the radio button by Range, LOWEST through value, enter 20 in the box by value Under New Value type 1in the value box Click Add
64 Next, under Old Value Choose the radio button Range, type 21 in first box and 30 in box after through In New value section type 2 as the value Click Add Repeat for 31 to 40 value 3 and 41 to 50 value 4

65 Lastly, under old value choose radio button Range, value through HIGHEST, type 51 in the box Under New value type 5 in the value box Click Add
66 Computing a New Variable We can calculate the Total Minutes spent in the gym by summing three variables: minutes on cardio, minutes on weights and minutes on other Click on Transform Menu Click on Compute Variable Under target variable type TotalMinutes (no space)
67 Choose first variable Minutes on Cardio from list use arrow to send to numerical expression box. Click on + in calculator Choose second variable Minutes on Weights from list use arrow to send to numerical expression box. Click on + in calculator Choose third variable Minutes on Other from list use arrow to send to numerical expression box. Click on + in calculator Click OK

68 Type new Variable name Numerical expression Choose variables
69 Chi Square Test The Chi-Squared test is applied to contingency tables (crosstab) It allows us to establish how confident we can be that there is a relationship between two variables in the population The Chi-Squared value means nothing on its own Only meaningful when interpreted in relation to its associated level of statistical significance e.g. 5%. This means there is a 5 in 100 chance that there might be a relationship when there is none in the population
70 We also have to setup a Null Hypothesis. This stipulates that two variables are not related in the population Lastly, we have determine the Critical Value, which is determined by the degrees of freedom and significance level Degrees of Freedom= (no of columns- 1)(no of rows-1) Need to use Chi-Squared Distribution tables to look up Critical Value
71 Example Suppose we wanted to confirm or prove that is no relationship between gender and Reason for Gym Significance level 5% (0.05) meaning 95% confidence level that there is no relationship Null Hypothesis H o : there is no relationship Degrees of freedom = (2-1)(4 1)=3 Critical Value = From SPSS Chi-Squared value=
72 Chi-Squared Value Pearson Coefficient confirming that there is a relationship. Negative in nature
73 So we can reject H o : there is no relationship since the Chi-Squared value is greater than the Critical Value And conclude that there is a relationship between Gender and Reason for gym at the 5% significance level Also Pearson s Correlation confirms that there is a relationship
1. Basic Steps for Data Analysis Data Editor. 2.4.To create a new SPSS file
 1 SPSS Guide 2009 Content 1. Basic Steps for Data Analysis. 3 2. Data Editor. 2.4.To create a new SPSS file 3 4 3. Data Analysis/ Frequencies. 5 4. Recoding the variable into classes.. 5 5. Data Analysis/
How to Use a Statistical Package
 APPENDIX D How to Use a Statistical Package Candace M. Evans, Lisa M. Gilman, Jeffrey Xavier, Joan Saxton Weber Computers and statistical software such as the Statistical Package for the Social Sciences
How to Use a Statistical Package
 APPENDIX F How to Use a Statistical Package With the assistance of Lisa M. Gilman and Jeffrey Xavier and with contributions by Joan Saxton Weber Computers and statistical software such as the Statistical
An introduction to SPSS
 An introduction to SPSS To open the SPSS software using U of Iowa Virtual Desktop... Go to https://virtualdesktop.uiowa.edu and choose SPSS 24. Contents NOTE: Save data files in a drive that is accessible
Brief Guide on Using SPSS 10.0
 Brief Guide on Using SPSS 10.0 (Use student data, 22 cases, studentp.dat in Dr. Chang s Data Directory Page) (Page address: http://www.cis.ysu.edu/~chang/stat/) I. Processing File and Data To open a new
Computers and statistical software such as the Statistical Package for the Social Sciences (SPSS) make complex statistical
 make complex statistical") Appendix C How to Use a Statistical Package With The Assistance of Lisa M. Gilman and with Contributions By Joan Saxton Weber Computers and statistical software such as the Statistical Package for the
Appendix C How to Use a Statistical Package With The Assistance of Lisa M. Gilman and with Contributions By Joan Saxton Weber Computers and statistical software such as the Statistical Package for the
How to Use a Statistical Package
 E App-Bachman-45191.qxd 1/31/2007 3:32 PM Page E-1 A P P E N D I X E How to Use a Statistical Package WITH THE ASSISTANCE OF LISA M. GILMAN AND WITH CONTRIBUTIONS BY JOAN SAXTON WEBER Computers and statistical
Mean Tests & X 2 Parametric vs Nonparametric Errors Selection of a Statistical Test SW242
 Mean Tests & X 2 Parametric vs Nonparametric Errors Selection of a Statistical Test SW242 Creation & Description of a Data Set * 4 Levels of Measurement * Nominal, ordinal, interval, ratio * Variable Types
User Services Spring 2008 OBJECTIVES Introduction Getting Help Instructors
 User Services Spring 2008 OBJECTIVES Use the Data Editor of SPSS 15.0 to to import data. Recode existing variables and compute new variables Use SPSS utilities and options Conduct basic statistical tests.
Applied Regression Modeling: A Business Approach
 i Applied Regression Modeling: A Business Approach Computer software help: SPSS SPSS (originally Statistical Package for the Social Sciences ) is a commercial statistical software package with an easy-to-use
2016 SPSS Workshop UBC Research Commons
 " 2016 SPSS Workshop #2 @ UBC Research Commons Part 1: Data Management The Select Cases Command Menu: Data Select Cases 1. Option 1- randomly selecting cases Select Random sample of cases, click on Sample,
SPSS for Survey Analysis
 STC: SPSS for Survey Analysis 1 SPSS for Survey Analysis STC: SPSS for Survey Analysis 2 SPSS for Surveys: Contents Background Information... 4 Opening and creating new documents... 5 Starting SPSS...
SPSS. (Statistical Packages for the Social Sciences)
") Inger Persson SPSS (Statistical Packages for the Social Sciences) SHORT INSTRUCTIONS This presentation contains only relatively short instructions on how to perform basic statistical calculations in SPSS.
Inger Persson SPSS (Statistical Packages for the Social Sciences) SHORT INSTRUCTIONS This presentation contains only relatively short instructions on how to perform basic statistical calculations in SPSS.
Frequency Distributions and Descriptive Statistics in SPS
 230 Combs Building 859.622.3050 studentcomputing.eku.edu studentcomputing@eku.edu Frequency Distributions and Descriptive Statistics in SPSS In this tutorial, we re going to work through a sample problem
ANSWERS -- Prep for Psyc350 Laboratory Final Statistics Part Prep a
 ANSWERS -- Prep for Psyc350 Laboratory Final Statistics Part Prep a Put the following data into an spss data set: Be sure to include variable and value labels and missing value specifications for all variables
IBMSPSSSTATL1P: IBM SPSS Statistics Level 1
 SPSS IBMSPSSSTATL1P IBMSPSSSTATL1P: IBM SPSS Statistics Level 1 Version: 4.4 QUESTION NO: 1 Which statement concerning IBM SPSS Statistics application windows is correct? A. At least one Data Editor window
Descriptive Statistics, Standard Deviation and Standard Error
 AP Biology Calculations: Descriptive Statistics, Standard Deviation and Standard Error SBI4UP The Scientific Method & Experimental Design Scientific method is used to explore observations and answer questions.
Excel 2010 with XLSTAT
 Excel 2010 with XLSTAT J E N N I F E R LE W I S PR I E S T L E Y, PH.D. Introduction to Excel 2010 with XLSTAT The layout for Excel 2010 is slightly different from the layout for Excel 2007. However, with
Statistical Package for the Social Sciences INTRODUCTION TO SPSS SPSS for Windows Version 16.0: Its first version in 1968 In 1975.
 Statistical Package for the Social Sciences INTRODUCTION TO SPSS SPSS for Windows Version 16.0: Its first version in 1968 In 1975. SPSS Statistics were designed INTRODUCTION TO SPSS Objective About the
Quick Start Guide Jacob Stolk PhD Simone Stolk MPH November 2018
 Quick Start Guide Jacob Stolk PhD Simone Stolk MPH November 2018 Contents Introduction... 1 Start DIONE... 2 Load Data... 3 Missing Values... 5 Explore Data... 6 One Variable... 6 Two Variables... 7 All
SPSS QM II. SPSS Manual Quantitative methods II (7.5hp) SHORT INSTRUCTIONS BE CAREFUL
 SHORT INSTRUCTIONS BE CAREFUL") SPSS QM II SHORT INSTRUCTIONS This presentation contains only relatively short instructions on how to perform some statistical analyses in SPSS. Details around a certain function/analysis method not covered
SPSS QM II SHORT INSTRUCTIONS This presentation contains only relatively short instructions on how to perform some statistical analyses in SPSS. Details around a certain function/analysis method not covered
Selected Introductory Statistical and Data Manipulation Procedures. Gordon & Johnson 2002 Minitab version 13.
 Minitab@Oneonta.Manual: Selected Introductory Statistical and Data Manipulation Procedures Gordon & Johnson 2002 Minitab version 13.0 Minitab@Oneonta.Manual: Selected Introductory Statistical and Data
8. MINITAB COMMANDS WEEK-BY-WEEK
 8. MINITAB COMMANDS WEEK-BY-WEEK In this section of the Study Guide, we give brief information about the Minitab commands that are needed to apply the statistical methods in each week s study. They are
Select Cases. Select Cases GRAPHS. The Select Cases command excludes from further. selection criteria. Select Use filter variables
 Select Cases GRAPHS The Select Cases command excludes from further analysis all those cases that do not meet specified selection criteria. Select Cases For a subset of the datafile, use Select Cases. In
Opening a Data File in SPSS. Defining Variables in SPSS
 Opening a Data File in SPSS To open an existing SPSS file: 1. Click File Open Data. Go to the appropriate directory and find the name of the appropriate file. SPSS defaults to opening SPSS data files with
Statistical Analysis Using SPSS for Windows Getting Started (Ver. 2018/10/30) The numbers of figures in the SPSS_screenshot.pptx are shown in red.
 The numbers of figures in the SPSS_screenshot.pptx are shown in red.") Statistical Analysis Using SPSS for Windows Getting Started (Ver. 2018/10/30) The numbers of figures in the SPSS_screenshot.pptx are shown in red. 1. How to display English messages from IBM SPSS Statistics
Statistical Analysis Using SPSS for Windows Getting Started (Ver. 2018/10/30) The numbers of figures in the SPSS_screenshot.pptx are shown in red. 1. How to display English messages from IBM SPSS Statistics
Product Catalog. AcaStat. Software
 Product Catalog AcaStat Software AcaStat AcaStat is an inexpensive and easy-to-use data analysis tool. Easily create data files or import data from spreadsheets or delimited text files. Run crosstabulations,
Course Code: SPSS19 Introduction to IBM SPSS Statistics
 Centre for Learning and Academic Development (CLAD) Technology Skills Development Team Course Code: SPSS19 Introduction to IBM SPSS Statistics www.intranet.birmingham.ac.uk/itskills An Introduction to
Basic concepts and terms
 CHAPTER ONE Basic concepts and terms I. Key concepts Test usefulness Reliability Construct validity Authenticity Interactiveness Impact Practicality Assessment Measurement Test Evaluation Grading/marking
Applied Regression Modeling: A Business Approach
 i Applied Regression Modeling: A Business Approach Computer software help: SAS SAS (originally Statistical Analysis Software ) is a commercial statistical software package based on a powerful programming
JMP 10 Student Edition Quick Guide
 JMP 10 Student Edition Quick Guide Instructions presume an open data table, default preference settings and appropriately typed, user-specified variables of interest. RMC = Click Right Mouse Button Graphing
Basic Medical Statistics Course
 Basic Medical Statistics Course S0 SPSS Intro November 2013 Wilma Heemsbergen w.heemsbergen@nki.nl 1 13.00 ~ 15.30 Database (20 min) SPSS (40 min) Short break Exercise (60 min) This Afternoon During the
Using Large Data Sets Workbook Version A (MEI)
") Using Large Data Sets Workbook Version A (MEI) 1 Index Key Skills Page 3 Becoming familiar with the dataset Page 3 Sorting and filtering the dataset Page 4 Producing a table of summary statistics with
Using Large Data Sets Workbook Version A (MEI) 1 Index Key Skills Page 3 Becoming familiar with the dataset Page 3 Sorting and filtering the dataset Page 4 Producing a table of summary statistics with
SPSS TRAINING SPSS VIEWS
 SPSS TRAINING SPSS VIEWS Dataset Data file Data View o Full data set, structured same as excel (variable = column name, row = record) Variable View o Provides details for each variable (column in Data
Bluman & Mayer, Elementary Statistics, A Step by Step Approach, Canadian Edition
 Bluman & Mayer, Elementary Statistics, A Step by Step Approach, Canadian Edition Online Learning Centre Technology Step-by-Step - Minitab Minitab is a statistical software application originally created
Using SPSS with The Fundamentals of Political Science Research
 Using SPSS with The Fundamentals of Political Science Research Paul M. Kellstedt and Guy D. Whitten Department of Political Science Texas A&M University c Paul M. Kellstedt and Guy D. Whitten 2009 Contents
4. Descriptive Statistics: Measures of Variability and Central Tendency
 4. Descriptive Statistics: Measures of Variability and Central Tendency Objectives Calculate descriptive for continuous and categorical data Edit output tables Although measures of central tendency and
Introduction. About this Document. What is SPSS. ohow to get SPSS. oopening Data
 Introduction About this Document This manual was written by members of the Statistical Consulting Program as an introduction to SPSS 12.0. It is designed to assist new users in familiarizing themselves
Quantitative - One Population
 Quantitative - One Population The Quantitative One Population VISA procedures allow the user to perform descriptive and inferential procedures for problems involving one population with quantitative (interval)
AcaStat User Manual. Version 8.3 for Mac and Windows. Copyright 2014, AcaStat Software. All rights Reserved.
 AcaStat User Manual Version 8.3 for Mac and Windows Copyright 2014, AcaStat Software. All rights Reserved. http://www.acastat.com Table of Contents INTRODUCTION... 5 GETTING HELP... 5 INSTALLATION... 5
LAB 1 INSTRUCTIONS DESCRIBING AND DISPLAYING DATA
 LAB 1 INSTRUCTIONS DESCRIBING AND DISPLAYING DATA This lab will assist you in learning how to summarize and display categorical and quantitative data in StatCrunch. In particular, you will learn how to
Data analysis using Microsoft Excel
 Introduction to Statistics Statistics may be defined as the science of collection, organization presentation analysis and interpretation of numerical data from the logical analysis. 1.Collection of Data
SPSS. Faiez Mussa. 2 nd class
 SPSS Faiez Mussa 2 nd class Objectives To describe opening and closing SPSS To introduce the look and structure of SPSS To introduce the data entry windows: Data View and Variable View To outline the components
Table Of Contents. Table Of Contents
 Statistics Table Of Contents Table Of Contents Basic Statistics... 7 Basic Statistics Overview... 7 Descriptive Statistics Available for Display or Storage... 8 Display Descriptive Statistics... 9 Store
Your Name: Section: INTRODUCTION TO STATISTICAL REASONING Computer Lab #4 Scatterplots and Regression
 Your Name: Section: 36-201 INTRODUCTION TO STATISTICAL REASONING Computer Lab #4 Scatterplots and Regression Objectives: 1. To learn how to interpret scatterplots. Specifically you will investigate, using
Data Mining. SPSS Clementine k-means Algorithm. Spring 2010 Instructor: Dr. Masoud Yaghini. Clementine
 Data Mining SPSS 12.0 6. k-means Algorithm Spring 2010 Instructor: Dr. Masoud Yaghini Outline K-Means Algorithm in K-Means Node References K-Means Algorithm in Overview The k-means method is a clustering
Math 227 EXCEL / MEGASTAT Guide
 Math 227 EXCEL / MEGASTAT Guide Introduction Introduction: Ch2: Frequency Distributions and Graphs Construct Frequency Distributions and various types of graphs: Histograms, Polygons, Pie Charts, Stem-and-Leaf
WELCOME! Lecture 3 Thommy Perlinger
 Quantitative Methods II WELCOME! Lecture 3 Thommy Perlinger Program Lecture 3 Cleaning and transforming data Graphical examination of the data Missing Values Graphical examination of the data It is important
IQR = number. summary: largest. = 2. Upper half: Q3 =
 Step by step box plot Height in centimeters of players on the 003 Women s Worldd Cup soccer team. 157 1611 163 163 164 165 165 165 168 168 168 170 170 170 171 173 173 175 180 180 Determine the 5 number
Introduction (SPSS) Opening SPSS Start All Programs SPSS Inc SPSS 21. SPSS Menus
 Opening SPSS Start All Programs SPSS Inc SPSS 21. SPSS Menus") Introduction (SPSS) SPSS is the acronym of Statistical Package for the Social Sciences. SPSS is one of the most popular statistical packages which can perform highly complex data manipulation and analysis
Introduction (SPSS) SPSS is the acronym of Statistical Package for the Social Sciences. SPSS is one of the most popular statistical packages which can perform highly complex data manipulation and analysis
SAS Visual Analytics 8.2: Working with Report Content
 SAS Visual Analytics 8.2: Working with Report Content About Objects After selecting your data source and data items, add one or more objects to display the results. SAS Visual Analytics provides objects
Further Maths Notes. Common Mistakes. Read the bold words in the exam! Always check data entry. Write equations in terms of variables
 Further Maths Notes Common Mistakes Read the bold words in the exam! Always check data entry Remember to interpret data with the multipliers specified (e.g. in thousands) Write equations in terms of variables
Subject. Creating a diagram. Dataset. Importing the data file. Descriptive statistics with TANAGRA.
 Subject Descriptive statistics with TANAGRA. The aim of descriptive statistics is to describe the main features of a collection of data in quantitative terms 1. The visualization of the whole data table
Chapter One: Getting Started With IBM SPSS for Windows
 Chapter One: Getting Started With IBM SPSS for Windows Using Windows The Windows start-up screen should look something like Figure 1-1. Several standard desktop icons will always appear on start up. Note
Psychology Press is an imprint of the Taylor & Francis Group, an informa business
 First published 2012 by Psychology Press 27 Church Road, Hove, East Sussex BN3 2FA Simultaneously published in the USA and Canada by Psychology Press, 711 Third Avenue, New York NY 10017 Psychology Press
QUESTION PORTOFOLIO FOR THE GRID TEST MVE
 1*Which of the following rules is not recommended when writing of a text in Microsoft Word: 0. Typing a space after a common punctuation mark; 1. Typing a space before a common punctuation mark; 2. Typing
IAT 355 Visual Analytics. Data and Statistical Models. Lyn Bartram
 IAT 355 Visual Analytics Data and Statistical Models Lyn Bartram Exploring data Example: US Census People # of people in group Year # 1850 2000 (every decade) Age # 0 90+ Sex (Gender) # Male, female Marital
Acquisition Description Exploration Examination Understanding what data is collected. Characterizing properties of data.
 Summary Statistics Acquisition Description Exploration Examination what data is collected Characterizing properties of data. Exploring the data distribution(s). Identifying data quality problems. Selecting
Introduction to Minitab 1
 Introduction to Minitab 1 We begin by first starting Minitab. You may choose to either 1. click on the Minitab icon in the corner of your screen 2. go to the lower left and hit Start, then from All Programs,
Data can be in the form of numbers, words, measurements, observations or even just descriptions of things.
 + What is Data? Data is a collection of facts. Data can be in the form of numbers, words, measurements, observations or even just descriptions of things. In most cases, data needs to be interpreted and
Table of Contents (As covered from textbook)
") Table of Contents (As covered from textbook) Ch 1 Data and Decisions Ch 2 Displaying and Describing Categorical Data Ch 3 Displaying and Describing Quantitative Data Ch 4 Correlation and Linear Regression
Table of Contents (As covered from textbook) Ch 1 Data and Decisions Ch 2 Displaying and Describing Categorical Data Ch 3 Displaying and Describing Quantitative Data Ch 4 Correlation and Linear Regression
Chapter 5: The beast of bias
 Chapter 5: The beast of bias Self-test answers SELF-TEST Compute the mean and sum of squared error for the new data set. First we need to compute the mean: + 3 + + 3 + 2 5 9 5 3. Then the sum of squared
Statistics with a Hemacytometer
 Statistics with a Hemacytometer Overview This exercise incorporates several different statistical analyses. Data gathered from cell counts with a hemacytometer is used to explore frequency distributions
Frequency Tables. Chapter 500. Introduction. Frequency Tables. Types of Categorical Variables. Data Structure. Missing Values
 Chapter 500 Introduction This procedure produces tables of frequency counts and percentages for categorical and continuous variables. This procedure serves as a summary reporting tool and is often used
Chapter 2 Describing, Exploring, and Comparing Data
 Slide 1 Chapter 2 Describing, Exploring, and Comparing Data Slide 2 2-1 Overview 2-2 Frequency Distributions 2-3 Visualizing Data 2-4 Measures of Center 2-5 Measures of Variation 2-6 Measures of Relative
- 1 - Fig. A5.1 Missing value analysis dialog box
 WEB APPENDIX Sarstedt, M. & Mooi, E. (2019). A concise guide to market research. The process, data, and methods using SPSS (3 rd ed.). Heidelberg: Springer. Missing Value Analysis and Multiple Imputation
Data Mining. ❷Chapter 2 Basic Statistics. Asso.Prof.Dr. Xiao-dong Zhu. Business School, University of Shanghai for Science & Technology
 ❷Chapter 2 Basic Statistics Business School, University of Shanghai for Science & Technology 2016-2017 2nd Semester, Spring2017 Contents of chapter 1 1 recording data using computers 2 3 4 5 6 some famous
1.1 Purpose and Intent of Graphs «
 1 Introduction Graphical Presentation of Data 1.1 Purpose and Intent of Graphs «The principal purpose of a graph is to answer questions about data. Answers to the questions may then provide direction for
Multivariate Normal Random Numbers
 Multivariate Normal Random Numbers Revised: 10/11/2017 Summary... 1 Data Input... 3 Analysis Options... 4 Analysis Summary... 5 Matrix Plot... 6 Save Results... 8 Calculations... 9 Summary This procedure
Data Analysis using SPSS
 Data Analysis using SPSS 2073/03/05 03/07 Bijay Lal Pradhan, Ph.D. Ground Rule Mobile Penalty Participation Involvement Introduction to SPSS Day 1 2073/03/05 Session I Bijay Lal Pradhan, Ph.D. Object of
IENG484 Quality Engineering Lab 1 RESEARCH ASSISTANT SHADI BOLOUKIFAR
 IENG484 Quality Engineering Lab 1 RESEARCH ASSISTANT SHADI BOLOUKIFAR SPSS (Statistical package for social science) Originally is acronym of Statistical Package for the Social Science but, now it stands
A Simple Guide to Using SPSS (Statistical Package for the. Introduction. Steps for Analyzing Data. Social Sciences) for Windows
 for Windows") A Simple Guide to Using SPSS (Statistical Package for the Social Sciences) for Windows Introduction ٢ Steps for Analyzing Data Enter the data Select the procedure and options Select the variables Run the
A Simple Guide to Using SPSS (Statistical Package for the Social Sciences) for Windows Introduction ٢ Steps for Analyzing Data Enter the data Select the procedure and options Select the variables Run the
Exploring and Understanding Data Using R.
 Exploring and Understanding Data Using R. Loading the data into an R data frame: variable
SPSS: AN OVERVIEW. V.K. Bhatia Indian Agricultural Statistics Research Institute, New Delhi
 SPSS: AN OVERVIEW V.K. Bhatia Indian Agricultural Statistics Research Institute, New Delhi-110012 The abbreviation SPSS stands for Statistical Package for the Social Sciences and is a comprehensive system
Minitab 17 commands Prepared by Jeffrey S. Simonoff
 Minitab 17 commands Prepared by Jeffrey S. Simonoff Data entry and manipulation To enter data by hand, click on the Worksheet window, and enter the values in as you would in any spreadsheet. To then save
Statistical Methods. Instructor: Lingsong Zhang. Any questions, ask me during the office hour, or me, I will answer promptly.
 Statistical Methods Instructor: Lingsong Zhang 1 Issues before Class Statistical Methods Lingsong Zhang Office: Math 544 Email: lingsong@purdue.edu Phone: 765-494-7913 Office Hour: Monday 1:00 pm - 2:00
Tabular & Graphical Presentation of data
 Tabular & Graphical Presentation of data bjectives: To know how to make frequency distributions and its importance To know different terminology in frequency distribution table To learn different graphs/diagrams
MHPE 494: Data Analysis. Welcome! The Analytic Process
 MHPE 494: Data Analysis Alan Schwartz, PhD Department of Medical Education Memoona Hasnain,, MD, PhD, MHPE Department of Family Medicine College of Medicine University of Illinois at Chicago Welcome! Your
INTRODUCTORY SPSS. Dr Feroz Mahomed Swalaha x2689
 INTRODUCTORY SPSS Dr Feroz Mahomed Swalaha fswalaha@dut.ac.za x2689 1 Statistics (the systematic collection and display of numerical data) is the most abused area of numeracy. 97% of statistics are made
Multivariate Capability Analysis
 Multivariate Capability Analysis Summary... 1 Data Input... 3 Analysis Summary... 4 Capability Plot... 5 Capability Indices... 6 Capability Ellipse... 7 Correlation Matrix... 8 Tests for Normality... 8
22/10/16. Data Coding in SPSS. Data Coding in SPSS. Data Coding in SPSS. Data Coding in SPSS
 DATA CODING IN SPSS STAFF TRAINING WORKSHOP March 28, 2017 Delivered by Dr. Director of Applied Economics Unit African Heritage Institution Enugu Nigeria To code data in SPSS, Lunch the SPSS The Data Editor
STATS PAD USER MANUAL
 STATS PAD USER MANUAL For Version 2.0 Manual Version 2.0 1 Table of Contents Basic Navigation! 3 Settings! 7 Entering Data! 7 Sharing Data! 8 Managing Files! 10 Running Tests! 11 Interpreting Output! 11
StatCalc User Manual. Version 9 for Mac and Windows. Copyright 2018, AcaStat Software. All rights Reserved.
 StatCalc User Manual Version 9 for Mac and Windows Copyright 2018, AcaStat Software. All rights Reserved. http://www.acastat.com Table of Contents Introduction... 4 Getting Help... 4 Uninstalling StatCalc...
MINITAB 17 BASICS REFERENCE GUIDE
 MINITAB 17 BASICS REFERENCE GUIDE Dr. Nancy Pfenning September 2013 After starting MINITAB, you'll see a Session window above and a worksheet below. The Session window displays non-graphical output such
Statistical Analysis of Metabolomics Data. Xiuxia Du Department of Bioinformatics & Genomics University of North Carolina at Charlotte
 Statistical Analysis of Metabolomics Data Xiuxia Du Department of Bioinformatics & Genomics University of North Carolina at Charlotte Outline Introduction Data pre-treatment 1. Normalization 2. Centering,
THE BASICS OF USING SPSS OCTOBER 22, 2008
 Faculty Research Center College of Education http://frc.coe.nau.edu/ OCTOBER 22, 2008 PRESENTED BY: Robert A. Horn, Ph.D. Assistant Professor, Educational Psychology 928-523-0545 Robert.Horn@nau.edu PRESENTATION
Chapter Two: Descriptive Methods 1/50
 Chapter Two: Descriptive Methods 1/50 2.1 Introduction 2/50 2.1 Introduction We previously said that descriptive statistics is made up of various techniques used to summarize the information contained
Bar Charts and Frequency Distributions
 Bar Charts and Frequency Distributions Use to display the distribution of categorical (nominal or ordinal) variables. For the continuous (numeric) variables, see the page Histograms, Descriptive Stats
Introduction to CS graphs and plots in Excel Jacek Wiślicki, Laurent Babout,
 MS Excel 2010 offers a large set of graphs and plots for data visualization. For those who are familiar with older version of Excel, the layout is completely different. The following exercises demonstrate
Chapter 2. Descriptive Statistics: Organizing, Displaying and Summarizing Data
 Chapter 2 Descriptive Statistics: Organizing, Displaying and Summarizing Data Objectives Student should be able to Organize data Tabulate data into frequency/relative frequency tables Display data graphically
Graphical Presentation for Statistical Data (Relevant to AAT Examination Paper 4: Business Economics and Financial Mathematics) Introduction
 Introduction") Graphical Presentation for Statistical Data (Relevant to AAT Examination Paper 4: Business Economics and Financial Mathematics) Y O Lam, SCOPE, City University of Hong Kong Introduction The most convenient
Graphical Presentation for Statistical Data (Relevant to AAT Examination Paper 4: Business Economics and Financial Mathematics) Y O Lam, SCOPE, City University of Hong Kong Introduction The most convenient
Introduction to Nesstar
 Introduction to Nesstar Nesstar is a software system for online data analysis. It is available for use with many of the large UK surveys on the UK Data Service website. You will know whether you can use
Organizing Your Data. Jenny Holcombe, PhD UT College of Medicine Nuts & Bolts Conference August 16, 3013
 Organizing Your Data Jenny Holcombe, PhD UT College of Medicine Nuts & Bolts Conference August 16, 3013 Learning Objectives Identify Different Types of Variables Appropriately Naming Variables Constructing
SAS Visual Analytics 8.2: Getting Started with Reports
 SAS Visual Analytics 8.2: Getting Started with Reports Introduction Reporting The SAS Visual Analytics tools give you everything you need to produce and distribute clear and compelling reports. SAS Visual
TABEL DISTRIBUSI DAN HUBUNGAN LENGKUNG RAHANG DAN INDEKS FASIAL N MIN MAX MEAN SD
 TABEL DISTRIBUSI DAN HUBUNGAN LENGKUNG RAHANG DAN INDEKS FASIAL Lengkung Indeks fasial rahang Euryprosopic mesoprosopic leptoprosopic Total Sig. n % n % n % n % 0,000 Narrow 0 0 0 0 15 32,6 15 32,6 Normal
UNIT 4. Research Methods in Business
 UNIT 4 Preparing Data for Analysis:- After data are obtained through questionnaires, interviews, observation or through secondary sources, they need to be edited. The blank responses, if any have to be
After opening Stata for the first time: set scheme s1mono, permanently
 Stata 13 HELP Getting help Type help command (e.g., help regress). If you don't know the command name, type lookup topic (e.g., lookup regression). Email: tech-support@stata.com. Put your Stata serial
Math 120 Introduction to Statistics Mr. Toner s Lecture Notes 3.1 Measures of Central Tendency
 Math 1 Introduction to Statistics Mr. Toner s Lecture Notes 3.1 Measures of Central Tendency lowest value + highest value midrange The word average: is very ambiguous and can actually refer to the mean,
Introduction to SPSS Faiez Mossa 2 nd Class
 Introduction to SPSS 16.0 Faiez Mossa 2 nd Class 1 Outline Review of Concepts (stats and scales) Data entry (the workspace and labels) By hand Import Excel Running an analysis- frequency, central tendency,
The basic arrangement of numeric data is called an ARRAY. Array is the derived data from fundamental data Example :- To store marks of 50 student
 Organizing data Learning Outcome 1. make an array 2. divide the array into class intervals 3. describe the characteristics of a table 4. construct a frequency distribution table 5. constructing a composite