SPSS. Faiez Mussa. 2 nd class
|
|
|
- Dortha McKenzie
- 5 years ago
- Views:
Transcription
1 SPSS Faiez Mussa 2 nd class
2 Objectives To describe opening and closing SPSS To introduce the look and structure of SPSS To introduce the data entry windows: Data View and Variable View To outline the components necessary to define a variable To introduce the SPSS online tutorial
3 Uses for SPSS Data management Data analysis
4 Data management Defining variables Coding values Entering and editing data Creating new variables Recoding variables Selecting cases
5 Data analysis Univariate statistics Bivariate statistics Multivariate statistics
6 Opening SPSS Double click the SPSS icon on the desktop OR Start/Programs/SPSS for Windows/SPSS** The following introductory screen should appear:

7
8 The Data View window Cell edit field Cell information View tabs Status bar/boxes
9 Data View Rows represent cases or observations, that is, the objects on which data have been collected: For example, rows represent the contents of a single treatment data collection form, the information on an individual Columns represent variables or characteristics of the object of interest: For example, each column contains the answers to the questions on the treatment data collection form: age, gender, primary drug of use, etc.
10 Data Editor Data Editor comprises two screens: Data View: the previous screen Variable View: used to define the variables To move between the two: Use the View tab at the bottom of the screen OR Ctrl + T OR View/Variables from the Data View window View/Data from the Variable View window

11 Variable View
12 The data entry process Define your variables in Variable View Enter the data, the values of the variables, in Data View
13 Definition of variables 10 characteristics are used to define a variable: Name Type Width Decimals Label Values Missing Column Align Measure
14 Name Each variable must have a unique name of not more than 8 characters and starting with a letter Try to give meaningful variable names: Describing the characteristic: for example, age Linking to the questionnaire: for example, A1Q3 Keep the names consistent across files
15 Type Internal formats: Numeric String (alphanumeric) Date Output formats: Comma Dot Scientific notation Dollar Custom currency
16 Numeric Numeric variables: Numeric measurements Codes Definition of the size of the variable
17 String (alphanumeric) String variables contain words or characters; strings can include numbers but, taken here as characters, mathematical operations cannot be applied to them The maximum size of a string variable is 255 characters
18 Date The input format for date variables must be defined, such as DD/MM/YYYY, MM/DD/YYYY or MM/DD/YY Computers store dates as numbers from a base date; in SPSS, dates are stored as the number of seconds from 14 October 1582
19 Example Create two variables: ID: the unique identifier, which will be alphanumeric with a maximum of 8 characters Age: the age of the respondent measured in years, a discrete variable ranging between 10 and 100
20

21 Click here
22 Click on the String radio button and change the characters to the size of the variable, 8 in this case. Click OK.

23 Click on the Type column in the second row and define a numeric variable with a maximum size of 3 with no decimal points. Click on OK to continue.
24 Note that a number of default values have been entered into the remaining columns.
25 Labels Descriptors for the variables Maximum 255 characters Used in the output

26 Variable labels added
27 Values Value labels are descriptors of the categories of a variable Coding
28 Missing Defines missing values The values are excluded from some analysis Options: Up to 3 discrete missing values A range of missing values plus one discrete missing value

29 Click in the Missing Values column to obtain the dialogue box below. Enter the value 999 for Age.

30 Missing values added
31 Columns and Align Columns sets the amount of space reserved to display the contents of the variable in Data View; generally the default value is adequate Align sets whether the contents of the variable appear on the left, centre or right of the cell in Data View Numeric variables are right-hand justified by default and string variables left-hand justified by default; the defaults are generally adequate
32 Measure Levels of measurement: Nominal Ordinal Interval Ratio In SPSS, interval and ratio are designated together as Scale The default for string variables is Nominal The default for numeric variables is Scale

33 Returning to Data View, the first two column headings will reflect the two variables created: ID and Age. Here the first six observations have been entered.

34 Exercise: define the necessary variables and enter the following data
35 Saving the file The file must always be saved in order to save the work that has been done to date: File/Save Move to the target directory Enter a file name Save
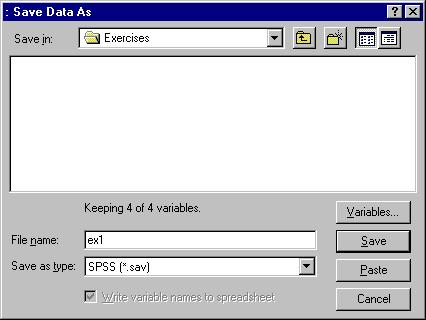
36
37 Summary Data Editor Data View Variable View File/Save Variable definition Name Type Width Decimals Label Values Missing Columns Align Measure
Opening a Data File in SPSS. Defining Variables in SPSS
 Opening a Data File in SPSS To open an existing SPSS file: 1. Click File Open Data. Go to the appropriate directory and find the name of the appropriate file. SPSS defaults to opening SPSS data files with
Basic concepts and terms
 CHAPTER ONE Basic concepts and terms I. Key concepts Test usefulness Reliability Construct validity Authenticity Interactiveness Impact Practicality Assessment Measurement Test Evaluation Grading/marking
A Simple Guide to Using SPSS (Statistical Package for the. Introduction. Steps for Analyzing Data. Social Sciences) for Windows
 for Windows") A Simple Guide to Using SPSS (Statistical Package for the Social Sciences) for Windows Introduction ٢ Steps for Analyzing Data Enter the data Select the procedure and options Select the variables Run the
A Simple Guide to Using SPSS (Statistical Package for the Social Sciences) for Windows Introduction ٢ Steps for Analyzing Data Enter the data Select the procedure and options Select the variables Run the
22/10/16. Data Coding in SPSS. Data Coding in SPSS. Data Coding in SPSS. Data Coding in SPSS
 DATA CODING IN SPSS STAFF TRAINING WORKSHOP March 28, 2017 Delivered by Dr. Director of Applied Economics Unit African Heritage Institution Enugu Nigeria To code data in SPSS, Lunch the SPSS The Data Editor
Introduction (SPSS) Opening SPSS Start All Programs SPSS Inc SPSS 21. SPSS Menus
 Opening SPSS Start All Programs SPSS Inc SPSS 21. SPSS Menus") Introduction (SPSS) SPSS is the acronym of Statistical Package for the Social Sciences. SPSS is one of the most popular statistical packages which can perform highly complex data manipulation and analysis
Introduction (SPSS) SPSS is the acronym of Statistical Package for the Social Sciences. SPSS is one of the most popular statistical packages which can perform highly complex data manipulation and analysis
Introduction to SPSS Edward A. Greenberg, PhD
 Introduction to SPSS Edward A. Greenberg, PhD ASU HEALTH SOLUTIONS DATA LAB JANUARY 7, 2013 Files for this workshop Files can be downloaded from: http://www.public.asu.edu/~eagle/spss or (with less typing):
Creating a data file and entering data
 4 Creating a data file and entering data There are a number of stages in the process of setting up a data file and analysing the data. The flow chart shown on the next page outlines the main steps that
Course Code: SPSS19 Introduction to IBM SPSS Statistics
 Centre for Learning and Academic Development (CLAD) Technology Skills Development Team Course Code: SPSS19 Introduction to IBM SPSS Statistics www.intranet.birmingham.ac.uk/itskills An Introduction to
User Services Spring 2008 OBJECTIVES Introduction Getting Help Instructors
 User Services Spring 2008 OBJECTIVES Use the Data Editor of SPSS 15.0 to to import data. Recode existing variables and compute new variables Use SPSS utilities and options Conduct basic statistical tests.
SPSS for Survey Analysis
 STC: SPSS for Survey Analysis 1 SPSS for Survey Analysis STC: SPSS for Survey Analysis 2 SPSS for Surveys: Contents Background Information... 4 Opening and creating new documents... 5 Starting SPSS...
IENG484 Quality Engineering Lab 1 RESEARCH ASSISTANT SHADI BOLOUKIFAR
 IENG484 Quality Engineering Lab 1 RESEARCH ASSISTANT SHADI BOLOUKIFAR SPSS (Statistical package for social science) Originally is acronym of Statistical Package for the Social Science but, now it stands
Tests of difference for two sample designs. Bivariate and multiple regression. Analysis of covariance and multivariate analysis of variance
 Chapter 1 Introduction 1 Chapter 2 Chapter 3 Chapter 4 Chapter 5 Chapter 6 Chapter 7 Chapter 8 Chapter 9 Chapter 10 Chapter 11 Chapter 12 Chapter 13 Data entry in SPSS Exploring data in SPSS Data handling
First steps in SPSS. Figure 1
 First steps in SPSS Statistical Package for Social Science (SPSS) is a computer program, working with the Windows operating system, and is specialized in the classification, processing and analysis of
THE BASICS OF USING SPSS OCTOBER 22, 2008
 Faculty Research Center College of Education http://frc.coe.nau.edu/ OCTOBER 22, 2008 PRESENTED BY: Robert A. Horn, Ph.D. Assistant Professor, Educational Psychology 928-523-0545 Robert.Horn@nau.edu PRESENTATION
How to Use a Statistical Package
 APPENDIX D How to Use a Statistical Package Candace M. Evans, Lisa M. Gilman, Jeffrey Xavier, Joan Saxton Weber Computers and statistical software such as the Statistical Package for the Social Sciences
Research Methods for Business and Management. Session 8a- Analyzing Quantitative Data- using SPSS 16 Andre Samuel
 Research Methods for Business and Management Session 8a- Analyzing Quantitative Data- using SPSS 16 Andre Samuel A Simple Example- Gym Purpose of Questionnaire- to determine the participants involvement
INTRODUCTORY SPSS. Dr Feroz Mahomed Swalaha x2689
 INTRODUCTORY SPSS Dr Feroz Mahomed Swalaha fswalaha@dut.ac.za x2689 1 Statistics (the systematic collection and display of numerical data) is the most abused area of numeracy. 97% of statistics are made
How to Use a Statistical Package
 APPENDIX F How to Use a Statistical Package With the assistance of Lisa M. Gilman and Jeffrey Xavier and with contributions by Joan Saxton Weber Computers and statistical software such as the Statistical
Navigating in SPSS. C h a p t e r 2 OBJECTIVES
 C h a p t e r 2 Navigating in SPSS 2.1 Introduction and Objectives As with any new software program you may use, it is important that you are able to move around the screen with the mouse and that you
Computers and statistical software such as the Statistical Package for the Social Sciences (SPSS) make complex statistical
 make complex statistical") Appendix C How to Use a Statistical Package With The Assistance of Lisa M. Gilman and with Contributions By Joan Saxton Weber Computers and statistical software such as the Statistical Package for the
Appendix C How to Use a Statistical Package With The Assistance of Lisa M. Gilman and with Contributions By Joan Saxton Weber Computers and statistical software such as the Statistical Package for the
Information System Services
 Information System Services Diocese of London, 1070 Waterloo Street, London, Ontario, N6A 3Y2 Phone:(519)433-0658, Fax:(519)433-0011, E-mail: iss@rcec.london.on.ca Excel Formatting Online Demonstration
How to Use a Statistical Package
 E App-Bachman-45191.qxd 1/31/2007 3:32 PM Page E-1 A P P E N D I X E How to Use a Statistical Package WITH THE ASSISTANCE OF LISA M. GILMAN AND WITH CONTRIBUTIONS BY JOAN SAXTON WEBER Computers and statistical
Appendix A. SPSS 11.x in 30 Minutes
 Appendix A SPSS 11.x in 30 Minutes For use with Exploring Research (5/e) Neil J. Salkind 1 Lesson 1 Starting SPSS After This Lesson, You Will Know How to start SPSS What the opening SPSS screen looks like
Mr. Kongmany Chaleunvong. GFMER - WHO - UNFPA - LAO PDR Training Course in Reproductive Health Research Vientiane, 22 October 2009
 Mr. Kongmany Chaleunvong GFMER - WHO - UNFPA - LAO PDR Training Course in Reproductive Health Research Vientiane, 22 October 2009 1 Object of the Course Introduction to SPSS The basics of managing data
Introduction to SPSS Faiez Mossa 2 nd Class
 Introduction to SPSS 16.0 Faiez Mossa 2 nd Class 1 Outline Review of Concepts (stats and scales) Data entry (the workspace and labels) By hand Import Excel Running an analysis- frequency, central tendency,
Select Cases. Select Cases GRAPHS. The Select Cases command excludes from further. selection criteria. Select Use filter variables
 Select Cases GRAPHS The Select Cases command excludes from further analysis all those cases that do not meet specified selection criteria. Select Cases For a subset of the datafile, use Select Cases. In
UNIT 4. Research Methods in Business
 UNIT 4 Preparing Data for Analysis:- After data are obtained through questionnaires, interviews, observation or through secondary sources, they need to be edited. The blank responses, if any have to be
IBM SPSS Statistics 22 Brief Guide
 IBM SPSS Statistics 22 Brief Guide Note Before using this information and the product it supports, read the information in Notices on page 77. Product Information This edition applies to version 22, release
Chapter 1. Manage the data
 1.1. Coding of survey questions Appendix A shows a questionnaire with the corresponding coding sheet. Some observations of the selected variables are shown in the following table. AGE SEX JOB INCOME EDUCATE
Quick Start Guide Jacob Stolk PhD Simone Stolk MPH November 2018
 Quick Start Guide Jacob Stolk PhD Simone Stolk MPH November 2018 Contents Introduction... 1 Start DIONE... 2 Load Data... 3 Missing Values... 5 Explore Data... 6 One Variable... 6 Two Variables... 7 All
Introduction. About this Document. What is SPSS. ohow to get SPSS. oopening Data
 Introduction About this Document This manual was written by members of the Statistical Consulting Program as an introduction to SPSS 12.0. It is designed to assist new users in familiarizing themselves
Chapter 4 Dealing with Data SPSS Tutorial
 Chapter 4 Dealing with Data SPSS Tutorial 1. Visit the student website at for this textbook at www.clowjames.net/students. 2. Download the following file: Chapter 04 Dealing with Data.sav (SPSS file) 3.
DATA DEFINITION PHASE
 Twoway Analysis of Variance Unlike previous problems in the manual, the present problem involves two independent variables (gender of juror and type of crime committed by defendant). There are two levels
WEEK NO. 12 MICROSOFT EXCEL 2007
 WEEK NO. 12 MICROSOFT EXCEL 2007 LESSONS OVERVIEW: GOODBYE CALCULATORS, HELLO SPREADSHEET! 1. The Excel Environment 2. Starting A Workbook 3. Modifying Columns, Rows, & Cells 4. Working with Worksheets
Handling Your Data in SPSS. Columns, and Labels, and Values... Oh My! The Structure of SPSS. You should think about SPSS as having three major parts.
 Handling Your Data in SPSS Columns, and Labels, and Values... Oh My! You might think that simple intuition will guide you to a useful organization of your data. If you follow that path, you might find
Depending on the computer you find yourself in front of, here s what you ll need to do to open SPSS.
 1 SPSS 13.0 for Windows Introductory Assignment Material covered: Creating a new SPSS data file, variable labels, value labels, saving data files, opening an existing SPSS data file, generating frequency
INTRODUCTION TO SPSS. Anne Schad Bergsaker 13. September 2018
 INTRODUCTION TO SPSS Anne Schad Bergsaker 13. September 2018 BEFORE WE BEGIN... LEARNING GOALS 1. Be familiar with and know how to navigate between the different windows in SPSS 2. Know how to write a
SPSS: Basics & Entering a survey In this document the basic window of SPSS is explained and how to enter a survey.
 In this document the basic window of SPSS is explained and how to enter a survey. For more information, you can visit the companion website at http://peterstatistics.com. Introduction SPSS was first released
Importing, Exporting, and ing Data
 Importing, Exporting, and Emailing Data Importing Data Before importing data into the system you should create a new database backup file and make sure no other users are entering data in the system. The
1. Basic Steps for Data Analysis Data Editor. 2.4.To create a new SPSS file
 1 SPSS Guide 2009 Content 1. Basic Steps for Data Analysis. 3 2. Data Editor. 2.4.To create a new SPSS file 3 4 3. Data Analysis/ Frequencies. 5 4. Recoding the variable into classes.. 5 5. Data Analysis/
Econ Stata Tutorial I: Reading, Organizing and Describing Data. Sanjaya DeSilva
 Econ 329 - Stata Tutorial I: Reading, Organizing and Describing Data Sanjaya DeSilva September 8, 2008 1 Basics When you open Stata, you will see four windows. 1. The Results window list all the commands
Chapter 12 Dealing With Data Tutorial
 Chapter 12 Dealing With Data Tutorial 1. Visit the student website at for this textbook at www.clowjames.net/students. 2. Download the following files: Chapter 12 Dealing with Data (SPSS data file) Chapter
QRG: Using the WYSIWYG Editor
 WYSIWYG Editor QRG: Using the WYSIWYG Editor WYSIWYG stands for What You See Is What You Get. The WYSIWYG Editor is the reason you don t need to be an IT Programmer to write content for your web page.
A cell is highlighted when a thick black border appears around it. Use TAB to move to the next cell to the LEFT. Use SHIFT-TAB to move to the RIGHT.
 Instructional Center for Educational Technologies EXCEL 2010 BASICS Things to Know Before You Start The cursor in Excel looks like a plus sign. When you click in a cell, the column and row headings will
Netscape Composer: Working with Tables
 Why tables? Netscape Composer: Working with Tables Tables on the Web can be divided into two categories: data display and page layout. Although the method for making both kinds of tables is the same, it
Surviving SPSS.
 Surviving SPSS http://dataservices.gmu.edu/workshops/spss http://dataservices.gmu.edu/software/spss Debby Kermer George Mason University Libraries Data Services Research Consultant Mason Data Services
Using Microsoft Excel
 Using Microsoft Excel Formatting a spreadsheet means changing the way it looks to make it neater and more attractive. Formatting changes can include modifying number styles, text size and colours. Many
7.4 Tutorial #4: Profiling LC Segments Using the CHAID Option
 7.4 Tutorial #4: Profiling LC Segments Using the CHAID Option DemoData = gss82.sav After an LC model is estimated, it is often desirable to describe (profile) the resulting latent classes in terms of demographic
Creating Forms. Starting the Page. another way of applying a template to a page.
 Creating Forms Chapter 9 Forms allow information to be obtained from users of a web site. The ability for someone to purchase items over the internet or receive information from internet users has become
2. INTRODUCTORY EXCEL
 CS130 - Introductory Excel 1 2. INTRODUCTORY EXCEL Fall 2017 CS130 - Introductory Excel 2 Introduction to Excel What is Microsoft Excel? What can we do with Excel? CS130 - Introductory Excel 3 Launch Excel
There are 3 main windows, and 3 main types of files, in SPSS: Data, Syntax, and Output.
 U6310 Quantitative Techniques Lab - September 2001 Intro to SPSS SPSS works like this: You have a data set (either you create one or use an existing file such as the GSS). You choose analysis techniques
Introductions Overview of SPSS
 Introductions Overview of SPSS Welcome to our SPSS tutorials. This first tutorial will provide a basic overview of the SPSS environment. We will be using SPSS version 22 for these tutorials, however, versions
Microsoft Office Excel
 Microsoft Office 2007 - Excel Help Click on the Microsoft Office Excel Help button in the top right corner. Type the desired word in the search box and then press the Enter key. Choose the desired topic
AcaStat User Manual. Version 8.3 for Mac and Windows. Copyright 2014, AcaStat Software. All rights Reserved.
 AcaStat User Manual Version 8.3 for Mac and Windows Copyright 2014, AcaStat Software. All rights Reserved. http://www.acastat.com Table of Contents INTRODUCTION... 5 GETTING HELP... 5 INSTALLATION... 5
Surviving SPSS.
 Surviving SPSS http://dataservices.gmu.edu/workshops/spss http://dataservices.gmu.edu/software/spss Debby Kermer George Mason University Libraries Data Services Research Consultant Mason Data Services
Introduction to SPSS on the Macintosh. Scott Patterson,Ph.D. Broadcast and Electronic Communication Arts San Francisco State University.
 Introduction to SPSS on the Macintosh. Scott Patterson,Ph.D. Broadcast and Electronic Communication Arts San Francisco State University Spring 2000 This is a brief guide to using SPSS in the Macintosh
Import Data. Event List. Comma-Separated Value File (.csv)
") Event List Comma-Separated Value File (.csv) Event Study Metrics Copyright 2011 Event Study Metrics UG (haftungsbeschränkt) This software product, including program code and manual, is copyrighted, and
Event List Comma-Separated Value File (.csv) Event Study Metrics Copyright 2011 Event Study Metrics UG (haftungsbeschränkt) This software product, including program code and manual, is copyrighted, and
One does not necessarily have special statistical software to perform statistical analyses.
 Appendix F How to Use a Data Spreadsheet Excel One does not necessarily have special statistical software to perform statistical analyses. Microsoft Office Excel can be used to run statistical procedures.
AcaStat User Manual. Version 10 for Mac and Windows. Copyright 2018, AcaStat Software. All rights Reserved.
 AcaStat User Manual Version 10 for Mac and Windows Copyright 2018, AcaStat Software. All rights Reserved. http://www.acastat.com Table of Contents NEW IN VERSION 10... 6 INTRODUCTION... 7 GETTING HELP...
Section 8 Formatting
 Section 8 Formatting By the end of this Section you should be able to: Format Numbers, Dates & Percentages Change Cell Alignment and Rotate Text Add Borders and Colour Change Row Height and Column Width
DATA. Business Statistics
 DATA Business Statistics CONTENTS The role of data The data matrix Data types Aspects of data Obtaining data Further study THE ROLE OF DATA Data refers to observed facts there are 82 persons in this train
An introduction to SPSS
 An introduction to SPSS To open the SPSS software using U of Iowa Virtual Desktop... Go to https://virtualdesktop.uiowa.edu and choose SPSS 24. Contents NOTE: Save data files in a drive that is accessible
- 1 - Fig. A5.1 Missing value analysis dialog box
 WEB APPENDIX Sarstedt, M. & Mooi, E. (2019). A concise guide to market research. The process, data, and methods using SPSS (3 rd ed.). Heidelberg: Springer. Missing Value Analysis and Multiple Imputation
Adobe Captivate Monday, February 08, 2016
 Slide 1 - Slide 1 MT+ How to export and import mobilities In this demo you will see how to export the template or the list of existing mobilities, an explanation of the format of the CSV file how to use
PracticeMaster Report Writer Guide
 Copyright 2014-2015 Software Technology, Inc. 1621 Cushman Drive Lincoln, NE 68512 (402) 423-1440 Tabs3.com Tabs3, PracticeMaster, and the "pinwheel" symbol ( ) are registered trademarks of Software Technology,
Exploring the Microsoft Access User Interface and Exploring Navicat and Sequel Pro, and refer to chapter 5 of The Data Journalist.
 Chapter 5 Exporting Data from Access and MySQL Skills you will learn: How to export data in text format from Microsoft Access, and from MySQL using Navicat and Sequel Pro. If you are unsure of the basics
Quality, Risk & Safety. HSE Excel Risk Register. Training manual
 Quality, Risk & Safety HSE Excel Risk Register Training manual Version 1, September 2018 1 Contents Introduction, Scope and Function... 3 Section 1: Preparing the Excel Risk Register... 5 Section 1.1:
Import Data. Dataset. Comma-Separated Value File (.csv)
") Dataset Comma-Separated Value File (.csv) Event Study Metrics Copyright 2011 Event Study Metrics UG (haftungsbeschränkt) This software product, including program code and manual, is copyrighted, and all
Dataset Comma-Separated Value File (.csv) Event Study Metrics Copyright 2011 Event Study Metrics UG (haftungsbeschränkt) This software product, including program code and manual, is copyrighted, and all
Research Data Analysis using SPSS. By Dr.Anura Karunarathne Senior Lecturer, Department of Accountancy University of Kelaniya
 Research Data Analysis using SPSS By Dr.Anura Karunarathne Senior Lecturer, Department of Accountancy University of Kelaniya MBA 61013- Business Statistics and Research Methodology Learning outcomes At
DSCI 325: Handout 2 Getting Data into SAS Spring 2017
 DSCI 325: Handout 2 Getting Data into SAS Spring 2017 Data sets come in many different formats. In some situations, data sets are stored on paper (e.g., surveys) and other times data are stored in huge
In this section you will learn some simple data entry, editing, formatting techniques and some simple formulae. Contents
 In this section you will learn some simple data entry, editing, formatting techniques and some simple formulae. Contents Section Topic Sub-topic Pages Section 2 Spreadsheets Layout and Design S2: 2 3 Formulae
Example how not to do it: JMP in a nutshell 1 HR, 17 Apr Subject Gender Condition Turn Reactiontime. A1 male filler
 JMP in a nutshell 1 HR, 17 Apr 2018 The software JMP Pro 14 is installed on the Macs of the Phonetics Institute. Private versions can be bought from
DEPARTMENT OF HEALTH AND HUMAN SCIENCES HS900 RESEARCH METHODS
 DEPARTMENT OF HEALTH AND HUMAN SCIENCES HS900 RESEARCH METHODS Using SPSS Topics addressed today: 1. Accessing data from CMR 2. Starting SPSS 3. Getting familiar with SPSS 4. Entering data 5. Saving data
Pivot Tables, Lookup Tables and Scenarios
 Introduction Format and manipulate data using pivot tables. Using a grading sheet as and example you will be shown how to set up and use lookup tables and scenarios. Contents Introduction Contents Pivot
Beginner s Guide to Microsoft Excel 2002
 Beginner s Guide to Microsoft Excel 2002 Microsoft Excel lets you create spreadsheets, which allow you to make budgets, track inventories, calculate profits, and design charts and graphs. 1. Open Start
Import Data. Event List. Comma-Separated Value File (.csv)
") Event List Comma-Separated Value File (.csv) Event Study Metrics Copyright 2011 Event Study Metrics UG (haftungsbeschränkt) This software product, including program code and manual, is copyrighted, and
Event List Comma-Separated Value File (.csv) Event Study Metrics Copyright 2011 Event Study Metrics UG (haftungsbeschränkt) This software product, including program code and manual, is copyrighted, and
Dr Wan Nor Arifin Unit of Biostatistics and Research Methodology, Universiti Sains Malaysia.
 Introduction to SPSS Dr Wan Nor Arifin Unit of Biostatistics and Research Methodology, Universiti Sains Malaysia. wnarifin@usm.my Outlines Introduction Data Editor Data View Variable View Menus Shortcut
Inserting a table plus all related tips on the table
 Inserting a table plus all related tips on the table Microsoft Word This would be the quickest way of inserting a table. 1. One click in the location where you wish to insert a table 2. Click the Insert
Text University of Bolton.
 Text University of Bolton. The screen shots used in this workbook are from copyrighted licensed works and the copyright for them is most likely owned by the publishers of the content. It is believed that
Data Analysis using SPSS
 Data Analysis using SPSS 2073/03/05 03/07 Bijay Lal Pradhan, Ph.D. Ground Rule Mobile Penalty Participation Involvement Introduction to SPSS Day 1 2073/03/05 Session I Bijay Lal Pradhan, Ph.D. Object of
Unit 12. Electronic Spreadsheets - Microsoft Excel. Desired Outcomes
 Unit 12 Electronic Spreadsheets - Microsoft Excel Desired Outcomes Student understands Excel workbooks and worksheets Student can navigate in an Excel workbook and worksheet Student can use toolbars and
Kenora Public Library. Computer Training. Introduction to Excel
 Kenora Public Library Computer Training Introduction to Excel Page 2 Introduction: Spreadsheet programs allow users to develop a number of documents that can be used to store data, perform calculations,
Outline. Simple Commands. Definitions. Microsoft Excel for Data Management. Dr. K. A. Korb PSY 828 University of Jos 10/31/2017
 Outline Microsoft Excel for Data Management Introduction to Microsoft Excel Data Processing Data Checking Dr. K. A. Korb Definitions Microsoft Excel: Spreadsheet with rows and columns of a grid to store,
Statistical Analysis Using SPSS for Windows Getting Started (Ver. 2018/10/30) The numbers of figures in the SPSS_screenshot.pptx are shown in red.
 The numbers of figures in the SPSS_screenshot.pptx are shown in red.") Statistical Analysis Using SPSS for Windows Getting Started (Ver. 2018/10/30) The numbers of figures in the SPSS_screenshot.pptx are shown in red. 1. How to display English messages from IBM SPSS Statistics
Statistical Analysis Using SPSS for Windows Getting Started (Ver. 2018/10/30) The numbers of figures in the SPSS_screenshot.pptx are shown in red. 1. How to display English messages from IBM SPSS Statistics
Microsoft Excel 2013: Part 3 More on Formatting Cells And Worksheet Basics. To apply number formatting:
 Microsoft Excel 2013: Part 3 More on Formatting Cells And Worksheet Basics Formatting text and numbers In Excel, you can apply specific formatting for text and numbers instead of displaying all cell content
Learning Worksheet Fundamentals
 1.1 LESSON 1 Learning Worksheet Fundamentals After completing this lesson, you will be able to: Create a workbook. Create a workbook from a template. Understand Microsoft Excel window elements. Select
Introduction to SPSS
 Introduction to SPSS Purpose The purpose of this assignment is to introduce you to SPSS, the most commonly used statistical package in the social sciences. You will create a new data file and calculate
THE VARIABLE LIST Sort the Variable List Create New Variables Copy Variables Define Value Labels... 4
 The Variable List Contents THE VARIABLE LIST... 1 Sort the Variable List... 2 Create New Variables... 3 Copy Variables... 3 Define Value Labels... 4 Define Missing Values... 4 Search and Filter Variables...
NCSS Statistical Software. The Data Window
 Chapter 103 Introduction This chapter discusses the operation of the NCSS Data Window, one of the four main windows of the NCSS statistical analysis system. The other three windows are the Output Window,
Basic Shortcut Keys File menu options in current program Edit options in current program Universal Help (for all programs)
") Basic Shortcut Keys Alt + F Alt + E F1 Ctrl + A Ctrl + X Shift + Del ns Ctrl + V Shift + Ins Home Ctrl + Home End Ctrl + End Shift + Home Shift + End Ctrl + Ctrl + File menu options in current program
Basic Shortcut Keys Alt + F Alt + E F1 Ctrl + A Ctrl + X Shift + Del ns Ctrl + V Shift + Ins Home Ctrl + Home End Ctrl + End Shift + Home Shift + End Ctrl + Ctrl + File menu options in current program
How to Import Part Numbers to Proman
 How to Import Part Numbers to Proman This is a brief document that outlines how to take an Excel spreadsheet and either load new parts numbers into Proman or update data on existing part numbers. Before
The Menu and Toolbar in Excel (see below) look much like the Word tools and most of the tools behave as you would expect.
 look much like the Word tools and most of the tools behave as you would expect.") Launch the Microsoft Excel Program Click on the program icon in Launcher or the Microsoft Office Shortcut Bar. A worksheet is a grid, made up of columns, which are lettered and rows, and are numbered.
Launch the Microsoft Excel Program Click on the program icon in Launcher or the Microsoft Office Shortcut Bar. A worksheet is a grid, made up of columns, which are lettered and rows, and are numbered.
Chapter 11 Dealing With Data SPSS Tutorial
 Chapter 11 Dealing With Data SPSS Tutorial 1. Visit the student website at for this textbook at www.clowjames.net/students. 2. Download the following files: Chapter 11 Dealing with Data (SPSS data file)
MS Excel Henrico County Public Library. I. Tour of the Excel Window
 MS Excel 2013 I. Tour of the Excel Window Start Excel by double-clicking on the Excel icon on the desktop. Excel may also be opened by clicking on the Start button>all Programs>Microsoft Office>Excel.
7/14/2009. Chapters Autocad Multi Line Text Tools. Multi Line Text Tool Ribbon. Multi Line Text Tool. July 14, 2009
 Chapters 9-11 July 14, 2009 Chapter 9 Learning Objectives Describe and use proper text standards. Calculate drawing scale and text height. Develop and use text styles. Make multiple lines of text with
WORKSHOP: Using the Health Survey for England, 2014
 WORKSHOP: Using the Health Survey for England, 2014 There are three sections to this workshop, each with a separate worksheet. The worksheets are designed to be accessible to those who have no prior experience
Formatting Worksheets
 140 :: Data Entry Operations 7 Formatting Worksheets 7.1 INTRODUCTION Excel makes available numerous formatting options to give your worksheet a polished look. You can change the size, colour and angle
Gloucester County Library System EXCEL 2007
 Gloucester County Library System EXCEL 2007 Introduction What is Excel? Microsoft E x c e l is an electronic s preadsheet program. I t is capable o f performing many diff e r e n t t y p e s o f c a l
Frequency Tables. Chapter 500. Introduction. Frequency Tables. Types of Categorical Variables. Data Structure. Missing Values
 Chapter 500 Introduction This procedure produces tables of frequency counts and percentages for categorical and continuous variables. This procedure serves as a summary reporting tool and is often used
MAIL MERGE DIRECTORY USE THE MAIL MERGE WIZARD
 MAIL MERGE DIRECTORY USE THE MAIL MERGE WIZARD When working with the Mail Merge feature, it is possible to create several types of documents, such as directories. A directory is a list of the data in the