Choose the file (*.EMI) to be converted. Clicking twice in the file name the program will import the data informing you the amount of values.
|
|
|
- Edwina Wilkins
- 5 years ago
- Views:
Transcription
. The following screen will appear: Go to Input and click on Input Profiler file. Choose the file (*.")
1 Short Guide for EM4Soil users A- Preparation of the data The data from EM400P should be converted in a format readable for EM4Soil. To do that run the program PROFTOEMS (clicking twice in the name of the program). The following screen will appear: Go to Input and click on Input Profiler file. Choose the file (*.EMI) to be converted. Clicking twice in the file name the program will import the data informing you the amount of values. 1


2 Clicking in OK will finish the importing. Go now to the Instrument Setup to give the height of the equipment during the acquisition and the name of the survey: 2

3 After importing the data you can display a graphic with your data. Go to Display and press the display data: Then you can have an idea about the quality of your data and to decide which frequencies do you want to save for inversion on EMS4Soil. To do that, go to Save: And choose the frequencies: 3


4 And click in OK, and save the file in a folder. That file will be import by EM4Soil for processing and inversion. The file is an ASCII one and the first rows will be like the example below: EMP400_ X Y Z ECa4000 ECa6000 ECa15000 Lat Long time

5 Close the program and start the EM4Soil one, clicking twice in the name. B- Using the EM4Soil program The program will display the following screen: The program needs you select the equipment used for acquisition. Go to Input and Input Sensor and choose the PROFILER. After click OK. If your data has been collected in several profiles it is considered a Area survey and should be import in Input, Input Data, Area: 5


6 Choose the file to input (probably you need to modify the type of file from DAT to All files): Clicking twice in the file name the program will input the file and you will be informed about the data: Equipment you have chosen; number of values; number of frequencies and if you have negative values. In any case No initial model will be made, because you have input a AREA survey NOT a line survey. 6


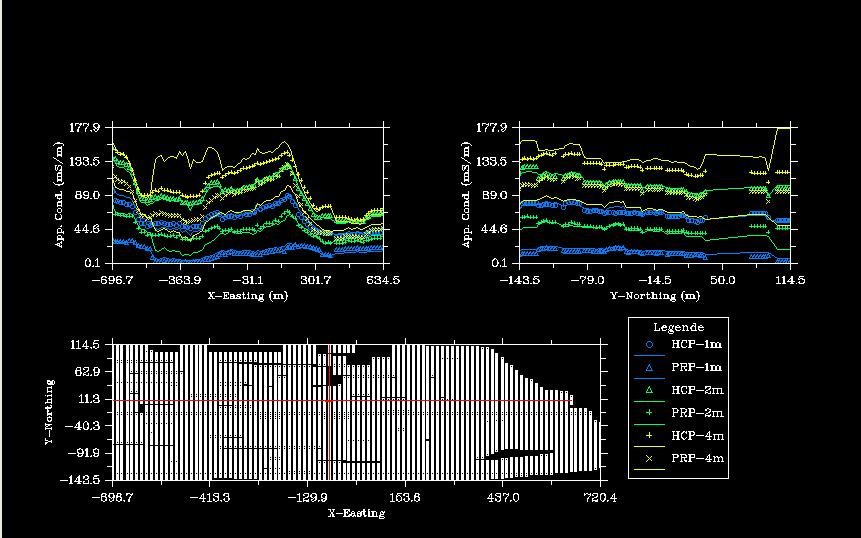
7 Clicking in OK the program will open the MAP Module where you can see the data and select the profiles to be inverted. The following screen will be displayed: You can go to Display, Survey Layout to see the location of your data: 7


8 Or display the Data, Cond/Res and see your data: You can see the maps of all frequencies clicking on the right button of the mouse. 8

9 The Model slices only can be used after the inversion of the profiles (will see this feature latter). The entrance settings will allow you to do some alteration on the map display: You can print any Map going to the Save menu. Let s see how to define and export profiles for inversion. First display again the Survey layout. After go to the profile mode, Add Profiles: 9


10 When you click in Add Profile the arrow of the mouse modifies into a cross. Go to the beginning of the profile and click on the left mouse button. After go to the end of the profiles and click on the left mouse button. Without to move, click on the right mouse. This finish the profile selection and open the following screen: Give a name for the profile and choose the search radius (should be a little smaller than the distance between measured data). If you do not want more profiles select NO. After, the selected profiles should be saved. Go to Save, Save Profiles: 10


11 Select the profile you want to save and do that clicking in OK. After you have saved the profiles, quit the Map Module clicking in QUIT. You can back to the Map module at any time using the entrance Input, Go to Map of the EM4Soil: 11

.")
12 C- Inverting (Q2D) and Displaying results Now you must invert the profiles you have saved. To do that, go to EM4Soil program and input the first profile using the Input, Data, Line option: During the input you can see this warning: In general you do not need to go for decimation (only if you have a significant data redundancy). After input the data will be displayed: 12

13 If the display is like the following, it means that your search radius was too large. You must reselect the profile. After importing the profile you can filter, try to correct negative values etc If the data did not have any negative value, an initial model was saved (you have been informed about it during the data input) and you can use it for the inversion. If it is the case, go to the inversion and select the Inversion Parameters: After that, go to the Inversion, Inversion Q2D, Inversion calculation (FS): 13

14 Select the data you want to invert: The following warning will appear: Click on YES (SIM is yes in Portuguese language). The program will start the inversion. You can follow the inversion in the DOS windows opened when the EM4Soil program started. 14

15 Clicking in OK the program save all the needed files and you can now see the inversion results and save the model for further processing. Use the buttons on left of the screen to display the data/results misfit and the model also: In this particular case the misfit is very high. There are several factors that affect the misfit values: data quality (the most important), initial conductivity, number of 15

 the program does not do an")
16 iterations, damping factor etc. This model was made using the default parameters. A better model can be calculated using a damping of 0.02 and 15 iterations. After to calculate a satisfactory model, this should be saved. Go to Save option: NOTE: if your data have negative values (even if they have been corrected) the program does not do an initial model. In such case before the inversion you must define an initial model. Go to Inversion, define initial model (see the sequence of screens): 16


17 Therefore an initial model of uniform conductivity of 130 ms/m was defined. Now you can do the inversion. D- Using the Map Module to display the models After to have the models calculated you can back to the Map Module going to the Input, Go to Map option. Then go to Display, Models. The following warning appears: 17


18 Clicking in Yes you will input the models file: All the files should be input in sequence. After importing the last model file click in Cancel and the program will display the first level of your models. 18


19 In same cases it is better to display the values in a Log scale. This can be selected in the Settings entrance: You can also select the depth (elevations) of the slices to be shown. To display the next slice use the right mouse button. Print the correspondent figures using the Print entrance in the menu bar. 19


20 E- Preparing data for the Q3D inversion Data from a survey (area) can be inverted using the Q3D algorithm. The data should firstly correct from negative values. In the next step, before gridding the data, the user should decide about the rotation of the survey in order to optimize the mesh for the inversion. 20


21 The rotated result can be saved for future use. However, the gridding of a rotated survey can be done immediately the rotation with saving the results. 21


22 Note: after selection of rotated click in OK to accept the selection (this is not necessary selecting raw data ). Select the number of #Xlines and #Ylines and click OK. The gridding process can take a while for surveys with a high number of measurements. Wait till the program finish. The mean distance value that appears in the screen is an average value of the diagonal of the mesh (sqrt(dx 2 + dy 2 )). The user should inspect the gridding result using the option Display/Grid/Filtered data. In the example below the #Ylines value of 100 is too high originating several zones without any data with consequences in the inversion results. 22


. The Manual option is good for algorithm S3.")
23 After the gridding the filter of the topography or of the apparent conductivity values can now be applied. The data are now ready to be inverted. To do that, select the parameters. inversion (number of iterations, damping factor and the algorithm to use. ) Higher damping factor will smooth the model. Algorithm S1 allows more variability in the model than algorithm S2. Algorithm S3 is for 1D inversion without any spatial constraint (a 1D model of 2 or 3 layers should be selected as initial model for this option). The Manual option is good for algorithm S3. Automatic and Uniform medium are options that use the default layered model and can be used with care. The user should prepare a 1D model file according his experience and input it. 23


24 The start and finishing RMS corresponding to each section will be presented in a table for evaluation. 24


25 The final model can be displayed in different ways. 25
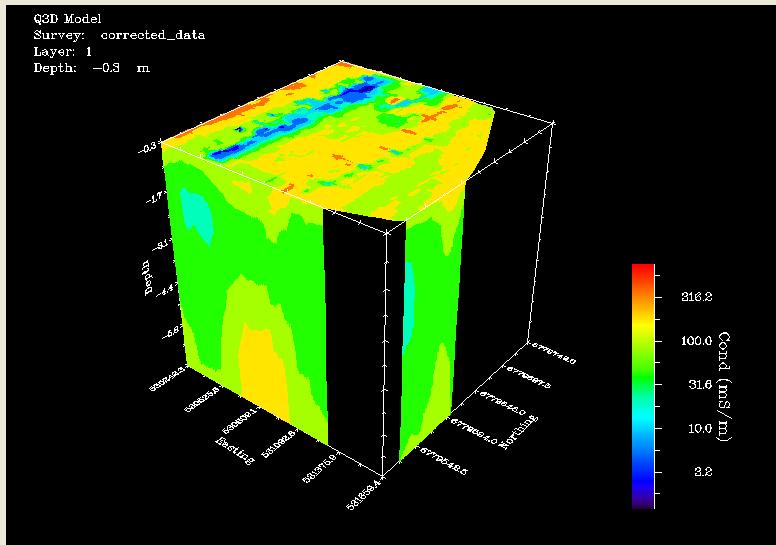
26 26

27 The user can save (mainly the MAP file) and print the results using the Save and Print options in the menu bar. 27
EM4Soil. A program for 1-D laterally constrained inversion of EM data. Quasi-3D Module. Version-0.0
 EM4Soil A program for 1-D laterally constrained inversion of EM data Quasi-3D Module Version-0.0 This Software is produced by EM-TOMO with the collaboration of John Triantafilis Email: emtomog@gmail.com
Stage terrain 3A Heissenstein. Electrical surveying
 Stage terrain 3A Heissenstein Electrical surveying Introduction The principle method for measuring the surface resistivity is always the same. An electric current is sent into the subsurface through two
Stage terrain 3A Heissenstein. Electrical surveying
 Stage terrain 3A Heissenstein Electrical surveying Introduction The principle method for measuring the surface resistivity is always the same. An electric current is sent into the subsurface through two
DW Tomo 8.1 User Guide
 DW Tomo 8.1 User Guide Copyright 2016, All rights reserved. Table of Contents Preface...1 Conventions Used in This Guide...1 Where to Find Information...1 Technical Support...2 Feedback...2 Chapter 1 Introducing
DAT38MK2 Version 1.12
 COMPUTER PROGRAM MANUAL (SURVEY DATA REDUCTION MANUAL) DAT38MK2 Version 1.12 June, 2011 Geonics Limited 1745 Meyerside Drive, Mississauga, Ontario, Canada L5T 1C6 Tel: (905) 670 9580 Fax: (905) 670 9204
EMIGMA V9.x Premium Series April 8, 2015
 EMIGMA V9.x Premium Series April 8, 2015 EMIGMA for Gravity EMIGMA for Gravity license is a comprehensive package that offers a wide array of processing, visualization and interpretation tools. The package
EMIGMA V9.x Premium Series
 EMIGMA V9.x Premium Series EMIGMA BASIC January 2014 Firstly, EMIGMA Basic describes the tools that are available in every EMIGMA license. Secondly, EMIGMA Basic is the name we use for our free viewing
Tutorial 6. Pumping Well and River
 Tutorial 6 Pumping Well and River Table of Contents Objective. 1 Step-by-Step Procedure... 2 Section 1 Data Input. 2 Step 1: Open Adaptive Groundwater Input (.agw) File. 2 Step 2: Pumping Well Design Database
SMS v D Summary Table. SRH-2D Tutorial. Prerequisites. Requirements. Time. Objectives
 SMS v. 12.3 SRH-2D Tutorial Objectives Learn the process of making a summary table to compare the 2D hydraulic model results with 1D hydraulic model results. This tutorial introduces a method of presenting
3DReshaper Application. Tank Control with 3DReshaper
 3DReshaper Application Tank Control with 3DReshaper Contents 1. Extract the best cylinder... 2 2. 3D Inspection... 2 Compare the tank to the best cylinder... 2 Add labels... 3 Print a report... 3 Go to
Processing your Induced Polarization Data
 Processing your Induced Polarization Data This Processing your IP Data How-To Guide will introduce you to a variety of IP processing tools including how to: 1. Set up a database for IP processing 2. Adding
SportsAgenda User manual
 Index Chapter 1 How to install and configure the software... 5 1.1 Preliminary operation... 5 1.2 Installing SportsAgenda under Microsoft Windows XP... 6 1.3 Installing SportsAgenda under Microsoft Windows
Oasis montaj How-To Guide. VOXI Earth Modelling - Running an AGG Unconstrained Inversion
 Oasis montaj How-To Guide VOXI Earth Modelling - Running an AGG Unconstrained Inversion The software described in this manual is furnished under license and may only be used or copied in accordance with
Tutorial 7 Finite Element Groundwater Seepage. Steady state seepage analysis Groundwater analysis mode Slope stability analysis
 Tutorial 7 Finite Element Groundwater Seepage Steady state seepage analysis Groundwater analysis mode Slope stability analysis Introduction Within the Slide program, Slide has the capability to carry out
Section 8. 8 Format Editor
 Section 8 8 Format Editor The Format Editor allows the creation and editing of the log presentation or format files. The output of the format editor are files of the type *.prs which are subsequently used
Creating and Displaying Multi-Layered Cross Sections in Surfer 11
 Creating and Displaying Multi-Layered Cross Sections in Surfer 11 The ability to create a profile in Surfer has always been a powerful tool that many users take advantage of. The ability to combine profiles
RESISTIVITY IMAGING:
 RESISTIVITY IMAGING: step-by-step operation of SYSCAL Switch resistivitymeters 1 st STEP: CREATE A SEQUENCE OF READINGS WITH ELECTRE II SOFTWARE 2 nd STEP: TAKE READINGS IN THE FIELD WITH SYSCAL SWITCH
Tekla Structures Analysis Guide. Product version 21.0 March Tekla Corporation
 Tekla Structures Analysis Guide Product version 21.0 March 2015 2015 Tekla Corporation Contents 1 Getting started with analysis... 7 1.1 What is an analysis model... 7 Analysis model objects...9 1.2 About
Lab 12: Sampling and Interpolation
 Lab 12: Sampling and Interpolation What You ll Learn: -Systematic and random sampling -Majority filtering -Stratified sampling -A few basic interpolation methods Videos that show how to copy/paste data
41126 Cognento (MODENA) Italy Via Bottego 33/A Tel: +39-(0) Internet: Fax: +39-(0)
 Italy Via Bottego 33/A Tel: +39-(0) Internet: Fax: +39-(0)") QUICK ANALYZER User Guide Version 5.3 Index 1.0 Generality... 2 LICENSE AGREEMENT... 3 2.0 Channels Configuration... 4 2.1 IdroScan Data Log Management... 6 3.0 Test Results... 9 4.0 Excel Export... 10
QUICK ANALYZER User Guide Version 5.3 Index 1.0 Generality... 2 LICENSE AGREEMENT... 3 2.0 Channels Configuration... 4 2.1 IdroScan Data Log Management... 6 3.0 Test Results... 9 4.0 Excel Export... 10
Tutorial 7. Water Table and Bedrock Surface
 Tutorial 7 Water Table and Bedrock Surface Table of Contents Objective. 1 Step-by-Step Procedure... 2 Section 1 Data Input. 2 Step 1: Open Adaptive Groundwater Input (.agw) File. 2 Step 2: Assign Material
Creating a new Rayfract profile, importing the SEG-2 trace files and the Gremix header data :
 RAYFRACT Tutorial specific to IGT line 14 : The seven SEG-2 formatted shot sorted binary trace data files and the Interpex Gremix.GRM file used to import first breaks as described below are available on
IP Post-Process Software
 IP Post-Process Software Version 1.2.4 Instruction Manual 860 boul. de la Chaudière, suite 200 Québec (QC), Canada, G1X 4B7 Tel.: +1 (418) 877-4249 Fax: +1 (418) 877-4054 E-Mail: gdd@gdd.ca Web site: www.gdd.ca
Mosaicing Side Scan data using MB/SS-Logger (Isis) and Triton Map
 and Triton Map") Mosaicing Side Scan data using MB/SS-Logger (Isis) and Triton Map Introduction The guide describes the process of taking raw.xtf files logged in Isis, adjusting the imagery using slant range correction
Mosaicing Side Scan data using MB/SS-Logger (Isis) and Triton Map Introduction The guide describes the process of taking raw.xtf files logged in Isis, adjusting the imagery using slant range correction
Revit - Conceptual Mass. STEP 1: open Revit _ from the home screen under Families click on New Conceptual Mass _ open the Mass template file
 Revit - Conceptual Mass STEP 1: open Revit _ from the home screen under Families click on New Conceptual Mass _ open the Mass template file STEP 2: type LL to create a new level _ enter 100 _ create 2
POS Designer Utility
 POS Designer Utility POS Designer Utility 01/15/2015 User Reference Manual Copyright 2012-2015 by Celerant Technology Corp. All rights reserved worldwide. This manual, as well as the software described
Tutorial (Beginner level): Orthomosaic and DEM Generation with Agisoft PhotoScan Pro 1.3 (with Ground Control Points)
: Orthomosaic and DEM Generation with Agisoft PhotoScan Pro 1.3 (with Ground Control Points)") Tutorial (Beginner level): Orthomosaic and DEM Generation with Agisoft PhotoScan Pro 1.3 (with Ground Control Points) Overview Agisoft PhotoScan Professional allows to generate georeferenced dense point
Tutorial (Beginner level): Orthomosaic and DEM Generation with Agisoft PhotoScan Pro 1.3 (with Ground Control Points) Overview Agisoft PhotoScan Professional allows to generate georeferenced dense point
Target 3D Geology Surfaces
 Target 3D Geology Surfaces The Target 3D Geology Surfaces (Contact Surface from Geology Grids) tool enables you to create subsurface topography grids, where the "Z" values correspond to the elevation of
BobCAD-CAM FAQ #50: How do I use a rotary 4th axis on a mill?
 BobCAD-CAM FAQ #50: How do I use a rotary 4th axis on a mill? Q: I ve read FAQ #46 on how to set up my milling machine. How do I enable 4th axis to actually use it? A: Enabling 4th axis in the machine
v SMS 12.2 Tutorial Observation Prerequisites Requirements Time minutes
 v. 12.2 SMS 12.2 Tutorial Observation Objectives This tutorial will give an overview of using the observation coverage in SMS. Observation points will be created to measure the numerical analysis with
Chapter 7: Importing Modeled or Gridded Data
 Chapter 7: Importing Modeled or Gridded Data SADA provides a suite of geospatial modeling and contouring tools that are flexible enough to handle a wide variety of applications. However, if you are more
OPERATING INSTRUCTIONS. EM38xp Version November, 2006
 OPERATING INSTRUCTIONS EM38 DATA LOGGING SYSTEM FOR WINDOWS XP BASED FIELD COMPUTER EM38xp Version 1.01 November, 2006 Geonics Limited 1745 Meyerside Drive, Mississauga, Ontario, Canada L5T 1C6 Tel: (905)
APPLICATION NOTE /20/02 Getting started using IPM240-5E with a brushless motor
 Problem: For new users of an intelligent drive, starting to implement a motion control application can be a quite complex task. You need to know how to hook-up the components of the motion system, to configure
v TUFLOW-2D Hydrodynamics SMS Tutorials Time minutes Prerequisites Overview Tutorial
 v. 12.2 SMS 12.2 Tutorial TUFLOW-2D Hydrodynamics Objectives This tutorial describes the generation of a TUFLOW project using the SMS interface. This project utilizes only the two dimensional flow calculation
GY461 GIS 1: Environmental Campus Topography Project with ArcGIS 9.x
 I. Introduction GY461 GIS 1: Environmental In this project you will use data from a topographic survey of the USA campus to generate 2 separate maps: 1. A color-coded 2-dimensional topographic contour
Roctest Limited, All rights reserved.
 fil Roctest Limited, 2013. All rights reserved. This product should be installed and operated only by qualified personnel. Its misuse is potentially dangerous. The Company makes no warranty as to the information
Mo 21P1 08 Comparison of Different Acquisition Patterns for 2D Tomographic Resistivity Surveys
 Mo 21P1 08 Comparison of Different Acquisition Patterns for 2D Tomographic Resistivity Surveys R. Martorana* (University of Palermo), P. Capizzi (University of Palermo), A. D'Alessandro (INGV - Roma) &
Tutorial (Intermediate level): 3D Model Reconstruction of the building with Agisoft PhotoScan 1.0.0
: 3D Model Reconstruction of the building with Agisoft PhotoScan 1.0.0") Tutorial (Intermediate level): 3D Model Reconstruction of the building with Agisoft PhotoScan 1.0.0 Add Photos To add photos select Add Photos... command from the Workflow menu or click Add Photos button
Tutorial (Intermediate level): 3D Model Reconstruction of the building with Agisoft PhotoScan 1.0.0 Add Photos To add photos select Add Photos... command from the Workflow menu or click Add Photos button
Observation Coverage SURFACE WATER MODELING SYSTEM. 1 Introduction. 2 Opening the Data
 SURFACE WATER MODELING SYSTEM Observation Coverage 1 Introduction An important part of any computer model is the verification of results. Surface water modeling is no exception. Before using a surface
Spatial Interpolation & Geostatistics
 (Z i Z j ) 2 / 2 Spatial Interpolation & Geostatistics Lag Lag Mean Distance between pairs of points 1 Tobler s Law All places are related, but nearby places are related more than distant places Corollary:
XPS1 Automated Multi-Sample Run Procedure
 XPS1 Automated Multi-Sample Run Procedure Follow the XPS Operating Procedure to load samples into the SAC chamber. Once the samples are in the SAC chamber, the following procedure can be used to automate
v SMS 11.1 Tutorial SRH-2D Prerequisites None Time minutes Requirements Map Module Mesh Module Scatter Module Generic Model SRH-2D
 v. 11.1 SMS 11.1 Tutorial SRH-2D Objectives This lesson will teach you how to prepare an unstructured mesh, run the SRH-2D numerical engine and view the results all within SMS. You will start by reading
MARS v Release Notes Revised: December 20, 2018 (Builds )
") MARS v2019.0 Release Notes Revised: December 20, 2018 (Builds 8399.00 8400.00) Contents New Features:... 2 Enhancements:... 2 List of Bug Fixes... 7 1 STATEMENT OF KNOWN ISSUE: The following Albers coordinate
MARS v2019.0 Release Notes Revised: December 20, 2018 (Builds 8399.00 8400.00) Contents New Features:... 2 Enhancements:... 2 List of Bug Fixes... 7 1 STATEMENT OF KNOWN ISSUE: The following Albers coordinate
Tunnel Excavation Disturbed Zone (EDZ) imaging with Rayfract version 3.35 :
 imaging with Rayfract version 3.35 :") Tunnel Excavation Disturbed Zone (EDZ) imaging with Rayfract version 3.35 : Fig. 1 : left : Trace Shot gather, right : Refractor Shot breaks. Shows fit between picked times (solid colored curves) and modeled
Tunnel Excavation Disturbed Zone (EDZ) imaging with Rayfract version 3.35 : Fig. 1 : left : Trace Shot gather, right : Refractor Shot breaks. Shows fit between picked times (solid colored curves) and modeled
Oasis montaj How-To Guide. VOXI Earth Modelling - Running an Inversion
 Oasis montaj How-To Guide VOXI Earth Modelling - Running an Inversion The software described in this manual is furnished under license and may only be used or copied in accordance with the terms of the
HYDROGEOPHYSICS GROUP AARHUS WORKBENCH - CVES MODULE VERSION 1.0
 HYDROGEOPHYSICS GROUP AARHUS WORKBENCH - CVES MODULE VERSION 1.0 CONTENTS START-UP (1) IMPORT (2) Import - data (2.1)... 2 ASCII file formats for positioning (exy, ewp and ez) Import - models (2.2)...
Objectives This tutorial shows how to build a Sedimentation and River Hydraulics Two-Dimensional (SRH-2D) simulation.
 simulation.") v. 12.1 SMS 12.1 Tutorial Objectives This tutorial shows how to build a Sedimentation and River Hydraulics Two-Dimensional () simulation. Prerequisites SMS Overview tutorial Requirements Model Map Module
v. 12.1 SMS 12.1 Tutorial Objectives This tutorial shows how to build a Sedimentation and River Hydraulics Two-Dimensional () simulation. Prerequisites SMS Overview tutorial Requirements Model Map Module
3.2 TIPS FOR USING MATLAB
 3.2 TIPS FOR USING MATLAB 3.2.1 Exporting Graphics from MATLAB to WORD and Editing Details Given a graphical plot in MATLAB, say graph.fig, the following procedure allows this graph to be imported into
Analysis of different interpolation methods for uphole data using Surfer software
 10 th Biennial International Conference & Exposition P 203 Analysis of different interpolation methods for uphole data using Surfer software P. Vohat *, V. Gupta,, T. K. Bordoloi, H. Naswa, G. Singh and
INTRODUCTION GUIDE TO 3D RESISTIVITY IMAGING
 INTRODUCTION GUIDE TO 3D RESISTIVITY IMAGING clay layer LANDFILL WITH CONDUCTIVE LIXIVIATES 10 3 apparent resistivity (ohm.m) 10 alluviums limestone clay 1 AB/2 (m) 10 2 resistivity (ohm.m) clay layer
Emerge Workflow CE8 SAMPLE IMAGE. Simon Voisey July 2008
 Emerge Workflow SAMPLE IMAGE CE8 Simon Voisey July 2008 Introduction The document provides a step-by-step guide for producing Emerge predicted petrophysical volumes based on log data of the same type.
Tutorial (Beginner level): Orthomosaic and DEM Generation with Agisoft PhotoScan Pro 1.3 (without Ground Control Points)
: Orthomosaic and DEM Generation with Agisoft PhotoScan Pro 1.3 (without Ground Control Points)") Tutorial (Beginner level): Orthomosaic and DEM Generation with Agisoft PhotoScan Pro 1.3 (without Ground Control Points) Overview Agisoft PhotoScan Professional allows to generate georeferenced dense point
Tutorial (Beginner level): Orthomosaic and DEM Generation with Agisoft PhotoScan Pro 1.3 (without Ground Control Points) Overview Agisoft PhotoScan Professional allows to generate georeferenced dense point
Geogiga Seismic Pro 8.0 Release Notes
 Geogiga Seismic Pro 8.0 Release Notes Copyright 2015, All rights reserved. Table of Contents Introduction...1 Part 1 General Enhancements...3 Trace Display...4 Color Section Display...6 Curve Plotting...8
3DReshaper Help DReshaper Beginner's Guide. Surveying
 3DReshaper Beginner's Guide Surveying 1 of 29 Cross sections Exercise: Tunnel analysis Surface analysis Exercise: Complete analysis of a concrete floor Surveying extraction Exercise: Automatic extraction
10.1 Conversions. Grid to Geodetic
 10.1 Conversions Geodetic conversions work with the current geodetic settings. Convert grid coordinates to geodetic (Latitude/Longitude) or vice versa with any of the available projections. All results
Spatial Interpolation - Geostatistics 4/3/2018
 Spatial Interpolation - Geostatistics 4/3/201 (Z i Z j ) 2 / 2 Spatial Interpolation & Geostatistics Lag Distance between pairs of points Lag Mean Tobler s Law All places are related, but nearby places
Potent can model multi-component data, such as down-hole Fx, Fy, Fz magnetic data, or tensor gravity data.
 Getting Started What is Potent? Main concepts A simple tutorial What is Potent? Potent is a program for modelling the magnetic and gravitational effects of subsurface structures. It provides a highly interactive
Timelapse ERT inversion approaches and their applications
 Timelapse ERT inversion approaches and their applications THOMAS GÜNTHER Leibniz-Institute for Applied Geophysics (LIAG), Hannover, Germany. thomas.guenther@liag-hannover.de Introduction Aim of timelapse
Geogiga Seismic Pro 8.3 Release Notes
 Geogiga Seismic Pro 8.3 Release Notes Copyright 2017, All rights reserved. Table of Contents Introduction...1 Part 1 Utility Modules...2 Part 2 Reflection Modules...4 Updates in SF Imager...5 Updates in
User Manual EMFAD - ScanPRO
 User Manual EMFAD - ScanPRO 0. Introduction 2 1. System conditions and license agreements 2 1.1 System conditions... 2 1.2 Program installation. 2 1.3 License agreements 2 1.4 Terms of utilization. 3 1.5
FG Elettronica s.n.c. Via Cesare Battisti 53, Castelfiorentino (FI) Italy
 Italy") 1 DESCRIPTION SMART HESS-DIGITEST OFFERS AN AUTOMATIC AND DIGITIZED METHOD FOR THE TEST OF HESS LANCASTER, IMPROVED IN TERMS OF ACCURACY RELIABILITY AND SPEED TIME. AN ELABORATE SW RESIDENT IN THE COMPUTER
1 DESCRIPTION SMART HESS-DIGITEST OFFERS AN AUTOMATIC AND DIGITIZED METHOD FOR THE TEST OF HESS LANCASTER, IMPROVED IN TERMS OF ACCURACY RELIABILITY AND SPEED TIME. AN ELABORATE SW RESIDENT IN THE COMPUTER
v Observations SMS Tutorials Prerequisites Requirements Time Objectives
 v. 13.0 SMS 13.0 Tutorial Objectives This tutorial will give an overview of using the observation coverage in SMS. Observation points will be created to measure the numerical analysis with measured field
FieldGenius 2005 Ver 1.2 MicroSurvey Software, Inc. 2005
 New Functionality GPS Measurements Two new options in Program Settings that will speed up the measurement process when using an RTK receiver. Auto GPS Stats If this is turned on, during a measurement if
Exploring IX1D The Terrain Conductivity/Resistivity Modeling Software
 Exploring IX1D The Terrain Conductivity/Resistivity Modeling Software You can bring a shortcut to the modeling program IX1D onto your desktop by right-clicking the program in your start > all programs
MAIL MERGE MARKETING WITH CARDEX
 This procedure contains several steps to accomplish exporting the Cardex records to a text file and merging the exported Cardex data to Microsoft Word for address labels. Exporting the Cardex records to
APPENDIX B STEP-BY-STEP APPLICATIONS OF THE FEMWATER-LHS
 APPENDIX B STEP-BY-STEP APPLICATIONS OF THE FEMWATER-LHS Steady Two-Dimensional Drainage Problem 1. Double-click on the Argus ONE icon to open Argus ONE. 2. From the PIEs menu found along the top of the
COGO-50 v1.81 User Manual By Jacob Wall
 COGO-50 v1.81 User Manual By Jacob Wall COGO-50 is a (mostly) UserRPL program written for the HP 49g+/50g using ROM Version 2.09 (also tested with ROM Version 2.15). It is a land surveying program capable
A Tutorial Guide to Tribology Plug-in
 Supplementary Material A Tutorial Guide to Tribology Plug-in Tribology An ImageJ Plugin for surface topography analysis of laser textured surfaces. General Description This plugin presents an easy-to-use
Refractor 8.1 User Guide
 Refractor 8.1 User Guide Copyright 2016, All rights reserved. Table of Contents Preface...1 Conventions Used in This Guide...1 Where to Find Information...1 Technical Support...2 Feedback...2 Chapter 1
Software Reference Manual June, 2015 revision 3.1
 Software Reference Manual June, 2015 revision 3.1 Innovations Foresight 2015 Powered by Alcor System 1 For any improvement and suggestions, please contact customerservice@innovationsforesight.com Some
IX1D v2 Instruction Manual. Version 1.0. Copyright 2008 Interpex Limited. All Rights Reserved. 12 February Interpex Limited. P.O.
 IX1D v2 Instruction Manual Version 1.0 Copyright 2008 Interpex Limited All Rights Reserved 12 February 2008 Interpex Limited P.O. Box 839 Golden, CO 80401 USA www.interpex.com Tel: 303 278 9124 Fax: 303
Using Annotation Sets Part 3 TIP TUTORIAL. Using Annotation Sets Part 3
 TIP TUTORIAL Using Annotation Sets Part 3 INTRODUCTION In Annotation Sets Part 3 you will learn how to work with annotation sets. An annotation set is basically a collection of defaults and layers, which
Tutorial 3. Correlated Random Hydraulic Conductivity Field
 Tutorial 3 Correlated Random Hydraulic Conductivity Field Table of Contents Objective. 1 Step-by-Step Procedure... 2 Section 1 Generation of Correlated Random Hydraulic Conductivity Field 2 Step 1: Open
GUIDE TO View3D. Introduction to View3D
 View3D Guide Introduction to View3D... 1 Starting Hampson-Russell Software... 2 Starting View3D... 4 A Brief Summary of the View3D Process... 8 Loading the Seismic and Horizon Data... 8 Viewing the Data...
Creating and Using a Database in Access 2007
 Objectives: Describe databases and database management systems Design a database to satisfy a collection of requirements Start Access Describe the features of the Access window Create a database Create
3. MODELING A THREE-PIPE INTERSECTION (3-D)
") 3. MODELING A THREE-PIPE INTERSECTION (3-D) This tutorial employs primitives that is, predefined GAMBIT modeling components and procedures. There are two types of GAMBIT primitives: Geometry Mesh Geometry
3. MODELING A THREE-PIPE INTERSECTION (3-D) This tutorial employs primitives that is, predefined GAMBIT modeling components and procedures. There are two types of GAMBIT primitives: Geometry Mesh Geometry
Operation Instructions for the KLA Tencor P-6 Surface Profilometer
 Operation Instructions for the KLA Tencor P-6 Surface Profilometer For Training please contact Dave Heemstra dheemstr@nd.edu Description: The P-6 offers complete high resolution 2D analysis of surface
ADARA DOWNHOLE TEMPERATURE UPLOADER USER S MANUAL
 ADARA DOWNHOLE TEMPERATURE UPLOADER USER S MANUAL Updated 7/9/99 Table of Contents Document Layout........................................ 1 Starting Adara.......................................... 2 Login
MobileScan3D. MobileScan3D PlugIn for Geomagic. By Steintek GmbH
 MobileScan3D PlugIn for Geomagic MobileScan3D V. 1.0 - Version February, 2006 For Geomagic Qualify 8 SR1 and subsequent releases For Geomagic Studio 8 and subsequent releases By Steintek GmbH Win3DS is
Lab 12: Sampling and Interpolation
 Lab 12: Sampling and Interpolation What You ll Learn: -Systematic and random sampling -Majority filtering -Stratified sampling -A few basic interpolation methods Data for the exercise are in the L12 subdirectory.
Oasis montaj How-To Guide. VOXI Earth Modelling - Running an Inversion Using Gradient Weighting
 Oasis montaj How-To Guide VOXI Earth Modelling - Running an Inversion Using Gradient Weighting The software described in this manual is furnished under license and may only be used or copied in accordance
Slicing. Slice multiple parts 13,0601,1489,1664(SP6P1)
") Slicing 13,0601,1489,1664(SP6P1) In this exercise, we will learn how to perform Slicing on multiple part. Slicing is the stage where the printing layers are set according to the printer definition or printing
Slicing 13,0601,1489,1664(SP6P1) In this exercise, we will learn how to perform Slicing on multiple part. Slicing is the stage where the printing layers are set according to the printer definition or printing
ADD A 3-D PIE CHART TO THE WORKBOOK
 ADD A 3-D PIE CHART TO THE WORKBOOK A pie chart is an easy way to show the relationship of items to the whole. In this exercise, you will be creating a Pie Chart that will show the relationship between
What should I know about the 3D Restoration module? Improvision Technical Note No. 142 Last updated: 28 June, 2000
 What should I know about the 3D Restoration module? Improvision Technical Note No. 142 Last updated: 28 June, 2000 Topic This technical note discusses some aspects of iterative deconvolution and how to
WinGLink. Geophysical interpretation software VERSION
 WinGLink Geophysical interpretation software VERSION 2.21.08 WinGLink geophysical interpretation software WinGLink Geophysical interpretation software Essential tools for data QC, processing, and modeling
JOANNEUM OT0608 refraction line : Smooth inversion vs. 1.5D XTV inversion :
 JOANNEUM OT0608 refraction line : Smooth inversion vs. 1.5D XTV inversion : OT0608 20% wavepath width, 20 WET iterations, RMS error 1.8 %, 1D-Gradient smooth initial model, Version 3.21 4 4 3 3 2 1 0 200
StickFont v2.12 User Manual. Copyright 2012 NCPlot Software LLC
 StickFont v2.12 User Manual Copyright 2012 NCPlot Software LLC StickFont Manual Table of Contents Welcome... 1 Registering StickFont... 3 Getting Started... 5 Getting Started... 5 Adding text to your
UC-win/Road/InRoads Data exchange plugin
 UC-win/Road/InRoads Data exchange plugin 1. Data exchange (InRoads UC-win/Road) Import InRoads data into UC-win/Road. 1 Select [Tools] -> [Import InRoads] in UC-win/Road. 2 Select file from [Add file].
BANNER 9 QUICK NAVIGATION GUIDE
 Application Navigator Application Navigator provides a single interface to navigate the Banner 9 JAVA pages. It is a tool that allows you to go back and forth between the current Banner forms and the new
3DReshaper Help 2017 MR1. 3DReshaper Beginner's Guide. Tank
 3DReshaper Beginner's Guide Tank 1 of 20 1 Introduction The Tank module is dedicated to tank analysis. It is aimed to above ground tanks, with vertical cylinder design, single shell, with or without roof.
D020 Statics in Magnetotellurics - Shift or Model?
 D020 Statics in Magnetotellurics - Shift or Model? W. Soyer* (WesternGeco-Geosystem), S. Hallinan (WesternGeco- Geosystem), R.L. Mackie (WesternGeco-Geosystem) & W. Cumming (Cumming Geoscience) SUMMARY
Panoramic Power. Deployment Tool User Guide. v 4.99
 Panoramic Power v 4.99 Copyright Notice Copyright 2015 Panoramic Power Ltd. All rights reserved. 2 Contents Overview... 4 Installing the Deployment Tool... 4 Launching the Deployment Tool... 4 Mapping
Etarmis. LITE User Guide
 LITE User Guide Contents Creating A New Personal Record 3 Changing A Password 6 Creating a Site Administrator 7 Deleting An Employee 8 Making A Correction 10 Deleting A Correction 12 Modifying A Booking
Prisma Public Manifest
 Prisma Public Manifest April 25, 2018 Important Upgrade Notice Use the Prefs -> System Update option to start the installation of the prisma_update_x.y.z.img update file. PRISMA units using version 3.10
Tutorial 2. Building a Database and Defining Table Relationships
 Tutorial 2 Building a Database and Defining Table Relationships Microsoft Access 2010 Objectives Learn the guidelines for designing databases and setting field properties Modify the format of a field in
EMERGE Workflow CE8R2 SAMPLE IMAGE. Simon Voisey Hampson-Russell London Office
 EMERGE Workflow SAMPLE IMAGE CE8R2 Simon Voisey Hampson-Russell London Office August 2008 Introduction The document provides a step-by-step guide for producing Emerge-predicted petrophysical p volumes
EMIGMA Premium and Professional editions
 EMIGMA Premium and Professional editions EMIGMA Overview EMIGMA Database Version Database Design Objectives Reduce user s time required for modelling and data analyses Enhance data analyses capabilities
Modify Panel. Flatten Tab
 AFM Image Processing Most images will need some post acquisition processing. A typical procedure is to: i) modify the image by flattening, using a planefit, and possibly also a mask, ii) analyzing the
User s guide. November LSE S.r.l. All rights reserved
 User s guide November 2015 2015 LSE S.r.l. All rights reserved WARNING In writing this manual every care has been taken to offer the most updated, correct and clear information possible; however unwanted
DECONFLICTION AND SURFACE GENERATION FROM BATHYMETRY DATA USING LR B- SPLINES
 DECONFLICTION AND SURFACE GENERATION FROM BATHYMETRY DATA USING LR B- SPLINES IQMULUS WORKSHOP BERGEN, SEPTEMBER 21, 2016 Vibeke Skytt, SINTEF Jennifer Herbert, HR Wallingford The research leading to these