Structural Equation Modelling Miles, Jeremy Veröffentlichungsversion / Published Version Zeitschriftenartikel / journal article
|
|
|
- Meredith Reynolds
- 5 years ago
- Views:
Transcription

, 3, pp. 159-171. DOI: http:// dx.doi.org/10.12759/hsr.23.1998.3.159-171 Nutzungsbedingungen: Dieser Text wird unter einer CC BY-NC Lizenz (Namensnennung- Nicht-kommerziell) zur Verfügung gestellt.")
1 Structural Equation Modelling Miles, Jeremy Veröffentlichungsversion / Published Version Zeitschriftenartikel / journal article Zur Verfügung gestellt in Kooperation mit / provided in cooperation with: GESIS - Leibniz-Institut für Sozialwissenschaften Empfohlene Zitierung / Suggested Citation: Miles, Jeremy: Structural Equation Modelling. In: Historical Social Research 23 (1998), 3, pp DOI: dx.doi.org/ /hsr Nutzungsbedingungen: Dieser Text wird unter einer CC BY-NC Lizenz (Namensnennung- Nicht-kommerziell) zur Verfügung gestellt. Nähere Auskünfte zu den CC-Lizenzen finden Sie hier: Terms of use: This document is made available under a CC BY-NC Licence (Attribution-NonCommercial). For more Information see: Diese Version ist zitierbar unter / This version is citable under:
2 METHODS: SOFTWARE, REVIEWS, NOTICES Structural Equation Modelling Jeremy Miles * Abstract: Structural Equation Modelling (SEM) is a relatively recently developed statistical technique based upon factor analysis and multiple regression. This review will cover four of the most widely used (in psychology departments) packages, looking in particular at their suitability for use in a teaching environment, rather than an in depth look at their technical capabilities: LISREL 8.20, EQS 5.6, AMOS 3.6, SEPath. The four programs reviewed were all tested running Windows 95, on a 166 MHz Pentium, with 32 MB RAM. Introduction When using what might be termed "traditional" statistics data are explored, and relationships tested, to derive a model. When using SEM a model is hypothesised, and the ability of the model to have produced the data is tested. Most commonly the result of that test is a Χ 2 value, which gives a probability value for a test of equality between the data and the model. A non-significant value is usually sought, as this means that no significant difference exists between the data and the model, and the model is not therefore rejected. Recently SEM has seen a surge in popularity in psychology both internationally, and in the UK (Tremblay and Gardner, 1996). This has arisen for two reasons, firstly due to recognition of the capabilities and advantages of using an SEM approach, secondly, and possibly more importantly is the availability of user friendly software. Alongside this increase in popularity is an increase in the number of psychology departments that are offering courses in * Address all communications to Jeremy Miles, Applied Vision Research Unit, University of Derby, DE3 5GX, UK. First published in Psychology Software News, Vol. 8, No. 2, 1998, pp
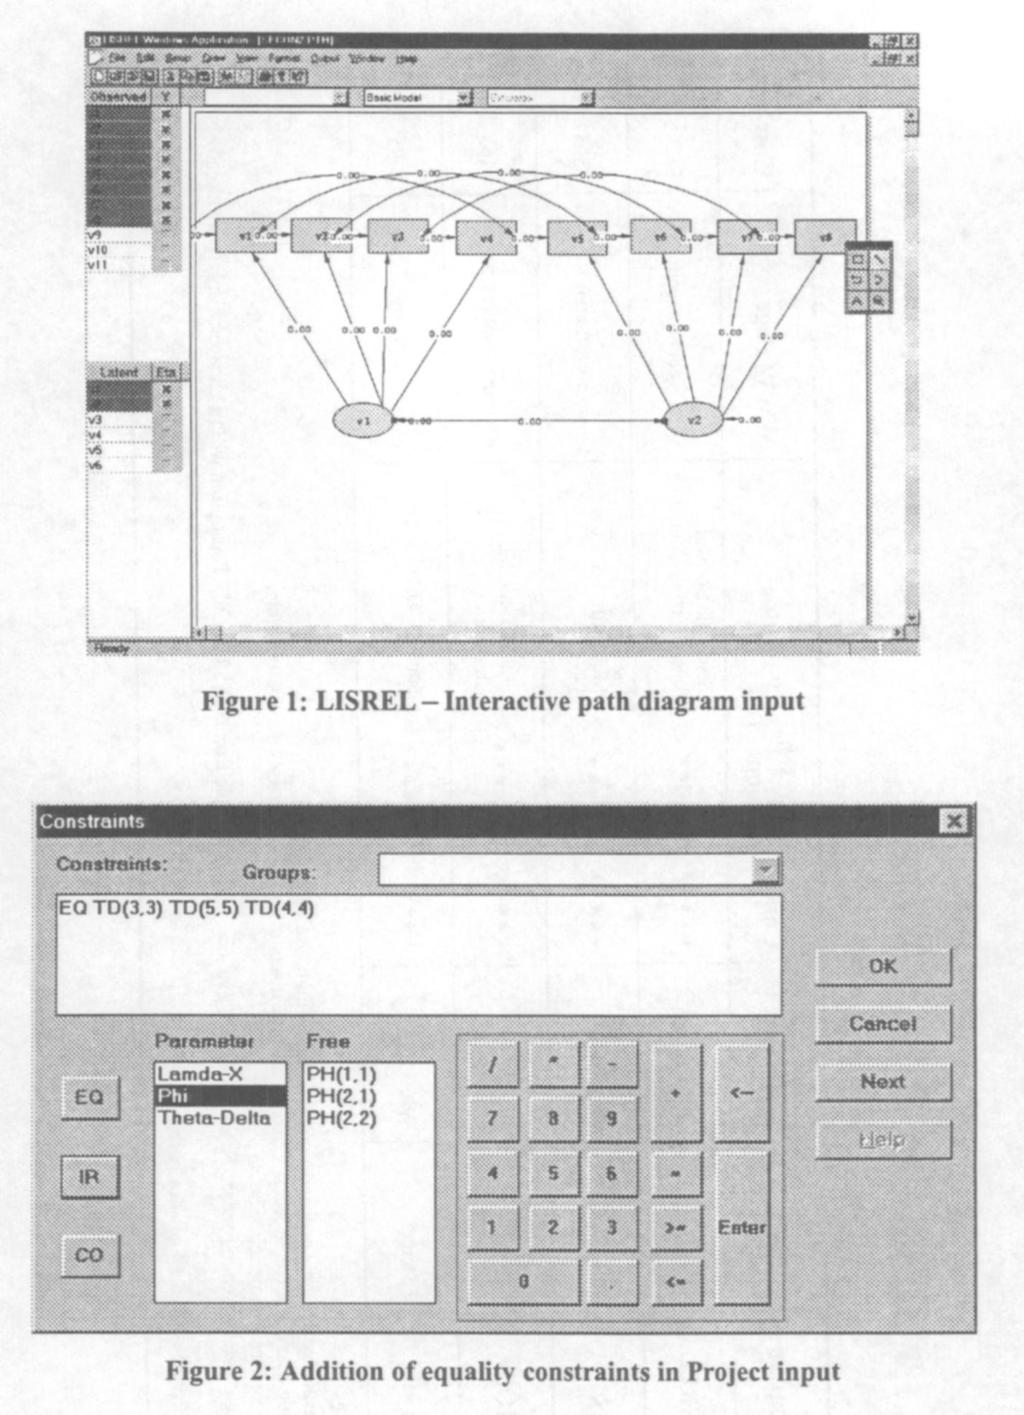
3 SEM, or have SEM included in courses on statistical analysis, both at an undergraduate, and a postgraduate level. LISREL 8.20 LISREL (Linear Structural Relationships), written by Joreskog and Sorbom, has been around for longer than most other SEM programs, and version 8.20 was released in January, LISREL is backed up with extensive documentation on Scientific Software's web pages. Look and Feel The latest version of LISREL (LISREL-Interactive) is a considerable change for anyone familiar with older versions of LISREL. LISREL comes with two programs, LISREL and PRELIS (PRE-Processor for LISREL). Prelis is used for screening data, and creating the appropriate correlation, covariance and weight matrices. Both LISREL and PRELIS have undergone considerable changes since their previous releases. This review will focus mainly on LISREL, as this is the program that students have the greater trouble learning, and spend longer actually using. In early versions, there was only one way to enter a LISREL model - using LISREL syntax. Even the greatest enthusiast of LISREL syntax would admit that it has a reasonably steep learning curve. The model is estimated by manipulating the elements of 8 matrices, each referred to with a Greek letter (Λ x, Λ y, Θ σ, Θ, Φ, Ψ, Γ and B), to estimate means two additional matrices are required (τ and κ). The LISREL language has two major advantages. Firstly, it is very parsimonious - a model can be written, and communicated, using very little syntax. It is also the most common language for books and technical articles to use. More recently a second language was added to LISREL, called SIMPLIS (SIMple LISREL). This is a much simpler language, in which the individual equations are specified, rather than the matrix elements, much as in EQS. This language is much simpler for the beginner to learn, and is also featured in at least one book designed for those learning SEM (Schumacker and Lomax, 1996). When carrying out analysis using previous versions of LISREL, the data were never seen, LISREL was told where the file that contains the data was to be found. This could be a problem for students, used to Windows based, spreadsheet-like statistics packages, who, when they asked "How do I open the data?" did not like the answer "You don't." This latest version of LISREL features a spreadsheet like window, which opens, and views the data. This version of LISREL implements two new methods of model input. The project and the path diagram. Path diagram input is done via a drawing. Variables are dragged from the side bar, and paths drawn in between them. Additional aspects of the model are set up using menu commands. The path diagram input is shown in Figure 1 (all Figures are listed in the Appendix), the 160
4 bar on the left contains variables, which are dragged onto the diagram, the floating menu on the right contains paths, which are drawn onto the diagram. Project input is similar to the path diagram input, with the exception that the model is input using menus and dialog boxes. The student is taken through the steps in building a model, and prompted for the aspect of the model which is required. Figure 2 shows the dialog box for the addition of equality constraints. Both input types are much easier for the beginner to understand, and learn, than LISREL or SIMPLIS syntax (although it does take considerably longer to input a model). When a button is clicked the program produces the syntax from the project or path diagram, which can be in either LISREL or SIMPLIS, enabling the learner to gain an understanding of the syntax. The output from LISREL consists of a text file, and a path diagram of the model, if requested. The path diagram is a very useful tool for examining the specification of the model. The diagram can focus on the X-model, Y-model, structural model, or the basic mode, and can feature the parameter estimates, T-values, modification indices, or expected changes. This simplifies the task of ploughing through the syntax and extracting the correct information, for the learner. Features Until recently LISREL was lagging behind some of the other SEM programs in terms of features. This latest version corrects this, and puts LISREL back among the front runners. It has features for dealing with ordinal data, including polychoric correlations (with up to 15 categories), asymptotic distribution free estimation (ADF) estimation (also sometimes referred to as weighted least squares, WLS), and procedures for calculating mean differences amongst from ordinal data (see Joreskog, 1997). LISREL produces a range of fit indices, including four types of chi-square (including the Satorra-Bentler scaled chi-square), and now estimates non-normal standard errors. Overall LISREL was still the most popular program for carrying out SEM, but was beginning to fall back, due to competition from other programs, which were more user friendly and featured more recent innovations. This version of LISREL increases the features, and has vast improvements to the user friendliness. Users of previous versions will be pleased to find out that the program seems to be much less likely to crash than previous versions of LISREL, although the time taken to do the calculations does seem to have increased. EQS 5.6 EQS (pronounced "Ecks") is written by Peter Bentler, and is currently on version 5.6. (although a patch to upgrade to a beta version of 5.7 is available on the Multivariate Software Web pages). 161
5 Look and Feel The look and feel of EQS is similar to that of LISREL. A model can be entered using syntax, a path diagram, or via a path diagram. The syntax for EQS is very similar to the SIMPLIS syntax for LISREL. Each parameter to be estimated in the model is individually specified, as an equation. The menus take the user through the process of specifying the basic model, using point and click. More technical aspects, or modifications, such as equality constraints can then be added using further menu options. By using the menus the syntax is built up, in a very similar way to LISREL. Figure 3 shows the dialog box used to add inequality constraints in EQS. The path diagram builder works in a similar way to the menus. The basic model is produced, and then modifications are made via the menus. This writes a syntax file in much the same way as when the path diagram is built from the menus. The diagram drawing part of the package is shown in Figure 4. The toolbar on the left of Figure 4 is used to add features to the diagram, by clicking on a tool and then clicking on the diagram. Output is produced in the form of a text file, and can be exported to the diagram, to show parameter estimates on the path diagram. While the structure of the path diagram input and output, and the structure of the syntax files make EQS very user friendly, the EQS interface is slightly unusual. The help files are not standard Windows help files, but run using the help viewer supplied with EQS. Although this presents no problem when one has become used to it, it is a little disconcerting to find the help file not behaving as one expects. The actual calculations are carried out in a DOS window, which opens when a file is run. The DOS window must then be closed, and the file it has produced opened in EQS. Features Unlike other SEM packages, EQS is also capable of producing a range of other analyses (t-tests, ANOVA, factor analysis) and graphs to represent the data, this is useful, as it means that the package feels much more like a statistics package that people are used to dealing with. EQS features a range of procedures for dealing with ordinal and skewed data, including polychoric and polyserial correlation, ADF estimation and Satorra-Bentler scaled Χ 2 (which it refers to as robust). Overall The latest version of EQS is a powerful, and user-friendly package, sufficiently straightforward for beginners. The latest version seems to have overcome the stability problems that beset previous versions, I could not make this program crash. 162
6 AMOS 3.6 AMOS (Analysis of MOment Structures, written by Jim Arbuckle, is a relative newcomer to the SEM software scene. A student version is available, for free, from the SmallWaters WWW site. AMOS is also available as an additional module within SPSS for Windows. Look and Feel The data in AMOS are entered either as a separate text file, or, if the program is being used with SPSS, the data are taken directly from SPSS, incorporating their variable names. A model is entered in AMOS using either a path diagram, or syntax. The two sources of input are not linked in the same way as in LISREL and EQS - the path diagram does not write the syntax, it is the path diagram that functions as the syntax. The path diagram drawing part of the program is the slickest of all the packages reviewed here, and is shown in Figure 5. The toolbar on the left had side of the diagram is used to draw parts of the diagram. Icons on the buttons are fairly intuitive, and a description of the button appears in the title bar, when the mouse is held over the button. The lorry icon is used to move a part of the diagram, the rubber on the end of the pencil to erase, and the abacus to calculate. Additional commands are entered using what AMOS calls $ commands. These appear in a separate window, which is accessed via a toolbar in the drawing program. Figure 6 shows the $ command entering dialog box. The listing on the right contains all of the possible $ commands, and the window on the left contains those that have been selected. Double clicking an option in the list of string commands moved it to the window on the left. If a parameter is required (as in Siterations), an additional dialog box appears, requesting the required value. If a user is sufficiently familiar, the $ commands can be typed in, to increase the speed. Given the refinement of the input parts of the program, the output is a slight disappointment. This is not to say that it is any worse than EQS or LISREL, but merely no better. A text file is produced and displayed in a text window, much the same as in the other packages. Features AMOS does not have some of the procedures for handling ordinal data that LISREL and EQS do have. The supporting documentation states (very truthfully) that the procedures available in LISREL and EQS are problematic unless large samples are used. The AMOS WWW pages state that a future release of AMOS will incorporate a technique for dealing with ordered categorical data, and should be out in late AMOS has two features to make it stand out from other programs. The first feature is its bootstrapping capabilities. It automatically calculates bootstrap 163
7 confidence intervals, and bias-corrected intervals, these can be parametric or non-parametric. In addition, Bollen and Stine (1993) have showed that the % 2 estimates derived when bootstrapping is used are biased, and proposed a correction to this. AMOS is the only program to incorporate this correction. The second feature in AMOS is its handling of missing data. AMOS incorporates a Full Information Maximum Likelihood (FIML) estimation algorithm, for the analysis of missing data. This uses all of the information available, and provides unbiased parameter estimates. Overall AMOS is a slick, smooth program to use, with an intuitive and user friendly feel. It is a program that feels like it was designed to be used for teaching, and for people who are not necessarily knowledgeable in SEM techniques. SEPath SEPath is written by James Steiger, and available as part of the Statistica package, produced by StatSoft. Look and Feel The look and feel of SEPath is of a very smooth windows program. The program is part of a full statistics package (Statistica 6.0) which makes it feel familiar to people who are used to using something like SPSS. SEPath is the only package reviewed here which does not have a path diagram input function, the model is entered via syntax, or built via dialog boxes. The dialog boxes work so well that they are not really missed. Rather than having a sequence which must be followed to build a model, the dialogs are all accessed from one "Start-up Panel," and can be accessed in any order. One very useful feature, which is true of all the programs that make up the Statistica package, is that an OK button is never "greyed out." It is always possible to press OK, and if something has not been done, a warning will appear informing the user what needs to be done. This avoids the mysterious feeling one can get when you don't know what you haven't done, but you know the program needs some additional input. One of the input dialog boxes is shown in Figure 7, the path construction tool. The user selects two variables from the two boxes on the left, the type of path, from the radio buttons, and presses the add button to add the path to list on the right. The dialog boxes write syntax which is then run, but the syntax can be run directly from the "master" dialog box, without the user ever knowing that the syntax exists. The output from SEPath puts all of the other programs to shame. The other programs drop the results into one long text file, which is then "dead." Using one of the other packages reviewed here, if you find that you want some aspect 164
8 of output, but did not request it, the analysis must be re-run. This leads to a tendency to ask for everything you might want in the output, much of which turns out to be redundant. SEPath organises its output in much the same way that its input is organised. There is one central "master" control dialog, from which different parts of the output are requested. These are then displayed in dialog boxes. Figure 8 shows the main dialog box for the output, the buttons access additional output. (Some of the buttons are greyed out, because a covariance matrix was used as input, rather than raw data.) Features Like AMOS, SEPath does not calculate polychoric/polyserial correlations for ordered categorical data. Unlike all the other programs reviewed here SEPath also does not calculate modification indices (or any similar index, such as the Wald tests, given by EQS), however this is a deliberate decision to leave them out, as they are often abused (and it can be argued that they have no legitimate use). The main feature that makes SEPath stand out is in its calculation of standard errors when correlation matrices are analysed. Classical SEM statistical theory is based on the distributional properties of the elements of a covariance matrix. Unfortunately, covariance and correlation matrices have different distributional properties, so if you use theory based on a covariance matrix to analyse a correlation matrix, you can have problems (Cudeck, 1989). One can get around this by analysing covariance matrices, but if a covariance matrix is not available (such as when re-analysing published data - a useful learning experience), this is not possible. It is possible to get around this by "tweaking" the program, with some clever syntax, using non-linear equality constraints in LISREL or EQS, but it is not easy for the beginner. SEPath provides correct standard errors by default. Overall SEPath lacks some of the features of some of the other programs, but if these features are not needed by everyone, and so will probably not be missed. The fact that its input system is easy to use interface, and the fact that its output is second to none, make this a good choice for beginners, Concluding Remarks This generation of SEM programs represent a move from the sidelines of psychological research and analysis onto the mainstream. A few years ago SEM programs were obscure, difficult to use, hard to learn and (not surprisingly) rarely used. SEM programs tend to written by and associated with, a single author, and the program reflects the interests, and prejudices, of that author. This is still the case, each program excels in one aspect. LISREL in 165
9 the analysis of mean structures with ordinal data, EQS in the analysis of non-normal data, AMOS in missing data and bootstrapping, and SEPath in standard errors (and its lack of modification indices). Any of the programs here could be recommended for use in either a teaching or a research environment. They can all import a range of file types (including SPSS files), they all have similar features and all are fairly simple to use (given that SEM has a fairly steep initial learning curve at the best of times). One thing which does divide the programs are the number of books about them, and their use in published research. It seems from my very brief survey of the literature that most theoretical articles referring to SEM use LISREL specification and syntax. While this is not difficult to learn, if you understand the principles of SEM, it represents an additional step. Most introductory texts also use LISREL as an example, although EQS is catching up. A quick check in the Internet Bookshop ( revealed 8 books with LISREL in the title, 3 with EQS in the title, and none for either AMOS or SEPath. This review has necessarily only covered a small number of programs that are available for SEM, a very good source of information for other programs that are available is the SEMNET FAQ, maintained by Ed Rigdon, at Georgia State University, and available at References Bollen, K.A. and Stine, R.A. (1993). Bootstrapping goodness-of-fit measures in structural equation models. In K.A. Bollen and J.S. Long (Eds.J. Testing structural equation models. Thousand Oaks, CA: Sage. Cudeck, R. (1989). Analysis of correlation matrices using covariance structure models. Psychological Bulletin, 105, Joreskog, K.G. (1997, July). New features in LISREL Paper presented at the International Conference on Applied Statistics, Preddvor, Slovenia. Schumacker, R.E. and Lomax, R.G. (1996). Beginner's Guide to Structural Equation Modeling. Hillsdae, NJ: Erlbaum. Tremblay, T.F. and Gardner, R.C. (1996). On the growth of structural equation modelling in psychological journals. Structural Equation Modelling 3(2). 166
10
11


12 169

13 170

14 171
GETTING STARTED WITH THE STUDENT EDITION OF LISREL 8.51 FOR WINDOWS
 GETTING STARTED WITH THE STUDENT EDITION OF LISREL 8.51 FOR WINDOWS Gerhard Mels, Ph.D. mels@ssicentral.com Senior Programmer Scientific Software International, Inc. 1. Introduction The Student Edition
THE ANALYSIS OF CONTINUOUS DATA FROM MULTIPLE GROUPS
 THE ANALYSIS OF CONTINUOUS DATA FROM MULTIPLE GROUPS 1. Introduction In practice, many multivariate data sets are observations from several groups. Examples of these groups are genders, languages, political
Managing art history fuzzy dates : an application in historico-geographical authority Signore, Oreste; Bartoli, R.
 www.ssoar.info Managing art history fuzzy dates : an application in historico-geographical authority Signore, Oreste; Bartoli, R. Veröffentlichungsversion / Published Version Zeitschriftenartikel / journal
Supplementary Notes on Multiple Imputation. Stephen du Toit and Gerhard Mels Scientific Software International
 Supplementary Notes on Multiple Imputation. Stephen du Toit and Gerhard Mels Scientific Software International Part A: Comparison with FIML in the case of normal data. Stephen du Toit Multivariate data
lavaan: an R package for structural equation modeling
 lavaan: an R package for structural equation modeling Yves Rosseel Department of Data Analysis Belgium Modern Modeling Methods Conference May 22, 2012 University of Connecticut Yves Rosseel lavaan: an
Zur Verfügung gestellt in Kooperation mit / provided in cooperation with: GESIS - Leibniz-Institut für Sozialwissenschaften
 www.ssoar.info Finding and accessing the right archive and archival data : archival tools to support research and to make archives available to public Arathymou, Spyridoula Veröffentlichungsversion / Published
CLAREMONT MCKENNA COLLEGE. Fletcher Jones Student Peer to Peer Technology Training Program. Basic Statistics using Stata
 CLAREMONT MCKENNA COLLEGE Fletcher Jones Student Peer to Peer Technology Training Program Basic Statistics using Stata An Introduction to Stata A Comparison of Statistical Packages... 3 Opening Stata...
A Beginner's Guide to. Randall E. Schumacker. The University of Alabama. Richard G. Lomax. The Ohio State University. Routledge
 A Beginner's Guide to Randall E. Schumacker The University of Alabama Richard G. Lomax The Ohio State University Routledge Taylor & Francis Group New York London About the Authors Preface xv xvii 1 Introduction
Instructions for Using ABCalc James Alan Fox Northeastern University Updated: August 2009
 Instructions for Using ABCalc James Alan Fox Northeastern University Updated: August 2009 Thank you for using ABCalc, a statistical calculator to accompany several introductory statistics texts published
Converting the TheSoz to SKOS Zapilko, Benjamin; Sure, York Veröffentlichungsversion / Published Version Arbeitspapier / working paper
 www.ssoar.info Converting the TheSoz to SKOS Zapilko, Benjamin; Sure, York Veröffentlichungsversion / Published Version Arbeitspapier / working paper Zur Verfügung gestellt in Kooperation mit / provided
Using Amos For Structural Equation Modeling In Market Research
 Using Amos For Structural Equation Modeling In Market Research We have made it easy for you to find a PDF Ebooks without any digging. And by having access to our ebooks online or by storing it on your
Handling Your Data in SPSS. Columns, and Labels, and Values... Oh My! The Structure of SPSS. You should think about SPSS as having three major parts.
 Handling Your Data in SPSS Columns, and Labels, and Values... Oh My! You might think that simple intuition will guide you to a useful organization of your data. If you follow that path, you might find
Chapter 3. Bootstrap. 3.1 Introduction. 3.2 The general idea
 Chapter 3 Bootstrap 3.1 Introduction The estimation of parameters in probability distributions is a basic problem in statistics that one tends to encounter already during the very first course on the subject.
Ronald H. Heck 1 EDEP 606 (F2015): Multivariate Methods rev. November 16, 2015 The University of Hawai i at Mānoa
: Multivariate Methods rev. November 16, 2015 The University of Hawai i at Mānoa") Ronald H. Heck 1 In this handout, we will address a number of issues regarding missing data. It is often the case that the weakest point of a study is the quality of the data that can be brought to bear
Ronald H. Heck 1 In this handout, we will address a number of issues regarding missing data. It is often the case that the weakest point of a study is the quality of the data that can be brought to bear
A model for the integration of interactive visualizations into the process of information searching and linking on the Web Hienert, Daniel
 www.ssoar.info A model for the integration of interactive visualizations into the process of information searching and linking on the Web Hienert, Daniel Veröffentlichungsversion / Published Version Zeitschriftenartikel
MAXQDA and Chapter 9 Coding Schemes
 MAXQDA and Chapter 9 Coding Schemes Chapter 9 discusses how the structures of coding schemes, alternate groupings are key to moving forward with analysis. The nature and structures of the coding scheme
Fast, Easy, and Publication-Quality Ecological Analyses with PC-ORD
 Emerging Technologies Fast, Easy, and Publication-Quality Ecological Analyses with PC-ORD JeriLynn E. Peck School of Forest Resources, Pennsylvania State University, University Park, Pennsylvania 16802
Chapter One: Getting Started With IBM SPSS for Windows
 Chapter One: Getting Started With IBM SPSS for Windows Using Windows The Windows start-up screen should look something like Figure 1-1. Several standard desktop icons will always appear on start up. Note
Creating a data file and entering data
 4 Creating a data file and entering data There are a number of stages in the process of setting up a data file and analysing the data. The flow chart shown on the next page outlines the main steps that
STATISTICS (STAT) Statistics (STAT) 1
 Statistics (STAT) 1") Statistics (STAT) 1 STATISTICS (STAT) STAT 2013 Elementary Statistics (A) Prerequisites: MATH 1483 or MATH 1513, each with a grade of "C" or better; or an acceptable placement score (see placement.okstate.edu).
Statistics (STAT) 1 STATISTICS (STAT) STAT 2013 Elementary Statistics (A) Prerequisites: MATH 1483 or MATH 1513, each with a grade of "C" or better; or an acceptable placement score (see placement.okstate.edu).
Quick Start with CASSY Lab. Bi-05-05
 Quick Start with CASSY Lab Bi-05-05 About this manual This manual helps you getting started with the CASSY system. The manual does provide you the information you need to start quickly a simple CASSY experiment
Software Review: Ruby Tabulation Software
 Software Review: Ruby Tabulation Software Tags: Research Industry Software-Data Delivery Tools Software-Data Tabulation Data Processing Data Conversion Data Analysis Data Crosstabulation Data Collection
Conducting a Path Analysis With SPSS/AMOS
 Conducting a Path Analysis With SPSS/AMOS Download the PATH-INGRAM.sav data file from my SPSS data page and then bring it into SPSS. The data are those from the research that led to this publication: Ingram,
An introduction to SPSS
 An introduction to SPSS To open the SPSS software using U of Iowa Virtual Desktop... Go to https://virtualdesktop.uiowa.edu and choose SPSS 24. Contents NOTE: Save data files in a drive that is accessible
SAS Structural Equation Modeling 1.3 for JMP
 SAS Structural Equation Modeling 1.3 for JMP SAS Documentation The correct bibliographic citation for this manual is as follows: SAS Institute Inc. 2012. SAS Structural Equation Modeling 1.3 for JMP. Cary,
ANNOUNCING THE RELEASE OF LISREL VERSION BACKGROUND 2 COMBINING LISREL AND PRELIS FUNCTIONALITY 2 FIML FOR ORDINAL AND CONTINUOUS VARIABLES 3
 ANNOUNCING THE RELEASE OF LISREL VERSION 9.1 2 BACKGROUND 2 COMBINING LISREL AND PRELIS FUNCTIONALITY 2 FIML FOR ORDINAL AND CONTINUOUS VARIABLES 3 THREE-LEVEL MULTILEVEL GENERALIZED LINEAR MODELS 3 FOUR
Data analysis using Microsoft Excel
 Introduction to Statistics Statistics may be defined as the science of collection, organization presentation analysis and interpretation of numerical data from the logical analysis. 1.Collection of Data
PDF hosted at the Radboud Repository of the Radboud University Nijmegen
 PDF hosted at the Radboud Repository of the Radboud University Nijmegen The following full text is an author's version which may differ from the publisher's version. For additional information about this
John's Tutorial on Everyday Mathcad (Version 9/2/09) Mathcad is not the specialist's ultimate mathematical simulator
 Mathcad is not the specialist's ultimate mathematical simulator") John's Tutorial on Everyday Mathcad (Version 9/2/09) Mathcad isn't: Mathcad is not the specialist's ultimate mathematical simulator Applied mathematicians may prefer the power of Mathematica Complex programs
John's Tutorial on Everyday Mathcad (Version 9/2/09) Mathcad isn't: Mathcad is not the specialist's ultimate mathematical simulator Applied mathematicians may prefer the power of Mathematica Complex programs
Introduction to Structural Equation Modeling. using AMOS
 www.spss-pasw.ir Introduction to Structural Equation Modeling using AMOS Academic Computing and Instructional Technology Services UT-Austin 2 TABLE OF CONTENTS COURSE OBJECTIVES... 3 OVERVIEW...3 PREREQUISITES...3
Introduction to Mplus
 Introduction to Mplus May 12, 2010 SPONSORED BY: Research Data Centre Population and Life Course Studies PLCS Interdisciplinary Development Initiative Piotr Wilk piotr.wilk@schulich.uwo.ca OVERVIEW Mplus
SPSS Instructions and Guidelines PSCI 2300 Intro to Political Science Research Dr. Paul Hensel Last updated 10 March 2018
 SPSS Instructions and Guidelines PSCI 2300 Intro to Political Science Research Dr. Paul Hensel Last updated 10 March 2018 Table of Contents Introduction... 1 Accessing SPSS... 2 Possible Alternative: PSPP...
For many people, learning any new computer software can be an anxietyproducing
 1 Getting to Know Stata 12 For many people, learning any new computer software can be an anxietyproducing task. When that computer program involves statistics, the stress level generally increases exponentially.
Resource upload / download guide
 The Higher Education Academy / JISC Open Educational Resources Programme Resource upload / download guide Authors: Liam Comerford, John Connor Date: 12/04/2010 Version: 2 This guide helps talk you through
IST Computational Tools for Statistics I. DEÜ, Department of Statistics
 IST 1051 Computational Tools for Statistics I 1 DEÜ, Department of Statistics Course Objectives Computational Tools for Statistics-I course can increase the understanding of statistics and helps to learn
LISREL 8.54: A PROGRAM FOR STRUCTURAL EQUATION MODELLING WITH LATENT VARIABLES DARIO CZIRÁKY*
 JOURNAL OF APPLIED ECONOMETRICS J. Appl. Econ. : 0 (00) Published online in Wiley InterScience (www.interscience.wiley.com). DOI: 0.00/jae. JAE 0 0 LISREL.: A PROGRAM FOR STRUCTURAL EQUATION MODELLING
Latent Curve Models. A Structural Equation Perspective WILEY- INTERSCIENΠKENNETH A. BOLLEN
 Latent Curve Models A Structural Equation Perspective KENNETH A. BOLLEN University of North Carolina Department of Sociology Chapel Hill, North Carolina PATRICK J. CURRAN University of North Carolina Department
Research Methods for Business and Management. Session 8a- Analyzing Quantitative Data- using SPSS 16 Andre Samuel
 Research Methods for Business and Management Session 8a- Analyzing Quantitative Data- using SPSS 16 Andre Samuel A Simple Example- Gym Purpose of Questionnaire- to determine the participants involvement
How to Use a Statistical Package
 APPENDIX D How to Use a Statistical Package Candace M. Evans, Lisa M. Gilman, Jeffrey Xavier, Joan Saxton Weber Computers and statistical software such as the Statistical Package for the Social Sciences
Excel Primer CH141 Fall, 2017
 Excel Primer CH141 Fall, 2017 To Start Excel : Click on the Excel icon found in the lower menu dock. Once Excel Workbook Gallery opens double click on Excel Workbook. A blank workbook page should appear
Annotated multitree output
 Annotated multitree output A simplified version of the two high-threshold (2HT) model, applied to two experimental conditions, is used as an example to illustrate the output provided by multitree (version
Structural Equation Modeling using AMOS: An Introduction
 Structural Equation Modeling using AMOS: An Introduction Section 1: Introduction... 2 1.1 About this Document/Prerequisites... 2 1.2 Accessing AMOS... 2 1.3 Documentation... 3 1.4 Getting Help with AMOS...
the NXT-G programming environment
 2 the NXT-G programming environment This chapter takes a close look at the NXT-G programming environment and presents a few simple programs. The NXT-G programming environment is fairly complex, with lots
How to Use a Statistical Package
 APPENDIX F How to Use a Statistical Package With the assistance of Lisa M. Gilman and Jeffrey Xavier and with contributions by Joan Saxton Weber Computers and statistical software such as the Statistical
Statistical Good Practice Guidelines. 1. Introduction. Contents. SSC home Using Excel for Statistics - Tips and Warnings
 Statistical Good Practice Guidelines SSC home Using Excel for Statistics - Tips and Warnings On-line version 2 - March 2001 This is one in a series of guides for research and support staff involved in
JMP Book Descriptions
 JMP Book Descriptions The collection of JMP documentation is available in the JMP Help > Books menu. This document describes each title to help you decide which book to explore. Each book title is linked
Introduction (SPSS) Opening SPSS Start All Programs SPSS Inc SPSS 21. SPSS Menus
 Opening SPSS Start All Programs SPSS Inc SPSS 21. SPSS Menus") Introduction (SPSS) SPSS is the acronym of Statistical Package for the Social Sciences. SPSS is one of the most popular statistical packages which can perform highly complex data manipulation and analysis
Introduction (SPSS) SPSS is the acronym of Statistical Package for the Social Sciences. SPSS is one of the most popular statistical packages which can perform highly complex data manipulation and analysis
An introduction to plotting data
 An introduction to plotting data Eric D. Black California Institute of Technology February 25, 2014 1 Introduction Plotting data is one of the essential skills every scientist must have. We use it on a
DEPRESS.PSF DEPRESS.PSF TUTORIAL DEPRESS.PSF PSF
 Instruction to Run Confirmatory Factor Analysis = CFA Data The data set contains 204 observations of 12 continuous variables. The 12 variables are indicators of the latent variables Self-esteem, Depression
Computers and statistical software such as the Statistical Package for the Social Sciences (SPSS) make complex statistical
 make complex statistical") Appendix C How to Use a Statistical Package With The Assistance of Lisa M. Gilman and with Contributions By Joan Saxton Weber Computers and statistical software such as the Statistical Package for the
Appendix C How to Use a Statistical Package With The Assistance of Lisa M. Gilman and with Contributions By Joan Saxton Weber Computers and statistical software such as the Statistical Package for the
Logger Pro 3. Quick Reference
 Logger Pro 3 Quick Reference Getting Started Logger Pro Requirements To use Logger Pro, you must have the following equipment: Windows 98, 2000, ME, NT, or XP on a Pentium processor or equivalent, 133
How to use FSBforecast Excel add in for regression analysis
 How to use FSBforecast Excel add in for regression analysis FSBforecast is an Excel add in for data analysis and regression that was developed here at the Fuqua School of Business over the last 3 years
Using Large Data Sets Workbook Version A (MEI)
") Using Large Data Sets Workbook Version A (MEI) 1 Index Key Skills Page 3 Becoming familiar with the dataset Page 3 Sorting and filtering the dataset Page 4 Producing a table of summary statistics with
Using Large Data Sets Workbook Version A (MEI) 1 Index Key Skills Page 3 Becoming familiar with the dataset Page 3 Sorting and filtering the dataset Page 4 Producing a table of summary statistics with
Getting Started COPYRIGHTED MATERIAL. Chapter 1. Exploring the AutoCAD 2013 for Windows User Interface. Exploring the Graphical User Interface
 Getting Started Chapter 1 P AutoCAD for Mac has a user interface that is customized to the Mac experience. Although the Mac user interface is not covered in this book, its commands and capabilities are
Introduction to Mixed Models: Multivariate Regression
 Introduction to Mixed Models: Multivariate Regression EPSY 905: Multivariate Analysis Spring 2016 Lecture #9 March 30, 2016 EPSY 905: Multivariate Regression via Path Analysis Today s Lecture Multivariate
RKWard: IRT analyses and person scoring with ltm
 Software Corner Software Corner: RKWard: IRT analyses and person scoring with ltm Aaron Olaf Batty abatty@sfc.keio.ac.jp Keio University Lancaster University In SRB 16(2), I introduced the ever-improving,
Statistical Analysis of List Experiments
 Statistical Analysis of List Experiments Kosuke Imai Princeton University Joint work with Graeme Blair October 29, 2010 Blair and Imai (Princeton) List Experiments NJIT (Mathematics) 1 / 26 Motivation
STATS PAD USER MANUAL
 STATS PAD USER MANUAL For Version 2.0 Manual Version 2.0 1 Table of Contents Basic Navigation! 3 Settings! 7 Entering Data! 7 Sharing Data! 8 Managing Files! 10 Running Tests! 11 Interpreting Output! 11
Statistical Package for the Social Sciences INTRODUCTION TO SPSS SPSS for Windows Version 16.0: Its first version in 1968 In 1975.
 Statistical Package for the Social Sciences INTRODUCTION TO SPSS SPSS for Windows Version 16.0: Its first version in 1968 In 1975. SPSS Statistics were designed INTRODUCTION TO SPSS Objective About the
How to Use a Statistical Package
 E App-Bachman-45191.qxd 1/31/2007 3:32 PM Page E-1 A P P E N D I X E How to Use a Statistical Package WITH THE ASSISTANCE OF LISA M. GILMAN AND WITH CONTRIBUTIONS BY JOAN SAXTON WEBER Computers and statistical
NORM software review: handling missing values with multiple imputation methods 1
 METHODOLOGY UPDATE I Gusti Ngurah Darmawan NORM software review: handling missing values with multiple imputation methods 1 Evaluation studies often lack sophistication in their statistical analyses, particularly
Example Using Missing Data 1
 Ronald H. Heck and Lynn N. Tabata 1 Example Using Missing Data 1 Creating the Missing Data Variable (Miss) Here is a data set (achieve subset MANOVAmiss.sav) with the actual missing data on the outcomes.
An Introduction to Growth Curve Analysis using Structural Equation Modeling
 An Introduction to Growth Curve Analysis using Structural Equation Modeling James Jaccard New York University 1 Overview Will introduce the basics of growth curve analysis (GCA) and the fundamental questions
Some (semi-)advanced tips for LibreOffice
advanced tips for LibreOffice") Some (semi-)advanced tips for LibreOffice by Andy Pepperdine Introduction We cover several tips on special things in Writer and Calc and anything else that turns up. Although I use LibreOffice, these should
Some (semi-)advanced tips for LibreOffice by Andy Pepperdine Introduction We cover several tips on special things in Writer and Calc and anything else that turns up. Although I use LibreOffice, these should
8. MINITAB COMMANDS WEEK-BY-WEEK
 8. MINITAB COMMANDS WEEK-BY-WEEK In this section of the Study Guide, we give brief information about the Minitab commands that are needed to apply the statistical methods in each week s study. They are
What s New in Spotfire DXP 1.1. Spotfire Product Management January 2007
 What s New in Spotfire DXP 1.1 Spotfire Product Management January 2007 Spotfire DXP Version 1.1 This document highlights the new capabilities planned for release in version 1.1 of Spotfire DXP. In this
CHAPTER 1 COPYRIGHTED MATERIAL. Finding Your Way in the Inventor Interface
 CHAPTER 1 Finding Your Way in the Inventor Interface COPYRIGHTED MATERIAL Understanding Inventor s interface behavior Opening existing files Creating new files Modifying the look and feel of Inventor Managing
Comparing different interpolation methods on two-dimensional test functions
 Comparing different interpolation methods on two-dimensional test functions Thomas Mühlenstädt, Sonja Kuhnt May 28, 2009 Keywords: Interpolation, computer experiment, Kriging, Kernel interpolation, Thin
User Services Spring 2008 OBJECTIVES Introduction Getting Help Instructors
 User Services Spring 2008 OBJECTIVES Use the Data Editor of SPSS 15.0 to to import data. Recode existing variables and compute new variables Use SPSS utilities and options Conduct basic statistical tests.
Creating and Managing Surveys
 S Computing Services Department Creating and Managing Surveys Select Survey Apr 2016 Page 0 of 27 U n i v e r s i t y o f L i v e r p o o l Table of Contents 1. Introduction... 2 2. How to Access the Survey
The first thing we ll need is some numbers. I m going to use the set of times and drug concentration levels in a patient s bloodstream given below.
 Graphing in Excel featuring Excel 2007 1 A spreadsheet can be a powerful tool for analyzing and graphing data, but it works completely differently from the graphing calculator that you re used to. If you
Abacus Evolve I Planner Framework Edition Framework Edition V2.0 installation
 Abacus Evolve I Planner Framework Edition Framework Edition V2.0 installation Please read before you proceed with the installation of Abacus Evolve I Planner Framework Edition. These instructions are written
PRI Workshop Introduction to AMOS
 PRI Workshop Introduction to AMOS Krissy Zeiser Pennsylvania State University klz24@pop.psu.edu 2-pm /3/2008 Setting up the Dataset Missing values should be recoded in another program (preferably with
Mr. Kongmany Chaleunvong. GFMER - WHO - UNFPA - LAO PDR Training Course in Reproductive Health Research Vientiane, 22 October 2009
 Mr. Kongmany Chaleunvong GFMER - WHO - UNFPA - LAO PDR Training Course in Reproductive Health Research Vientiane, 22 October 2009 1 Object of the Course Introduction to SPSS The basics of managing data
Math 395 Homework #1 Due Wednesday, April 12
 Math 395 Homework #1 Due Wednesday, April 12 LaTex is a typesetting system that is widely used by mathematicians. It has the ability to typeset just about any mathematical notation, as well as complex
INTRODUCTION to. Program in Statistics and Methodology (PRISM) Daniel Blake & Benjamin Jones January 15, 2010
 Daniel Blake & Benjamin Jones January 15, 2010") INTRODUCTION to Program in Statistics and Methodology (PRISM) Daniel Blake & Benjamin Jones January 15, 2010 While we are waiting Everyone who wishes to work along with the presentation should log onto
INTRODUCTION to Program in Statistics and Methodology (PRISM) Daniel Blake & Benjamin Jones January 15, 2010 While we are waiting Everyone who wishes to work along with the presentation should log onto
JMP Chong Ho
 JMP Interface: ipod of statistical software Chong Ho Yu, Ph.D. (2012) cyu@apu.edu www.creative wisdom.com JMP is software package created by SAS Institute for data visualization and exploratory data analysis.
Performance of Latent Growth Curve Models with Binary Variables
 Performance of Latent Growth Curve Models with Binary Variables Jason T. Newsom & Nicholas A. Smith Department of Psychology Portland State University 1 Goal Examine estimation of latent growth curve models
STATA 13 INTRODUCTION
 STATA 13 INTRODUCTION Catherine McGowan & Elaine Williamson LONDON SCHOOL OF HYGIENE & TROPICAL MEDICINE DECEMBER 2013 0 CONTENTS INTRODUCTION... 1 Versions of STATA... 1 OPENING STATA... 1 THE STATA
Special review: Evaluation of the exploratory factor analysis programs provided in SPSSX and SPSS/PC+
 Bond University From the SelectedWorks of Gregory J. Boyle 1993 Special review: Evaluation of the exploratory factor analysis programs provided in SPSSX and SPSS/PC+ Gregory J. Boyle, University of Queensland
Multilevel generalized linear modeling
 Multilevel generalized linear modeling 1. Introduction Many popular statistical methods are based on mathematical models that assume data follow a normal distribution. The most obvious among these are
MODERN DESCRIPTIVE GEOMETRY SUPPORTED BY 3D COMPUTER MODELLING
 International Conference on Mathematics Textbook Research and Development 2014 () 29-31 July 2014, University of Southampton, UK MODERN DESCRIPTIVE GEOMETRY SUPPORTED BY 3D COMPUTER MODELLING Petra Surynková
CHAPTER 1 INTRODUCTION
 Introduction CHAPTER 1 INTRODUCTION Mplus is a statistical modeling program that provides researchers with a flexible tool to analyze their data. Mplus offers researchers a wide choice of models, estimators,
Creating and Managing Surveys
 Creating and Managing Surveys May 2014 Survey Software Contents 1. INTRODUCTION 2 2. HOW TO ACCESS THE SURVEY SOFTWARE 3 The User Profile 3 3. GETTING STARTED ON A NEW SURVEY 5 4. FURTHER WORK ON SURVEY
Azon Master Class. By Ryan Stevenson Guidebook #5 WordPress Usage
 Azon Master Class By Ryan Stevenson https://ryanstevensonplugins.com/ Guidebook #5 WordPress Usage Table of Contents 1. Widget Setup & Usage 2. WordPress Menu System 3. Categories, Posts & Tags 4. WordPress
CHAPTER 7 EXAMPLES: MIXTURE MODELING WITH CROSS- SECTIONAL DATA
 Examples: Mixture Modeling With Cross-Sectional Data CHAPTER 7 EXAMPLES: MIXTURE MODELING WITH CROSS- SECTIONAL DATA Mixture modeling refers to modeling with categorical latent variables that represent
Creating a Survey on Google Drive
 Creating a Survey on Google Drive It's easy to create a survey instrument on Google Drive (formerly called Google Docs). It has some distinct advantages over other free web-based survey services, such
Study Guide. Module 1. Key Terms
 Study Guide Module 1 Key Terms general linear model dummy variable multiple regression model ANOVA model ANCOVA model confounding variable squared multiple correlation adjusted squared multiple correlation
Frequently Asked Questions Updated 2006 (TRIM version 3.51) PREPARING DATA & RUNNING TRIM
 PREPARING DATA & RUNNING TRIM") Frequently Asked Questions Updated 2006 (TRIM version 3.51) PREPARING DATA & RUNNING TRIM * Which directories are used for input files and output files? See menu-item "Options" and page 22 in the manual.
Frequently Asked Questions Updated 2006 (TRIM version 3.51) PREPARING DATA & RUNNING TRIM * Which directories are used for input files and output files? See menu-item "Options" and page 22 in the manual.
LISREL 10.1 RELEASE NOTES 2 1 BACKGROUND 2 2 MULTIPLE GROUP ANALYSES USING A SINGLE DATA FILE 2
 LISREL 10.1 RELEASE NOTES 2 1 BACKGROUND 2 2 MULTIPLE GROUP ANALYSES USING A SINGLE DATA FILE 2 3 MODELS FOR GROUPED- AND DISCRETE-TIME SURVIVAL DATA 5 4 MODELS FOR ORDINAL OUTCOMES AND THE PROPORTIONAL
An Introduction to the R Commander
 An Introduction to the R Commander BIO/MAT 460, Spring 2011 Christopher J. Mecklin Department of Mathematics & Statistics Biomathematics Research Group Murray State University Murray, KY 42071 christopher.mecklin@murraystate.edu
2) familiarize you with a variety of comparative statistics biologists use to evaluate results of experiments;
 familiarize you with a variety of comparative statistics biologists use to evaluate results of experiments;") A. Goals of Exercise Biology 164 Laboratory Using Comparative Statistics in Biology "Statistics" is a mathematical tool for analyzing and making generalizations about a population from a number of individual
A. Goals of Exercise Biology 164 Laboratory Using Comparative Statistics in Biology "Statistics" is a mathematical tool for analyzing and making generalizations about a population from a number of individual
RAM JAYAM VIDYAA MANDIR MATRIC HR SEC SCHOOL. Cumbum. Theni district. 1 D.EASWARAN M.Sc B.Ed Computer Instructor RJMS_SCHOOL.
 RAM JAYAM VIDYAA MANDIR MATRIC HR SEC SCHOOL. Cumbum. Theni district. D.Easwaran M.sc B.ed Computer Instructor RJMS School. Cumbum THENI DISTRICT. CELL : 8760324704 1 Higher Secondary First Year Study
Product Catalog. AcaStat. Software
 Product Catalog AcaStat Software AcaStat AcaStat is an inexpensive and easy-to-use data analysis tool. Easily create data files or import data from spreadsheets or delimited text files. Run crosstabulations,
Tutorial Session -- Semi-variograms
 Tutorial Session -- Semi-variograms The example session with PG2000 which is described below is intended as an example run to familiarise the user with the package. This documented example illustrates
- 1 - Fig. A5.1 Missing value analysis dialog box
 WEB APPENDIX Sarstedt, M. & Mooi, E. (2019). A concise guide to market research. The process, data, and methods using SPSS (3 rd ed.). Heidelberg: Springer. Missing Value Analysis and Multiple Imputation
Week 5: Multiple Linear Regression II
 Week 5: Multiple Linear Regression II Marcelo Coca Perraillon University of Colorado Anschutz Medical Campus Health Services Research Methods I HSMP 7607 2017 c 2017 PERRAILLON ARR 1 Outline Adjusted R
Classroom Tips and Techniques: Least-Squares Fits. Robert J. Lopez Emeritus Professor of Mathematics and Maple Fellow Maplesoft
 Introduction Classroom Tips and Techniques: Least-Squares Fits Robert J. Lopez Emeritus Professor of Mathematics and Maple Fellow Maplesoft The least-squares fitting of functions to data can be done in
jmetrik 2.1 What is jmetrik? Obtaining and installing the software Formatting and importing your data
 Software Corner jmetrik 2.1 Aaron Olaf Batty abatty@sfc.keio.ac.jp Keio University Many researchers are curious about Rasch analysis and would like to try it with their own data, and most have a need for
TrussMaster: Educational Truss Analysis Software Version 3 User Manual Dublin Institute of Technology, Ireland
 TrussMaster: Educational Truss Analysis Software Version 3 User Manual Dublin Institute of Technology, Ireland 1 Acknowledgements This program has been developed over 10 years from 2001 by Dr Colin Caprani.