Creating Basic Custom Monitoring Dashboards by
|
|
|
- Jason Williams
- 6 years ago
- Views:
Transcription
1 Creating Basic Custom Monitoring Dashboards by Antonio Mangiacotti, Stefania Oliverio, Randy Allen & Lanny Short v1.2 1
2 Contents Contents... 2 Introduction... 3 ITM and DASH Configuration... 4 ITM TEPS configuration... 4 Setting up your dashboard environment... 4 IBM Performance Management and DASH Configuration... 8 Checking for the Performance Management Dashboard Data Provider Availability... 8 Working with Pages - Creating, Adding and Editing Widgets Creating a page Adding widgets to a page Editing a widget and specifying a dataset Edit an existing page Create connections between widgets on a page Creating sample pages using the monitoring tooling dashboard data provider supported widgets Common settings and parameters Pie chart widget Bar chart widget Column chart widget Gauge widgets Volume bar widget Table widget
3 Introduction With the release of IBM Tivoli Monitoring 6.3, IBM Performance Management 8.1.1, and the IBM Dashboard Application Services Hub (DASH), administrative users can create customized performance monitoring dashboard pages using the DASH widgets and performance monitoring data from the following data providers: IBM Tivoli Monitoring dashboard data provider, a component of the Tivoli Enterprise Portal Server (TEPS), retrieves data from Tivoli monitoring agents for presentation in dashboard widgets. IBM Performance Management data provider, a component of the Performance Management server, retrieves data from Performance Management monitoring agents for presentation in dashboard widgets. Custom monitoring dashboards are available through DASH for users to create their own pages, charts and tables from the Tivoli Widget Library (TWL). 3
4 ITM and DASH Configuration These steps assume that IBM Tivoli Monitoring (ITM) and IBM Dashboard Application Services Hub (DASH) have already been installed and are running correctly. To enable ITM supported widgets on DASH the following configuration steps need to be completed. ITM TEPS configuration Configure the TEPS dashboard data provider: Configuring the TEPS to enable the dashboard data provider on Linux/UNIX: 1. Reconfigure the TEPS by running the command: $CANDLE_HOME/bin/itmcmd config A cq 2. When you get to the question Enable the dashboard data provider? Answer 1 for yes to the question. 3. Once configuration completes restart the TEPS to make changes effective Configuring the TEPS to enable the dashboard data provider on Windows: 1. Click Start Programs IBM Tivoli Monitoring Manage Tivoli Enterprise Monitoring Services. 2. Right-click Tivoli Enterprise Portal Server and then click Reconfigure, and click OK to accept the existing configuration and go to the second TEP Server Configuration window. 3. In the dashboard data provider area of the configuration window, verify the Enable the dashboard data provider check box is selected. If it is not selected, then select it. 4. If you made changes to the portal server configuration, click OK. Otherwise, click Cancel to exit. 5. Ensure the portal server is restarted. Note: It is not necessary to provide a domain override value when enabling the ITM dashboard data provider unless you are using the ITM Hot Standby feature, which provides high availability for your hub monitoring server. See the Installing the Tivoli Enterprise Portal Server topics in the Tivoli Monitoring IBM Knowledge Center for more information on specifying a domain override value. Additional information on this procedure may be found in the Verifying the dashboard data provider is enabled topic in the Tivoli Monitoring IBM Knowledge Center. Setting up your dashboard environment Configure the Dashboard Application Services Hub environment, which includes creating a connection to the dashboard data provider, managing Dashboard Application Services Hub roles to control access to monitoring dashboard pages, and configuring access to resources in the monitoring dashboards. 4

5 You have two options: 1. Set up a basic dashboard environment where all users have access to the same monitoring resources and single sign-on is not enabled when launching the Tivoli Enterprise Portal client from the Dashboard Application Services Hub. 2. Set up a dashboard environment where you can control which monitored resources a user can access by using either authorization policies or Tivoli Enterprise Portal permissions. This type of environment requires that you use a shared LDAP user registry and configuring single sign-on. For more information, refer to the roadmaps in the Preparing your dashboard environment topic in the Tivoli Monitoring IBM Knowledge Center. The steps below show how to create a connection on DASH to the ITM dashboard data provider and assume that you are implementing the basic dashboard environment described above: 1. Log in to DASH. The default URL is where mydashhost is the IP address or the fully qualified host name of the system where the DASH is installed. You must log into DASH as a user who has been assigned the administrator and iscadmins Dashboard Application Services Hub roles. These roles are required to create and manage data provider connections. For information on assigning these roles to users, see the Managing Jazz for Service Management users and groups topics in the Jazz for Service Management IBM Knowledge Center. 2. Select Connections from the Console Settings menu as shown below: 3. Click New to create the new ITM dashboard data provider connection. 5

6 4. Fill in the displayed panel with the following information and click search : TEPS hostname or IP address Port: for HTTP or for HTTPS User to access the TEPS Password credentials for the above user Notes: a. Enter a Tivoli Enterprise Portal user such as sysadmin who has been granted these Tivoli Enterprise Portal authorizations: The user must be assigned the monitoring applications whose data will be displayed in the custom dashboards. If your custom dashboards display situation events, the user must have permission to view situation events. This user will be used to create the connection and to send all subsequent requests to the dashboard data provider on behalf of your dashboard users. b. If you plan to use HTTPS as the protocol connection, you must configure TLS/SSL between Dashboard Application Services Hub and the portal server before creating the data provider connection. For more information, see the Configuring TLS/SSL communication between Dashboard Application Services Hub and the dashboard data provider topic in the Tivoli Monitoring IBM Knowledge Center. Tip: You can create the connection with HTTP protocol for your initial testing. Once your environment is working, you can configure TLS/SSL between the servers, delete the connection, and re-add it with the HTTPS protocol. 5. If the ITM dashboard data provider has been enabled, the portal server is running and the credentials provided above are correct, then the search will find the ITM dashboard data provider and list it as shown in this example: 6


7 6. Select the provider and click OK as shown below: The new connection is created and listed in the Connections page below. If you need to use the same connection for the IBM Infrastructure Management Dashboards for Servers or IBM Infrastructure Management Dashboard for VMware, change the Provider ID field to specify the value ITMSD. 7. After the connection has been created, you are ready to create pages with data from monitoring agents. Note: if an error occurs when creating the data provider connection, see the ibm tivoli monitoring troubleshooting guide. 7

8 IBM Performance Management and DASH Configuration Checking for the Performance Management Dashboard Data Provider Availability Configuring the IBM Performance Management to DASH connection is done in a similar fashion as the the ITM to DASH connection. However, before creating the connection to the Performance Management dashboard data provider, it must be up and running. To determine if the Performance Management dashboard data provider is available, point the web browser on the DASH server to the data provider URL to make sure that it will work correctly. 1. Open the web browser and enter the following URL: The userid is smadmin and password should be what was used during the installation of the IBM Performance product (The system-supplied default value is apmpass ). After the connection has been established, the following screen should be visible: 2. Click Get to test the data provider. If the resulting page returns information regarding the IBM Performance Management dashboard data provider, then the data provider has successfully registered. Check the framework_status section. It should show ready status for events, msys, and prefetch_storage. The following screen illustrates what should be seen. 8


9 3. After confirming that the Performance Management data provider is functioning properly, create the connection to that data provider inside DASH. To do this, log on to the DASH console and navigate to Console Settings > Connections 9
 *Port: 8090 (or 8091 if you are using the HTTPS Protocol) *Hostname: <The PM server name> *Name: smadmin *Password: <password used when deploying")

10 4. When you bring up the Connections screen, click the Create New Remote Provider icon to create a new connection. 5. Enter the data provider connection information and click Search. *Protocol: HTTP (or HTTPS which is also supported) *Port: 8090 (or 8091 if you are using the HTTPS Protocol) *Hostname: <The PM server name> *Name: smadmin *Password: <password used when deploying the PM server> This forces the DASH to discover the PM data provider. 6. When the PM data provider is discovered, click on KD8 to populate the Connection Information fields with the *Name, Description, and *Provider ID. Click OK to save. You have now successfully created the connection to the APM data provider and now can add DASH widgets that will retrieve data from the APM data provider. Working with Pages - Creating, Adding and Editing Widgets Creating a page This section shows how to create a page on Dashboard Application Services Hub. If you need more information refer to Working with dashboards or pages in the Jazz for Service Management IBM Knowledge Center. The Working with Roles topic also describes the access level required to work with dashboard pages and widgets. 10

11 Limitation: When creating widgets with attributes from the Performance Management agents, you can see an agent s attributes but not all of them are available for display in the dashboard. If no data is displayed from an attribute in the widget, it might be because you specified an unsupported attribute or data set. To see a list of the attributes that are suitable for inclusion in the widget, log in to the Performance Management console, select Performance > Application Performance Dashboard, and drill down to the dashboard of an agent instance. Select the Attribute Details tab and create a table with the data set you intend to use in your DASH widget to see which attributes are available. 1. To create a page, log in to DASH. (The default URL is After the Welcome page appears, click on the Get started arrow and select build a page. 11

12 Optionally, you can click Console Settings > Pages from the DASH navigation bar. 12


13 2. When the Pages tab opens, click New Page: 3. Assign a name to the page and click OK: An empty page is displayed. 13

14 Adding widgets to a page 1. On the new page, click on the Dashboard Widgets folder icon to open and access the available widgets. 2. To add a widget to the page, choose a widget, for example Bar Chart, and then drag & drop it onto the page. 14

15 Editing a widget and specifying a dataset Data providers partition their data into one or more data sources and, for each data source, there can be one or more dataset. When you edit a widget, you select the dataset that you want to retrieve data from. Each monitoring tool s dashboard data provider has a data source for each agent type that has application support installed on the user interface. The datasets for a data source correspond to an attribute group of a monitoring agent. For example the Linux OS agent has datasets such as Linux Disk, Linux CPU, Linux Process, Linux Network, etc. When choosing a dataset, you are selecting the attribute group that contains the metrics you want to display in a widget. 1. To edit a widget and specify a dataset, click the arrow drop down menu icon on the widget and then select Edit: 2. After you click Edit, the following panel appears where you can choose the dataset corresponding to an agent s attribute group. (Refer to the monitoring agent's documentation for the list of supported attribute groups.) You can then search for the desired dataset. If you leave the search field empty then all datasets for all data providers are listed. If you type a string in the search field, the search only shows a subset of datasets containing that string in the name or description. For example, type Linux Disk to search all datasets to find the datasets that have Linux Disk in the dataset description or name: 15

 such as KLZ_Disk as shown below:")
16 3. From the list of datasets returned by the search, you would then choose an attribute group (ITM) or a data set (IPM) such as KLZ_Disk as shown below: 16

17 4. Next you specify the type of information you want to display from the KLZ_Disk attribute group and customize the widget with labels, etc. In the bar chart example, as in most of the chart widgets, to complete these settings, specify the following information as shown in the picture below: Type of information to represent on the Y-axis which is selectable from a drop down list, for example, the MountPoint attribute from the KLZ_Disk attribute group Values to represent on the X-axis selectable which are selectable from a drop down list, for example, the DiskUsagePercent attribute from the KLZ_Disk attribute group. 17

18 5. After you click OK, the data is retrieved and the bar chart is rendered: 6. Click Save and Exit to save the page you just created. 18


19 Edit an existing page If you want to open an existing page, select the Default folder icon from the DASH vertical bar menu and then select the desired page in the list: NOTE: When the page is opened, it is not in edit mode. If you want to change a setting, you can edit the page performing the following actions: Click on Page Actions icon Click on Edit Page Once in edit mode, you can change or delete an existing widget or add a new widget. 19
20 Create connections between widgets on a page Connections between widgets on a page provides you with the ability to select an object inside a widget and have related deeper object information shown contextually in 1 or more widgets in the same page. Note: the ITM dashboard data provider only supports this type of connection if the source widget (in this example, the list widget) has the managed system name in either a ORIGINNODE or NODE property. The picture below shows an example: The list widget shows the names of all Linux OS agents. The bar chart widget shows disk space usage information for the Linux OS agent that is selected in the list widget. In this example, when the ibmopt:lz managed system name is selected in the list widget, the disk space usage from that managed system is displayed in the bar chart. And when a user clicks on the Linux OS agent nc050044:lz in the list widget, the information in Linux Disk Space Usage Percent bar chart widget is updated to show the disk usage information from the nc050044:lz Linux OS agent, as shown in the following picture: 20
 Expand the section Optional Settings Uncheck the box Update context based on selections made in other portlets if it is already checked Check the option Automatically update the value to automate")
21 To create connections between two widgets, complete the steps below: 1. Enter edit mode for the widget that lists ITM managed systems. (In the example above, this was the list widget.) Expand the section Optional Settings Uncheck the box Update context based on selections made in other portlets if it is already checked Check the option Automatically update the value to automate the refresh of the managed systems. Check the option Show time stamp of last update to show the time of last refresh 21
 Expand the section Optional Settings Check the box Update context based on selections made in other portlets to update the data in this widget based on a managed system name selected in another")
22 2. Enter edit mode for the widget that should be updated by the first widget. (In the example above, this was the bar chart widget.) Expand the section Optional Settings Check the box Update context based on selections made in other portlets to update the data in this widget based on a managed system name selected in another widget (for example, the list widget in the picture above) Ensure the field Managed System Name is not set Uncheck the option Automatically update the value Uncheck the option Show time stamp of last update Note: In the Creating sample pages using ITM dashboard data provider supported widgets section in this paper, see the List widget Pie chart widget and Bar chart widget sub-sections that show how to create widgets similar to the ones in the example above. DASH widgets that can retrieve data from the monitoring tool s dashboard data provider The ITM and IPM dashboard data provider can be used with the following DASH widgets: 1. List widget 2. Table widgets: Simple table 3. Gauge widgets: Status gauge Analog gauge Volume bar Value status gauge 4. Chart Widgets: Bar Column Pie Line 22
23 Creating sample pages using the monitoring tooling dashboard data provider supported widgets In this section there are some examples showing the actions required to create pages using different widget types: charts, list, simple table, gauges. Although the following sections describe creating a new page you can also add widgets to existing pages using these same instructions. The widgets shown in this section are all supported by Tivoli Monitoring dashboard data provider V6.3 and by IBM Performance Monitoring dashboard data provider v The usage of different widgets with different Tivoli Monitoring datasets gives you numerous options when using this new functionality. For more information on the widget functionality in DASH, refer to the Working with widgets, Charting, and Tivoli Widget Library topics in the Jazz for Service Management information center. Common settings and parameters When you configure a widget to retrieve monitoring agent data from the ITM dashboard data provider, you specify settings that are widget specific and parameters that are data provider specific. The widget specific settings are described in the Jazz for Service Management information center topics referenced above. The widget may provide configuration parameters to filter what information is displayed. For example, if you are editing a widget such as a gauge that displays values from a single row in an agent attribute group, the data set configuration parameters allow you to specify dataset properties (attributes) that uniquely identify which row of data is displayed in the widget. For example, if you are configuring a gauge widget to display the disk utilization for a Linux OS agent, you can configure which dataset properties contain the disk and mount point to show the utilization of and which dataset property contains the disk utilization percentage. The ITM data provider specific parameters are described below: 1. Managed system name: You must identify which managed system(s) the data should be retrieved from. You have multiple options: a. Enter the name of a managed system, for example Primary:host1:NT for a Windows OS agent. b. Enter the name of a managed system group. When you specify a group name, the widget displays from for all online managed systems in the group. Note: Specifying a managed system group name is supported for these widget types: c. Select the option Update context based on selections made in other portlets. Choose this option if there will be another widget on the page that contains a list of one or more managed system names. This other widget is the source of the managed system name. When you choose the managed system name in the source widget then the data for that managed system will be displayed in the widget(s) that have the Update context based on selections made in other portlets option selected. See the Create connections between widgets on a page section in this paper for more details on how to configure connections between widgets. 23
24 Note: This option only works if the source and target widgets use the same property name for the managed system name. 2. Time filter: By default, near real-time monitoring data is retrieved by the dashboard data provider. If historical data is needed, the Time filter argument must be used. Depending on what type of widget is being configured for the page, the method by which the Time filter value is specified will be different. For charting widgets supplied with earlier versions of DASH (identified as 'Deprecated' in the DASH self-service dashboard), you may see a button entitled "Set Time Range". After clicking this button, a time range panel will appear, allowing you to specify a duration or discrete interval (start and end times). For other widgets, including the newer charting widgets supplied with current versions of DASH, a simple entry field will be presented. The value you enter in this field must be a legal ISO8601 formatted time string. The ISO8601 time standard allows for both duration and intervals to be defined. Some common examples of useful ISO8601 time strings would include the following: a. PT30M request for last 30 minutes of historical information from the selected dataset b. PT2H request for last two hours of historical information from the selected dataset c. PT4H30M request for last 4 hours and 30 minutes of historical information from the selected dataset d. P0Y0M2DT6H45M0S request for last 2 days, 6 hours, and 45 minutes of historical information from the selected dataset 3. Refresh interval: This parameters allows you to specify how often the ITM dashboard data provider provides refreshes of the data for those widgets that support auto-refresh. This parameter is not supported if you select the events data set. 24

25 Pie chart widget In this section, we describe how to create a pie chart and map it to a monitoring agent dataset. The pie chart in this example shows the paging file usage of a Windows computer system environment. To create a page with a pie chart, perform this procedure: Create a page as described in the Creating a page section in this paper or edit an existing page as described in the Edit an existing page section in this paper. Drag and drop the pie chart widget onto the page as shown in the following picture: Click on the Edit button and search for the datasets for paging. Then choose the Paging File NT_Paging_File dataset under the Windows OS datasource: 25

26 To complete the configuration, provide values for the following fields and options as shown in pictures below: Enter a name for the chart. In this example, IVTWIN6 Paging File is specified. Set Pie Label to the Pagefile Name attribute from the NT_Paging_File dataset. For the Pie Slices fields, choose the %Usage and %Usage Peak properties from the NT_ Paging_File dataset so that the pie chart shows the usage and usage peak percentages for each paging file. Under Settings section: Uncheck the box Update context based on selections made in other portlets to show data without a dependency on other widgets. 4. Check the option Automatically update the value to automate the refresh of the data Check the option Show time stamp of last update to show the time of last refresh 5. Select the option insert the Legend at the bottom of the chart Enter a managed system name as in the example or a managed system group name 26

27 Select the refresh timeframe 27

28 When you click OK, the pie chart displays the paging file usage similar to the example below: 28

29 Bar chart widget Similarly we can use a bar chart to represent Linux disk space usage on a bar chart. To create this type of chart, perform these steps: Create a page as described in Creating a page section in this paper or edit an existing page as described in the Edit an existing page section in this paper. Drag and drop the bar chart widget onto the page as shown in the following picture: 29

30 Select the Edit option for the widget as shown below: Enter Linux Disk in the search field and click Search. Choose the Linux Disk KLZ_Disk dataset 30

31 Fill in the Charting panel with the following information: Enter a Name for the widget such as Linux Disk Space Usage Percent For the Y-axis value: select the MountPoint property from the Linux Disk dataset. For the values to represent on X-axis: select the following properties from the Linux Disk dataset to show the disk space used and free percentages: o DiskUsedPercent o DiskFreePercent Managed System Name: this value can be set in the following ways: o Enter the name of a specific agent (for example nc050044:lz) to display the disk space usage values of that single specific agent o Enter the name of an ITM managed system group such as *LINUX_SYSTEM. In this case, the disk usage is displayed for all Linux managed systems in the group. o 31

32 o Leave the Managed System Name field empty and check the option Update context based on selections made in other portlets to contextualize the information between widgets. In this example, this option is used so that metrics are shown in this widget every time a managed system is selected in the list widget on the same page. See the Create connections between widgets on a page section in this page for more details on how to pass the managed system name from one widget to another. 32


33 When you click OK, the bar chart displays the disk space usage for each mount point. After clicking on the entry for the ibmopt:lz managed system name in the Managed Linux Hosts list widget, the disk space usage percent for each mount point monitored by that managed system is shown in the bar chart as in the picture below: When a user clicks on nc050044:lz in the Managed Linux Hosts widget, the disk space usage in the bar chart is updated to show data from that managed system as shown below: 33

34 Column chart widget In this section, we describe how to create a column chart and map it to a monitoring agent dataset. The column chart in this example shows the packet rates for the network interfaces monitored by a Windows OS agent. To create a page with a column chart, perform this procedure: Create a page as described in Creating a page section in this paper or edit an existing page as described in the Edit an existing page section in this paper. Drag and drop the column chart widget onto the page as shown in the following picture: 34

35 Search for datasets containing the word network and select the Network Interface - NT_Network_Interface dataset under the Windows OS datasource: Fill in the Charting panel with the following information: Enter a name for the widget, for example IVTWIN6 Network Interface For the X-Axis value, select the Network Interface Instance property from the Network Interface dataset. 35


36 For the Y-Axis values, select the following properties from the Network Interface dataset: o Packets Received /sec o Packets Sent /sec o Packets /sec Also specify values for the settings shown below. In this example, the column chart shows data from the Primary:IVTWIN6:NT managed system. 36

37 When you click OK, the column widget shows the packet rate similar to the example below: 37


38 Gauge widgets Each of the gauge widgets is configured in a similar manner although there is some customization that is unique to each gauge. The following steps detail how to create a page with an analog gauge widget but most of these steps will apply to the other gauge widgets as well: 1. Create a new page or edit a current page. 2. Drag and drop the analog gauge widget from the toolbar onto the page. 3. Configure the widget by selecting the down arrow and selecting the Edit option. 4 In the dataset selection panel, select a dataset for a monitoring agent in your environment. For example, filter the list of datasets by entering "Linux" in the search field and click on the Search button to display the datasets for the Linux OS agent. 38
39 5. Select a dataset such as Linux Disk KLZ_Disk or Linux CPU KLZ_CPU 39
40 6. In the value drop down list, select the property from the dataset that you want to display in the gauge, for example 'Disk Free Percent' 40
41 7. Under Visualization Options, add any optional visual settings such as the color to use for a range of values, the minimum and maximum values, the unit, etc. 8. Under Optional Dataset Parameters, you MUST specify the Managed System Name of the system from which you want to display the disk free percent metric. 41

42 9. Click OK and then save the page with the configured widgets View your new page and verify the data shown is accurate when compared to the data in the Tivoli Enterprise Portal. 42


43 Volume bar widget Follow the steps below to create a page with a volume bar widget: 1. Create a new page or edit a current page 2. Drag and drop the volume bar widget from the toolbar onto the page. 3. Configure the widget by selecting the down arrow and selecting the Edit option. 4. Select a dataset for a monitoring agent in your environment. Filter the list of datasets by entering "Linux" and clicking on the Search button to find the datasets for the Linux OS agent. 43

44 5. Select a dataset such as 'Linux Disk KLZ_Disk' or 'Linux CPU KLZ_CPU' 6. In the value drop down list, select the property from the dataset that you want to display in the volume bar, for example 'Disk Free Percent' 44


45 7. Under Visualization Options, add any optional visual settings such as the colors to use for a range of values, the minimum and maximum values, the unit, etc. 8. Under the Optional Dataset Parameters you MUST specify the managed system name of the agent from which you wish to display the disk free percent metric. 9. Click OK and then save the page with the configured widgets. 45

46 10. View your new page and verify the data shown is accurate when compared to the data in the Tivoli Enterprise Portal. 46

47 Table widget Follow the steps below to create a page with a simple table widget: 1. Create a new page or edit a current page 2. Drag and drop the table widget from the toolbar onto the page 3. Configure the widget by selecting the down arrow and selecting the Edit option. 4. Select a dataset for a monitoring agent in your environment. Filter the list of datasets by entering "Linux" and clicking on the Search button to find the datasets for the Linux OS agent. 5. Select a dataset, for example Linux CPU KLZ_CPU 6. No required setting is needed 47

48 7. Under the optional settings category, you can choose: A title for the table The columns that you want to see in the table and the order in which they should be displayed. Each column maps to a property in the dataset. The managed system name. You can enter a specific managed system name or you can specify a managed system group name as shown in the picture below in order to display data from multiple managed systems. 48

49 8. The picture below shows an example of the table widget display: 49


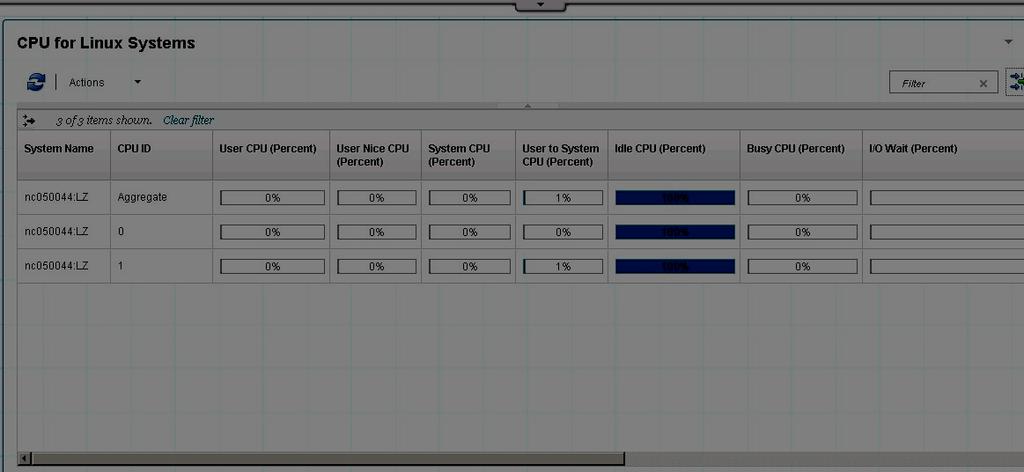
50 9. A filter function is available to filter for a value in any column or in a specific column as shown in the example below: The example below shows the result after filtering the table to show the rows whose System Name column contains the string nc05 : 50
51
IBM Infrastructure Suite for z/vm and Linux: Introduction IBM Tivoli OMEGAMON XE on z/vm and Linux
 IBM Infrastructure Suite for z/vm and Linux: Introduction IBM Tivoli OMEGAMON XE on z/vm and Linux August/September 2015 Please Note IBM s statements regarding its plans, directions, and intent are subject
Using Netcool/Impact and IBM Tivoli Monitoring to build a custom selfservice
 IBM Tivoli Software Using Netcool/Impact and IBM Tivoli Monitoring to build a custom selfservice dashboard Document version 1.0 Brian R. Fabec IBM Software Developer Copyright International Business Machines
ICL02: Security Analytics: Discover More in your Endpoint Protection Dashboard Hands-On Lab
 ICL02: Security Analytics: Discover More in your Endpoint Protection Dashboard Hands-On Lab Description In this lab you will learn how to install and create custom reports and dashboards using IT Analytics
Tivoli Common Reporting V Cognos report in a Tivoli Integrated Portal dashboard
 Tivoli Common Reporting V2.1.1 Cognos report in a Tivoli Integrated Portal dashboard Preethi C Mohan IBM India Ltd. India Software Labs, Bangalore +91 80 40255077 preethi.mohan@in.ibm.com Copyright IBM
Understanding the Relationship with Domain Managers
 4 CHAPTER Understanding the Relationship with Domain Managers Prime Central for HCS reports the events generated by underlying domain managers. Domain managers may also discover topology and relationships
Using the Prime Performance Manager Web Interface
 3 CHAPTER Using the Prime Performance Manager Web Interface The following topics provide information about using the Cisco Prime Performance Manager web interface: Accessing the Prime Performance Manager
IBM Exam C IBM Tivoli Monitoring V6.3 Implementation Version: 6.0 [ Total Questions: 120 ]
![IBM Exam C IBM Tivoli Monitoring V6.3 Implementation Version: 6.0 [ Total Questions: 120 ]](/thumbs/92/109344639.jpg "IBM Exam C IBM Tivoli Monitoring V6.3 Implementation Version: 6.0 [ Total Questions: 120 ]") s@lm@n IBM Exam C9560-507 IBM Tivoli Monitoring V6.3 Implementation Version: 6.0 [ Total Questions: 120 ] Question No : 1 A customer must perform trend analysis for future growth. Which product should
s@lm@n IBM Exam C9560-507 IBM Tivoli Monitoring V6.3 Implementation Version: 6.0 [ Total Questions: 120 ] Question No : 1 A customer must perform trend analysis for future growth. Which product should
Hands-on Lab Session 9909 Introduction to Application Performance Management: Monitoring. Timothy Burris, Cloud Adoption & Technical Enablement
 Hands-on Lab Session 9909 Introduction to Application Performance Management: Monitoring Timothy Burris, Cloud Adoption & Technical Enablement Copyright IBM Corporation 2017 IBM, the IBM logo and ibm.com
BIG-IP Analytics: Implementations. Version 12.1
 BIG-IP Analytics: Implementations Version 12.1 Table of Contents Table of Contents Setting Up Application Statistics Collection...5 What is Analytics?...5 About HTTP Analytics profiles...5 Overview: Collecting
Extended Search Administration
 IBM Lotus Extended Search Extended Search Administration Version 4 Release 0.1 SC27-1404-02 IBM Lotus Extended Search Extended Search Administration Version 4 Release 0.1 SC27-1404-02 Note! Before using
TBSM + JazzSM UI Services (DASH) Integration: Creating a Dashboard
 Integration: Creating a Dashboard") TBSM + JazzSM UI Services (DASH) Integration: Creating a Dashboard Version 1.1 September 13, 2013 Notices References in content to IBM products, software, programs, services or associated technologies
TBSM + JazzSM UI Services (DASH) Integration: Creating a Dashboard Version 1.1 September 13, 2013 Notices References in content to IBM products, software, programs, services or associated technologies
Agent and Agent Browser. Updated Friday, January 26, Autotask Corporation
 Agent and Agent Browser Updated Friday, January 26, 2018 2018 Autotask Corporation Table of Contents Table of Contents 2 The AEM Agent and Agent Browser 3 AEM Agent 5 Privacy Mode 9 Agent Browser 11 Agent
Creating Dashboard Widgets. Version: 16.0
 Creating Dashboard Widgets Version: 16.0 Copyright 2017 Intellicus Technologies This document and its content is copyrighted material of Intellicus Technologies. The content may not be copied or derived
ZENworks Reporting System Reference. January 2017
 ZENworks Reporting System Reference January 2017 Legal Notices For information about legal notices, trademarks, disclaimers, warranties, export and other use restrictions, U.S. Government rights, patent
Creating Dashboard Widgets. Version: 7.3
 Creating Dashboard Widgets Version: 7.3 Copyright 2015 Intellicus Technologies This document and its content is copyrighted material of Intellicus Technologies. The content may not be copied or derived
Pure Storage FlashArray Management Pack for VMware vrealize Operations Manager User Guide. (Version with Purity 4.9.
 Pure Storage FlashArray Management Pack for VMware vrealize Operations Manager User Guide (Version 1.0.139 with Purity 4.9.x or higher) Sunday, November 27, 2016 16:13 Pure Storage FlashArray Management
SQream Dashboard Version SQream Technologies
 SQream Dashboard Version 1.1.0 SQream Technologies 2018-11-06 Table of Contents Overview................................................................................... 1 1. The SQream Dashboard...................................................................
Stratusphere UX. Advanced Mode Dashboards Guide
 Stratusphere UX Advanced Mode Dashboards Guide Introduction This guide has been authored by experts at Liquidware to provide information and guidance to walk you through an evaluation of the Stratusphere
Customer Support Guide Creating a custom Headcount Dashboard
 Customer Support Guide Creating a custom Headcount Dashboard Contents Purpose... 2 Rationale... 2 Step by Step Instruction... 3 Related Documentation... 11 Package Version Date HCM 16.01 02/02/2017 HCM
vrealize Operations Manager Management Pack for vrealize Hyperic Release Notes
 vrealize Operations Manager Management Pack for vrealize Hyperic Release Notes vrealize Operations Manager Management Pack for Hyperic 6.0 Last document update: 04 December 2014. Contents: New Features
Veritas System Recovery 18 Management Solution Administrator's Guide
 Veritas System Recovery 18 Management Solution Administrator's Guide Documentation version: 18 Legal Notice Copyright 2018 Veritas Technologies LLC. All rights reserved. Veritas and the Veritas Logo are
IBM IBM Tivoli Monitoring Express V6.1 Specialist. Download Full Version :
 IBM 000-887 IBM Tivoli Monitoring Express V6.1 Specialist Download Full Version : https://killexams.com/pass4sure/exam-detail/000-887 QUESTION: 88 Which two options for log files for tracing the Warehouse
CDP Data Center Console User Guide CDP Data Center Console User Guide Version
 CDP Data Center Console User Guide CDP Data Center Console User Guide Version 3.18.2 1 README FIRST Welcome to the R1Soft CDP Data Center Console User Guide The purpose of this manual is to provide you
Causeway ECM Team Notifications. Online Help. Online Help Documentation. Production Release. February 2016
 Causeway ECM Team Notifications Online Help Production Release February 2016 Causeway Technologies Ltd Comino House, Furlong Road, Bourne End, Buckinghamshire SL8 5AQ Phone: +44 (0)1628 552000, Fax: +44
Nimsoft Unified Management Portal
 Nimsoft Unified Management Portal User Documentation 6.2 Legal Notices Copyright 2012, CA. All rights reserved. Warranty The material contained in this document is provided "as is," and is subject to being
vrealize Operations Manager Customization and Administration Guide vrealize Operations Manager 6.4
 vrealize Operations Manager Customization and Administration Guide vrealize Operations Manager 6.4 vrealize Operations Manager Customization and Administration Guide You can find the most up-to-date technical
IBM Security QRadar Deployment Intelligence app IBM
 IBM Security QRadar Deployment Intelligence app IBM ii IBM Security QRadar Deployment Intelligence app Contents QRadar Deployment Intelligence app.. 1 Installing the QRadar Deployment Intelligence app.
Dashboards. created by others because they have given you permission to view.
 The Unified Intelligence Center interface is organized by dashboards. are web pages that display reports, scheduled reports, sticky notes, and web-based elements, such as URLs and web widgets, that are
IBM Monitoring Agent for Citrix Virtual Desktop Infrastructure 7.2 FP3. User's Guide IBM SC
 IBM Monitoring Agent for Citrix Virtual Desktop Infrastructure 7.2 FP3 User's Guide IBM SC14-7487-02 IBM Monitoring Agent for Citrix Virtual Desktop Infrastructure 7.2 FP3 User's Guide IBM SC14-7487-02
VMware vrealize Operations for Horizon Administration. 20 SEP 2018 VMware vrealize Operations for Horizon 6.6
 VMware vrealize Operations for Horizon Administration 20 SEP 2018 VMware vrealize Operations for Horizon 6.6 You can find the most up-to-date technical documentation on the VMware website at: https://docs.vmware.com/
Implementing Single-Sign-On(SSO) for APM UI
 for APM UI") Implementing Single-Sign-On(SSO) for APM UI 1.Introduction...2 2.Overview of SSO with LTPA...3 3.Installing and configuring TDS...5 3.1.Installing TDS 6.3...5 3.2.Changing the administrator password (Optional)...7
Implementing Single-Sign-On(SSO) for APM UI 1.Introduction...2 2.Overview of SSO with LTPA...3 3.Installing and configuring TDS...5 3.1.Installing TDS 6.3...5 3.2.Changing the administrator password (Optional)...7
IT Essentials v6.0 Windows 10 Software Labs
 IT Essentials v6.0 Windows 10 Software Labs 5.2.1.7 Install Windows 10... 1 5.2.1.10 Check for Updates in Windows 10... 10 5.2.4.7 Create a Partition in Windows 10... 16 6.1.1.5 Task Manager in Windows
Goliath Performance Monitor v11.7 POC Install Guide
 Goliath Performance Monitor v11.7 POC Install Guide Goliath Performance Monitor Proof of Concept Limitations Goliath Performance Monitor Proof of Concepts (POC) will be limited to monitoring 5 Hypervisor
VMware vrealize Operations for Horizon Administration. Modified on 3 JUL 2018 VMware vrealize Operations for Horizon 6.4
 VMware vrealize Operations for Horizon Administration Modified on 3 JUL 2018 VMware vrealize Operations for Horizon 6.4 You can find the most up-to-date technical documentation on the VMware website at:
VMware vcloud Air User's Guide
 vcloud Air This document supports the version of each product listed and supports all subsequent versions until the document is replaced by a new edition. To check for more recent editions of this document,
Using the Portal in Operations Manager
 CHAPTER 2 These topics describe how to use the portal in Cisco Unified Operations Manager: Understanding the Diagnostics View, page 2-1 Customizing Your Dashboard, page 2-1 Working with Dashboard Views,
Hosted UC Reporting Quick Reference Guide
 Hosted UC Reporting Quick Reference Guide 180720 Table of Contents Overview... 3 Reporting Portal Overview... 3 Logging In... 3 Access your reports:... 3 My Reports List (Legend 1):... 4 Add Report Button
NetScaler Analysis and Reporting. Goliath for NetScaler Installation Guide v4.0 For Deployment on VMware ESX/ESXi
 NetScaler Analysis and Reporting Goliath for NetScaler Installation Guide v4.0 For Deployment on VMware ESX/ESXi (v4.0) Document Date: October 2016 www.goliathtechnologies.com 1 Legal Notices Goliath for
Build the application using Rational Build Forge
 Build the application using Rational Build Forge In this lab, as the Build Engineer, you will run a formal build of Release 2.0 of the RatlBankWeb application. After the build completes, you will be able
S2 NetBox v4.8 Basic End-User Admin Training
 S2 NetBox v4.8 Basic End-User Admin Training 4/8/16 S2 Security 1 Table of Contents Introduction... 3 Log into your NetBox System... 3 Person Records... 5 Accessing Person Records... 5 Content of a Person
ForeScout App for IBM QRadar
 How-to Guide Version 2.0.0 Table of Contents About IBM QRadar Integration... 3 Use Cases... 3 Visualization of CounterACT Endpoint Compliance Status & Connectivity... 3 Agent Health and Compliance for
Deployment Scenario: WebSphere Portal Mashup integration and page builder
 Deployment Scenario: WebSphere Portal 6.1.5 Mashup integration and page builder Deployment Scenario: WebSphere Portal 6.1.5 Mashup integration and page builder...1 Abstract...2 Portal Mashup integration
ForeScout Extended Module for IBM BigFix
 Version 1.1 Table of Contents About BigFix Integration... 4 Use Cases... 4 Additional BigFix Documentation... 4 About this Module... 4 About Support for Dual Stack Environments... 5 Concepts, Components,
[ Getting Started with Analyzer, Interactive Reports, and Dashboards ] ]
![[ Getting Started with Analyzer, Interactive Reports, and Dashboards ] ]](/thumbs/88/117545107.jpg "[ Getting Started with Analyzer, Interactive Reports, and Dashboards ] ]") Version 5.3 [ Getting Started with Analyzer, Interactive Reports, and Dashboards ] ] https://help.pentaho.com/draft_content/version_5.3 1/30 Copyright Page This document supports Pentaho Business Analytics
Version 5.3 [ Getting Started with Analyzer, Interactive Reports, and Dashboards ] ] https://help.pentaho.com/draft_content/version_5.3 1/30 Copyright Page This document supports Pentaho Business Analytics
ehealth SPECTRUM Integration
 User Guide March 2007 ehealth SPECTRUM Integration Whether you are a large enterprise or a service provider, your operations team faces a significant challenge maintaining critical service levels across
Introduction to the New User Interface. ScienceLogic Beta Version 8.7.0
 Introduction to the New User Interface ScienceLogic Beta Version 8.7.0 Table of Contents Introduction to the New User Interface 4 Logging In and Out of the New User Interface 5 Using the Tabs in the New
Deploying VMware Workspace ONE Intelligent Hub. October 2018 VMware Workspace ONE
 Deploying VMware Workspace ONE Intelligent Hub October 2018 VMware Workspace ONE You can find the most up-to-date technical documentation on the VMware website at: https://docs.vmware.com/ If you have
PASSPORTAL PLUGIN DOCUMENTATION
 Contents Requirements... 2 Install or Update Passportal Plugin Solution Center... 3 Configuring Passportal Plugin... 5 Client mapping... 6 User Class Configuration... 7 About the Screens... 8 Passportal
Policy Commander Console Guide - Published February, 2012
 Policy Commander Console Guide - Published February, 2012 This publication could include technical inaccuracies or typographical errors. Changes are periodically made to the information herein; these changes
vcenter Operations Manager for Horizon View Administration
 vcenter Operations Manager for Horizon View Administration vcenter Operations Manager for Horizon View 1.5 vcenter Operations Manager for Horizon View 1.5.1 This document supports the version of each product
OBIEE. Oracle Business Intelligence Enterprise Edition. Rensselaer Business Intelligence Finance Author Training
 OBIEE Oracle Business Intelligence Enterprise Edition Rensselaer Business Intelligence Finance Author Training TABLE OF CONTENTS INTRODUCTION... 1 USER INTERFACE... 1 HOW TO LAUNCH OBIEE... 1 TERMINOLOGY...
WebSphere Application Server V7: Administration Consoles and Commands
 Chapter 5 of WebSphere Application Server V7 Administration and Configuration Guide, SG24-7615 WebSphere Application Server V7: Administration Consoles and Commands WebSphere application server properties
Advanced Application Reporting USER GUIDE
 Advanced Application Reporting USER GUIDE CONTENTS 1.0 Preface: About This Document 5 2.0 Conventions 5 3.0 Chapter 1: Introducing Advanced Application Reporting 6 4.0 Features and Benefits 7 5.0 Product
IBM. PDF file of IBM Knowledge Center topics. IBM Operations Analytics for z Systems. Version 2 Release 2
 IBM Operations Analytics for z Systems IBM PDF file of IBM Knowledge Center topics Version 2 Release 2 IBM Operations Analytics for z Systems IBM PDF file of IBM Knowledge Center topics Version 2 Release
Viewing Dashboards... 5 Managing Dashboards... 9 Sharing Dashboards... 14
 Dashboard User's Guide Release 9.0 May 2015 Contents About Dashboards... 5 Navigating to the Dashboards Module... 5 Working with Dashboards... 5 Viewing Dashboards... 5 Selecting Dashboards... 6 Components
Altiris IT Management Suite 7.1 from Symantec Enhanced Console Views Getting Started Guide. Version 7.1
 Altiris IT Management Suite 7.1 from Symantec Enhanced Console Views Getting Started Guide Version 7.1 Contents Section 1 Chapter 1 Altiris IT Management Suite 7.1 from Symantec Enhanced Console Views
Log & Event Manager UPGRADE GUIDE. Version Last Updated: Thursday, May 25, 2017
 UPGRADE GUIDE Log & Event Manager Version 6.3.1 Last Updated: Thursday, May 25, 2017 Retrieve the latest version from: https://support.solarwinds.com/success_center/log_event_manager_(lem)/lem_documentation
Administration. VMware Horizon Cloud Service. Horizon Cloud with Hosted Infrastructure 18.1
 Horizon Cloud with Hosted Infrastructure 18.1 Administration VMware Horizon Cloud Service Horizon Cloud with Hosted Infrastructure 18.1 You can find the most up-to-date technical documentation on the VMware
BIG-IP Analytics: Implementations. Version 13.1
 BIG-IP Analytics: Implementations Version 13.1 Table of Contents Table of Contents Setting Up Application Statistics Collection...5 What is Analytics?...5 About HTTP Analytics profiles... 5 Overview:
Web Console Setup & User Guide. Version 7.1
 Web Console Setup & User Guide Version 7.1 1 Contents Page Number Chapter 1 - Installation and Access 3 Server Setup Client Setup Windows Client Setup Mac Client Setup Linux Client Setup Interoperation
Sage Construction Central Setup Guide (Version 18.1)
") Sage 300 Construction and Real Estate Sage Construction Central Setup Guide (Version 18.1) Certified course curriculum Important Notice The course materials provided are the product of Sage. Please do
Sage 300 Construction and Real Estate Sage Construction Central Setup Guide (Version 18.1) Certified course curriculum Important Notice The course materials provided are the product of Sage. Please do
GETTING STARTED. A Step-by-Step Guide to Using MarketSight
 GETTING STARTED A Step-by-Step Guide to Using MarketSight Analyze any dataset Run crosstabs Test statistical significance Create charts and dashboards Share results online Introduction MarketSight is a
Compliance Document Manager User Guide
 Compliance Document Manager User Guide Contents OVERVIEW... 3 SYSTEM REQUIREMENTS... 3 VENDORMATE PASSWORD REQUIREMENTS... 3 LOGIN... 4 THE HOME SCREEN... 5 BA Screening... 5 BA Oversight... 5 My Screening
IBM Spectrum Protect TM Snapshot: How to find the information you need
 IBM Spectrum Protect TM Snapshot: How to find the information you need Tip: Beginning with Version 4.1.3, IBM Tivoli Storage FlashCopy Manager is now IBM Spectrum Protect Snapshot. Some applications such
Configuring ApplicationHA in VMware SRM 5.1 environment
 Configuring ApplicationHA in VMware SRM 5.1 environment Windows Server 2003 and 2003 R2, Windows Server 2008 and 2008 R2 6.0 September 2013 Contents Chapter 1 About the ApplicationHA support for VMware
Monitor DNS errors in a dashboard
 Monitor DNS errors in a dashboard Published: 2018-04-20 The Domain Name System (DNS) is an essential service for resolving hostnames to IP addresses. Any system that needs to locate and communicate with
DESIGN MOBILE APPS FOR ANDROID DEVICES
 DESIGN MOBILE APPS FOR ANDROID DEVICES Thank you for participating in a workshop at MicroStrategy World 2019. If you missed or did not finish an exercise and want to complete it after the conference,
VIRTUALIZATION MANAGER ENTERPRISE EDITION GETTING STARTED GUIDE. Product: Virtual Iron Virtualization Manager Version: 4.2
 VIRTUALIZATION MANAGER ENTERPRISE EDITION GETTING STARTED GUIDE This manual provides a quick introduction to Virtual Iron software, and explains how to use Virtual Iron Virtualization Manager to configure
vfire Server Console Guide Version 1.5
 vfire Server Console Guide Table of Contents Version Details 4 Copyright 4 About this guide 6 Intended Audience 6 Standards and Conventions 6 Introduction 7 Accessing the Server Console 8 Creating a System
MicroStrategy Desktop
 MicroStrategy Desktop Quick Start Guide MicroStrategy Desktop is designed to enable business professionals like you to explore data, simply and without needing direct support from IT. 1 Import data from
User Guide HelpSystems Insite 1.6
 User Guide HelpSystems Insite 1.6 Copyright Copyright HelpSystems, LLC. HelpSystems Insite, OPAL, OPerator Assistance Language, Robot ALERT, Robot AUTOTUNE, Robot CLIENT, Robot CONSOLE, Robot CORRAL, Robot
Quick Start Guide. Kaseya 2
 LiveConnect Quick Start Guide Kaseya 2 February 13, 2010 About Kaseya Kaseya is a global provider of IT automation software for IT Solution Providers and Public and Private Sector IT organizations. Kaseya's
Approaches to Enterprise-Wide Monitoring and Problem-Solving on IBM z Systems
 Session 17728: Approaches to Enterprise-Wide Monitoring and Problem-Solving on IBM z Systems Ernie Gilman IBM Sr. Consulting IT Specialist egilman@us.ibm.com Abstract Examples of how best to leverage the
Style Report Enterprise Edition
 INTRODUCTION Style Report Enterprise Edition Welcome to Style Report Enterprise Edition! Style Report is a report design and interactive analysis package that allows you to explore, analyze, monitor, report,
Getting Started Quick Start Guide
 Getting Started Quick Start Guide This guide provides tips for users new to using the Learning Environment. It discusses how to navigate the main areas and how to change your personal preferences and settings.
Installation Guide. Cimatron Site Manager 2.0 Release Note
 Installation Guide Cimatron Site Manager 2.0 Release Note Installation Guide i Table of Contents Introduction... 1 Cimatron Site Manager Components... 2 Installation... 3 Hardware Requirements... 3 Software
Creating Dashboard. Version: 7.3
 Creating Dashboard Version: 7.3 Copyright 2015 Intellicus Technologies This document and its content is copyrighted material of Intellicus Technologies. The content may not be copied or derived from, through
Your environment will now be created. The status is Creating. You can use the Refresh button to refresh the page.
 MANUAL This guide helps you getting started with SaasNow within a few steps. Create SAS environment 1. You received an email from SaasNow where you can create your login details. 2. Log in to /login with
Comodo IT and Security Manager Software Version 6.4
 Comodo IT and Security Manager Software Version 6.4 End User Guide Guide Version 6.4.040417 Comodo Security Solutions 1255 Broad Street Clifton, NJ 07013 Table of Contents 1. Introduction to Comodo IT
IBM. IBM Service Management Unite V Installation and Configuration Guide
 IBM IBM Service Management Unite V1.1.1 - Installation and Configuration Guide ii IBM Service Management Unite V1.1.1 - Installation and Configuration Guide Contents Chapter 1. Overview and planning...
10ZiG Technology. 10ZiG Manager Getting Started Guide. Page 1
 10ZiG Technology 10ZiG Manager Getting Started Guide Page 1 10ZiG Manager Getting Started 10ZiG Technology Limited Headquarters US 2012 W Lone Cactus Dr Phoenix, AZ 85027 Phone 866-864-5250 Fax 623-516-8697
Multi-Sponsor Environment. SAS Clinical Trial Data Transparency User Guide
 Multi-Sponsor Environment SAS Clinical Trial Data Transparency User Guide Version 6.0 01 December 2017 Contents Contents 1 Overview...1 2 Setting up Your Account...3 2.1 Completing the Initial Email and
Documentation. This PDF was generated for your convenience. For the latest documentation, always see
 Management Pack for AWS 1.50 Table of Contents Home... 1 Release Notes... 3 What's New in Release 1.50... 4 Known Problems and Workarounds... 5 Get started... 7 Key concepts... 8 Install... 10 Installation
Integrate Microsoft Office 365. EventTracker v8.x and above
 EventTracker v8.x and above Publication Date: March 5, 2017 Abstract This guide provides instructions to configure Office 365 to generate logs for critical events. Once EventTracker is configured to collect
Content Publisher User Guide
 Content Publisher User Guide Overview 1 Overview of the Content Management System 1 Table of Contents What's New in the Content Management System? 2 Anatomy of a Portal Page 3 Toggling Edit Controls 5
Introduction to IBM Rational HATS For IBM System i (5250)
") Introduction to IBM Rational HATS For IBM System i (5250) Introduction to IBM Rational HATS 1 Lab instructions This lab teaches you how to use IBM Rational HATS to create a Web application capable of transforming
Introduction to IBM Rational HATS For IBM System i (5250) Introduction to IBM Rational HATS 1 Lab instructions This lab teaches you how to use IBM Rational HATS to create a Web application capable of transforming
Forescout. eyeextend for IBM BigFix. Configuration Guide. Version 1.2
 Forescout Version 1.2 Contact Information Forescout Technologies, Inc. 190 West Tasman Drive San Jose, CA 95134 USA https://www.forescout.com/support/ Toll-Free (US): 1.866.377.8771 Tel (Intl): 1.408.213.3191
Administration. VMware Horizon Cloud Service. Horizon Cloud with Hosted Infrastructure 17.2
 Horizon Cloud with Hosted Infrastructure 17.2 Administration VMware Horizon Cloud Service Horizon Cloud with Hosted Infrastructure 17.2 You can find the most up-to-date technical documentation on the VMware
2015 Entrinsik, Inc.
 2015 Entrinsik, Inc. Table of Contents Chapter 1: Creating a Dashboard... 3 Creating a New Dashboard... 4 Choosing a Data Provider... 5 Scheduling Background Refresh... 10 Chapter 2: Adding Graphs and
CA Unified Infrastructure Management Unified Management Portal
 CA Unified Infrastructure Management Unified Management Portal Release Notes 8.0 Documentation Changes Document Version Date Changes 1.0 September 2014 Initial version for UMP 8.0. Copyright Notice This
SAS Job Monitor 2.2. About SAS Job Monitor. Overview. SAS Job Monitor for SAS Data Integration Studio
 SAS Job Monitor 2.2 About SAS Job Monitor Overview SAS Job Monitor is a component of SAS Environment Manager that integrates information from SAS Data Integration Studio, DataFlux Data Management Server,
vfabric Hyperic Monitoring and Management
 vfabric Hyperic Monitoring and Management VMware vfabric Hyperic 5.0 This document supports the version of each product listed and supports all subsequent versions until the document is replaced by a new
Monitoring Agent for Microsoft Hyper-V Server Fix Pack 12. Reference IBM
 Monitoring Agent for Microsoft Hyper-V Server 6.3.1 Fix Pack 12 Reference IBM Monitoring Agent for Microsoft Hyper-V Server 6.3.1 Fix Pack 12 Reference IBM Note Before using this information and the product
High Availability Guide for Distributed Systems
 IBM Tivoli Monitoring Version 6.3 Fix Pack 2 High Availability Guide for Distributed Systems SC22-5455-01 IBM Tivoli Monitoring Version 6.3 Fix Pack 2 High Availability Guide for Distributed Systems SC22-5455-01
C Exam Questions Demo IBM. Exam Questions C
 IBM Exam Questions C9560-507 IBM Tivoli Monitoring V6.3 Implementation Version:Demo 1.Which method converts a table view to a bar chart in a Tivoli Enterprise Portal (TEP) workspace? A. click the Bar Chart
Reporting and Graphing
 Tivoli Management Solution for Microsoft SQL Reporting and Graphing Version 1.1 Tivoli Management Solution for Microsoft SQL Reporting and Graphing Version 1.1 Tivoli Management Solution for Microsoft
Comodo Network Center Software Version 1.1
 Comodo Network Center Software Version 1.1 User Guide Guide Version 2.3.112311 Comodo Security Solutions 1255 Broad Street STE 100 Clifton, NJ 07013 Table of Contents Comodo Network Center - Introduction...
Realtests.C QA
 Realtests.C2010-593.55.QA Number: C2010-593 Passing Score: 800 Time Limit: 120 min File Version: 1.5 C2010-593 IBM Tivoli Netcool/OMNIbus V7.4 Fundamentals I have corrected few questions and now score
INSTALLING MICROSOFT OUTLOOK 2011
 INSTALLING MICROSOFT OUTLOOK 2011 The purpose of this guide is to explain how to download, install, and configure Microsoft Outlook 2011. Follow the steps as detailed in this document. If you encounter
Comodo IT and Security Manager Software Version 6.9
 Comodo IT and Security Manager Software Version 6.9 End User Guide Guide Version 6.9.072817 Comodo Security Solutions 1255 Broad Street Clifton, NJ 07013 Table of Contents 1. Introduction to Comodo IT