EzyRings. Table of Contents
|
|
|
- Diane Patterson
- 5 years ago
- Views:
Transcription
... 9 Overview... 9 General Tab... 10 Report Header... 11 Ring Details... 12 Holes Table... 13 Notes Section... 15 Approvals Section.")
1 vcomp Pty Ltd (ABN ) PO Box 7356 Cloisters Square Perth WA 6850 Telephone Fax EzyRings Reporting System Table of Contents Report Designer... 3 Company Header... 4 The Value Browser... 5 Ring Reports (Drill & Charge Plans)... 9 Overview... 9 General Tab Report Header Ring Details Holes Table Notes Section Approvals Section Plot Details Dump Indicator Dip Indication Overview Plan Plot Drawing Text and Images Drive Reports (Collar Markup Plan) Overview Including Additional Strings & Create Survey Markup General Tab Report Header Drive Details Rings Table Notes Section Approvals Section Plot Drawing Text and Images Page 1 of 47
2 Stope Reports Overview General Tab Report Header Sub Heading Table Details Drawing Styles (lines, symbols, colours, etc) System Configuration Explosive Properties Custom Plotting Styles Reports Centre Generating DWF Plots Creating Excel Spreadsheets Generating IREDES XML Files Preview, Printing, and PDF generation Page 2 of 47


3 Report Designer EzyRings has a customisable reporting system with a rich set of reportable values. A number of A4 and A3 reporting templates are supplied which you modify to suite your particular needs. To begin select the report designer from the EzyRings menu as shown. If you have previously created a report it will be shown under the reports section otherwise only report templates will be available in the tree view. Select either an existing report to modify or select a report template by double clicking on the name. Page 3 of 47

4 Company Header When you initially setup you must first create a report header which is then used for all report definitions. Select the modify company header checkbox on the Report Designer form as shown and complete the details for your company header. Note that there are two styles of company logo position to cater for squarish or long logos. When defining colours EzyRings will automatically lookup the closest pen number from your defined Surpac pen palette. The general report settings at the bottom of the form will normally not need to be modified. These are options for non-english speaking sites. Page 4 of 47

5 The Value Browser On several areas in the Report Designer are instances of the value browser. The value browser allows you to select an item of information to be reported into the title block of your report. Information may relate to the stope, drive, ring, holes, charges, rig, and plot. A value browser appears on the form as depicted above. To invoke the value browser click on the arrow icon to the right of the widget. When the popup window appears select the value type that you require along with the number of decimal places to use. Select -1 for non-numeric value types like stope name. The table below describes all the current value types. Value scale stope name drive name ring name drive area designed metres drilled metres charged metres burden density element ring dump ring bearing ring number of holes Description The plot scale. The stope name. The name of the drive. The name of the ring. The area of the drive in square metres. The total length of all holes in metres. The total drilled or actual length of all holes in metres. The total length of all charges in metres. The burden value of the ring. This is usually the distance to the next ring section. The density / specific gravity value of the ring. The primary element (ie gold) grade value of the ring. The raw dump value of the ring expressed in decimal degrees. The angle is measured counter clockwise with zero degrees orientated to the left. The ring bearing value of the ring expressed in decimal degrees. Also known as the plane angle or azimuth. The angle is measured clockwise with zero degrees orientated north. The total number of holes in this ring. Page 5 of 47
6 reference point X reference point Y reference point Z stope area rock volume rock mass break area break volume break mass explosive volume explosive mass powder factor on volume powder factor on mass tonnes per metre tonnes per metre drilled hole Id pivot Id hole length hole breakthrough hole diameter hole dump hole dip hole bearing hole status hole enabled hole rods collar distance to floor collar distance to reference point collar distance to last collar collar distance to left wall collar distance to right wall collar distance to closest wall The X coordinate value of the rings reference point. The Y coordinate value of the rings reference point. The Z coordinate value of the rings reference point. The area of the stope section in square metres. The volume of the stope in cubic metres. Calculated as stope area multiplied by the ring burden value. The rock mass is calculated as the rock volume multiplied by the density value of the ring. The indicated break area of the ring. This is an interpreted shape that provides an indication of the broken rock area after the ring is fired. The break volume is calculated as the indicated break area multiplied by the burden value of the ring. The break mass is calculated as the break volume multiplied by the specific gravity value of the primary element being mined. The explosive volume is total volume of all charges used in the ring. The explosive mass is total explosive mass of all charges in the ring. Powder factor on volume is calculated as the explosive mass divided by the break volume. Powder factor on mass is calculated as the explosive mass divided by the break mass. Tonnes per metre is the break mass divided by the total length of all holes in the ring. Tonnes per metre drilled is the break mass divided by the total drilled or actual length of all holes in the ring. The hole ID. The pivot ID. The length of the hole in metres. The break-through status of the hole. Either ticked/yes or unticked/no. The hole diameter expressed in metres. Note that if the hole diameter is used outside of the holes table section of the plot then only the diameter of the first hole of the ring is used. The dump value for the hole. This will be the same as the ring dump value unless the ring viewing direction as been reversed in which case it will be 180 subtract the raw dump value. The raw dip angle for the hole. Raw dip angles are measure clockwise with zero degrees orientated upwards. Note that if the ring view direction is reversed then the angle is expressed as 360 subtract the raw angle. The hole bearing value. This is the same as the ring bearing value. The status description of the hole. The enabled status of the hole. Ticked on to be drilled. Note that if the holes enabled status is false then the hole is not considered for any calculations or drawing. The number of rods required for the hole expressed in metres. The distance of the collar to the drive floor. Calculated as the vertical distance from the collar to the lowest point on the floor. The distance of the collar to the reference point. Calculated as the actual distance between the points. The distance between collars. Note the first collar in the ring will have a value of zero. The distance of the collar to the left wall of the drive. Note that intersection point on the wall is taken at half the drive height to provide a meaningful result. The distance of the collar to the right wall of the drive. Note that intersection point of the wall is taken at half the drive height to provide a meaningful result. The distance of the collar to the closest wall of the drive. Note that intersection point of the wall is taken at half the drive height to Page 6 of 47
7 collar distance to pivot pivot distance to left wall pivot distance to right wall pivot distance to closest wall pivot distance to reference point hole drilled shift date hole drilled shift hole drilled rig hole drilled bt hole drilled metres hole drilled variance hole number of charges charge from charge to charge explosive charge length charge sequence charge delay charge primers charge explosive mass hole charged number of charges hole charged shift date hole charged shift hole charged depth from hole charged depth to hole charged explosive hole charged delay hole charged primers hole charged sequence no hole charged bt rig name provide a meaningful result. The distance of the collar to the pivot point. The distance of the pivot point to the left wall of the drive. Note that intersection point of the wall is taken at half the drive height to provide a meaningful result. The distance of the pivot point to the right wall of the drive. Note that intersection point of the wall is taken at half the drive height to provide a meaningful result. The distance of the pivot to the closest wall of the drive. Note that intersection point of the wall is taken at half the drive height to provide a meaningful result. The distance of the pivot point to the rings reference point. The date the hole was drilled. The shift that drilled the hole, ie day shift, night shift. The drilling rig that was used to drill the hole. Whether the drilled hole had a break through. The actual length of the drilled hole. The difference between the designed length of the hole and the actual drilled length. Positive values indicate the hole was drilled longer while negative values indicate the hole was shorter than designed. The number of charge segments applied to the hole The start position of the charge measured from the hole collar. The end position of the charge measured from the hole collar. The explosive type used for the charge. The length of the charge. The delay in milliseconds to be applied to the charge. The sequence number of the charge. The primer / detonator positions in the charge. The charge may have a number of primers which are comma separated. A system setting determines if primer positions are measures from the hole toe or collar. The explosive mass of the charge. Calculated as the charge volume multiplied by the specific gravity value of the explosive. The number of charge segments actually used when charging the hole. The date the hole was charged. The shift that charged the hole, ie day shift, night shift. The starting depth for the charge. The ending depth for the charge. The explosive type used in the charge. The primer delay for the charge. The actual primer positions used when charging. The sequence number assigned to the charge. Whether the hole being charged has broken through. The name of the rig. Page 7 of 47
8 rig dump type rig dip type rig laser offset distance rig rod length rig dump angle rig dip angle custom function no value The method used by the rig to measure the dump angle. The method used by the rig to measure the hole dip angle. The laser offset value for the rig. The rod length value for the rig. The dump angle for the rig. Note that this is raw dump angle converted to a rig angle as described by the rig dump measurement method. The hole dip angle for the rig. Note that this is raw dip angle converted to a rig angle as described by the rig dip measurement method. Execute a custom function to produce a value for reporting. Please see the documentation regarding writing custom ring value functions for further information. No value is required in this position. This will leave blank space on the plot in the designated position. Page 8 of 47

9 Ring Reports (Drill & Charge Plans) Overview A ring or charge report is broken into a number of sections as shown in the example below. The Report Designer interface is broken into a number of sections that correspond to the sections of the report as described above. Each section will provide options to modify and customise the report to suite your requirements and preferences. Page 9 of 47

10 General Tab The general section allows you to change the name and description of the report along with the colour for lines drawn on the title block. Do not modify the plot size as the original template is designed to either A4 or A3 size. Report Name Report description Plot Size Colour for title block lines Pen The name to save the report as, ie Charging A brief description for the report Do not change as the template is designed for a particular page size Colour to draw title block lines EzyRings will automatically select the closest pen to the colour selected Page 10 of 47

11 Report Header The report header section permits you to change the actual text that appears in the report header and the date format to use. Report headings Report label Report name Date label Date format Select the font details, height and colour to use for the report heading The text to use for the report label, ie Report The name of the report to appear on the report The text to use for the date label, ie Date Select the date format to use Page 11 of 47

12 Ring Details The Ring details section of the report provides for 9 sections of information pertaining to the ring. If you do not require all 9 positions to be filled leave the label blank and set the value browser to no value. This will leave a blank area in the title block. Ring labels Ring data values Label Data value / decimals Select the font details, height and colour to use for the information labels, ie Stope Select the font details, height and colour to use for the information labels, ie burden The text used to describe the information to be printed Using the value browser select the information required and the number of decimal places to use Page 12 of 47

13 Holes Table The holes table section allows you to design the headings, content, and column widths for the table containing the drill hole / charge data. Note at the bottom of the form buttons to insert and remove columns. The table outline displayed is updated as your modify it. Also note the total width of your currently defined columns is shown against the available width of the report. You must ensure these values match after designing the table. Page 13 of 47
14 Hole table headings Hole table content No. Heading Lines Merge heading Column heading Column value Column width (cm) Alignment Select the heading alignment in the column along with the font details, height and colour to use for the headings of the table Select the font details, height and colour to use for the content in the table The hole table can have 1 or 2 heading lines When using 2 heading lines the top line for the particular column can be merged to the next column. See above example where columns 3 to 10 are merged with a common heading; Charge. The column that begins the merge contains the text for the heading. The heading text for the column. When using 2 heading lines then the second text entry box will be active for the second line of the heading. Using the value browser select the information required and the number of decimal places to use for this particular column. If you require a blank column for the driller to fill out set the value browser to no value Enter the width in centimetres for the column. Note the total of all columns at the bottom of the form. You will be notified if you exceed the total with available, Select how you would like the data positioned in the column, either centred or left Page 14 of 47
 Up to 6 lines can be reserved for")
15 Notes Section Special notes can be included onto the report at print time. These can be selected from a list of predefined notes or simply typed into the Reports Centre when generating the report (see Reports Centre for further information) Up to 6 lines can be reserved for additional notes to be included onto the report. If you do not require a notes section set the number of notes to 0. Note font styles Notes section heading label Number of lines for notes Select the font details, height and colour to use for the notes added to the report at printing time. An example note maybe Primers measured from toe Enter the text for the section heading, ie Notes: You can select between 0 and 6 lines for notes on your report. Selecting 0 will eliminate the notes section from the report. The holes table section will be given space not required for the notes section Page 15 of 47

16 Approvals Section The approvals section is for specific position holders, (eg Senior Engineer) to sign to indicate approval of the drill/ charge plan. Up to 9 approval titles can be included. The approval titles can be spaced on each line by setting the number per line at 1, 2, or 3. If you do not require an approvals section set the number of approvals to 0. Approvals font styles Approvals section heading label Number of approvals / signatures required Approvals per line Approval titles Select the font details, height and colour to use for the approval names. For example Snr Engineer Enter the text for the section heading, ie APPROVALS: or SIGNATURES You can select between 0 and 9 approvals. Selecting 0 will eliminate the approvals section from the report. Enter the number of lines to allocate for the approvals. As an example if you have 4 approvals and allocate 2 lines then the first and second approvals would be on line one with the third and forth on line 2. Enter the text for each job title which must approve the design Page 16 of 47

17 Plot Details The plot details section allows for 7 bits of information to be included onto the report. The intention of this section is that it contains details relating to the plot drawing such as scale, bearing, etc. If you do not require all 7 positions to be filled leave the label blank and set the value browser to no value. This will leave a blank area in the title block. Labels Ring data values Label & Data value /Decimals Select the font details, height and colour to use for the labels of the data values Select the font details, height and colour to use for the actual data vales Enter the label text and using the value browser select the information required and the number of decimal places to use. If you want a blank space set the value browser to no value Page 17 of 47
18 Dump Indicator At present the dump indicator section only has an option for the title of the section. Further options may be added in the future. Dip Indication At present the dip indicator only has an option for the title of the section. Further options may be added in the future. Overview Plan At present the overview plan section has no customisable settings. Further options may be added in the future. Plot Drawing The plot drawing section defines what is drawn onto the drawing space of the report. Select the information to be drawn by selecting the appropriate checkboxes. Note that the drawing styles (line types, symbols, colours, etc) are defined in the EzyRings configuration section. There are a larger number of drawing styles available and you can also define your own custom Surpac plot entities to draw features on the plot. A discussion on setting drawing styles follows later in this document. The name of the drilling drive and stope can be included on the plot. Use the checkboxes at the bottom of the form to turn these features on or off. The labels by default are placed at the centroid of the drive or stope. You can offset this position by specifying offsets (in metres) from the centroid. Negative X offset to move the label left and positive X offset to move the label right. Negative Y offset to move the label up or positive Y offset to move the label down. Page 18 of 47

19 Page 19 of 47
 from the bottom left corner of the title block. Right click on the table to add or remove rows.")
20 Text and Images Constant text can be inserted into fixed positions on the plot, ie PLAN NOT VALID UNTIL APPROVED. Specify the text and the position on the plot along with text attributes. The position is measured in centimetres (cm) from the bottom left corner of the title block. Right click on the table to add or remove rows. Pictures from image files like jpeg, gif, png, etc can be included onto the plot, ie a caution symbol. Specify the image file along with the position on the plot and the width and height. Position, width, and height are measured in centimetres (cm). The image position is measured from the bottom left corner of the title block. Right click on the table to add or remove rows. Page 20 of 47
21 Drive Reports (Collar Markup Plan) Overview The collar markup report shows the rings laid out in plan view. There are a number of options for what is drawn on the plot such as laser lines, ring lines, collar & pivot positions. A string file for survey to markup can also be produced when the collar markup report is run. The survey markup file also has options on what to include such as sequence of collars & toes, ring plane, and pivots. There are two basic templates for the collar markup, complex and simple. Examples Follow: Complex Collar Markup The complex style contains a strip title block similar to the ring / charge plan reports. With this style you can customise the information and layout to suite the requirements of the mine. Each section is described in detail following. Page 21 of 47
22 Collar Markup Simple The simple style contains a standard title block that can be anchored to any corner of the plot. When the report is run a form will appear allowing the entry of two lines for the plot title. A third style can also be made were your provide your own title block. You can place any number of prompts in the title block and a form containing these prompts will appear when you run the report. Page 22 of 47
, and include additional level files onto the plot to show floor strings.")
23 Including Additional Strings & Create Survey Markup When the collar markup report is run through the Reports Centre a form will appear as shown. This is to allow you to input the title block description (only for simple style), and include additional level files onto the plot to show floor strings. You also nominate whether to create a survey markup string file and name it. Line 1,2, & 3 String filename String Plot style Colour Pen Reverse laser lines Create survey markup file Use custom drawing styles Only used form collar markup simple style. Enter the description to appear in the title block of the report. Optional input used to include data from a string file onto the plot. Usually this would be a level file to show the floor outline. Enter the string number or range of strings from the file to include. Enter the Surpac plot entity used to draw the string(s) on the plot. Enter the colour to draw the string with EzyRings will automatically select the closest pen to the colour selected Not usually used!. On occasions geometry will cause laser lines to be placed on the wrong side of the ring. Check this option to force the lines to the opposite side. Select to create the survey markup string file. The default name can be changed as well Select only if you which to change the default drawing styles for the survey markup file Page 23 of 47

24 General Tab The general section allows you to change the name and description of the report along with the colour for lines drawn on the title block. Do not modify the plot size as the original template is designed to either A4 or A3 size. Report Name Report description Plot Size Colour for title block lines Pen The name to save the report as, ie Collar Markup A brief description for the report Do not change as the template is designed for a particular page size Colour to draw title block lines EzyRings will automatically select the closest pen to the colour selected Page 24 of 47

25 Title block style Title block corner cm (total width for the title block) Your title block Do not change as the template is designed for either complex or simple. If you are using your own title block start with the simple template and then set to Custom Only for simple style. Select corner to place the title in Only for simple style. Enter the width in cm for the title block Custom style only. Select your title block from the list Report Header The report header section permits you to change the actual text that appears in the report header and the date format to use. Report headings Report label Report name Date label Date format Select the font details, height and colour to use for the report heading The text to use for the report label, ie Report The name of the report to appear on the report The text to use for the date label, ie Date Select the date format to use Page 25 of 47

26 Drive Details The Drive details section of the report provides for 6 sections of information pertaining to the drive. If you do not require all 6 positions to be filled leave the label blank and set the value browser to no value. This will leave a blank area in the title block. Drive labels Drive data values Label Data value / decimals Select the font details, height and colour to use for the information labels, ie Stope Select the font details, height and colour to use for the data values, ie burden The text used to describe the information to be printed Using the value browser select the information required and the number of decimal places to use Page 26 of 47

27 Rings Table The rings table section allows you to design the headings, content, and column widths for the table containing the ring data. Note at the bottom of the form buttons to insert and remove columns. The table outline displayed is updated as your modify it. Also note the total width of your currently defined columns is shown against the available width of the report. You must ensure these values match after designing the table. Page 27 of 47
28 Ring table headings Ring table content No. Heading Lines Merge heading Column heading Column value Column width (cm) Alignment Last row Select the heading alignment in the column along with the font details, height and colour to use for the headings of the table Select the font details, height and colour to use for the content in the table The hole table can have 1 or 2 heading lines When using 2 heading lines the top line for the particular column can be merged to the next column. The column that begins the merge contains the text for the heading. The heading text for the column. When using 2 heading lines then the second text entry box will be active for the second line of the heading. Using the value browser select the information required and the number of decimal places to use for this particular column. If you require a blank column for the driller to fill out set the value browser to no value Enter the width in centimetres for the column. Note the total of all columns at the bottom of the form. You will be notified if you exceed the total with available, Select how you would like the data positioned in the column, either centred or left You have the option to set the last row in a column to be either Blank, Count, or Total. Blank will leave the last row of the column blank. Count will count all items in the column, ie if there where 10 rings then the count will be 10. Total will add all values in the column to provide a total amount. Page 28 of 47
 Up to 6 lines can be reserved for")
29 Notes Section Special notes can be included onto the report at print time. These can be selected from a list of predefined notes or simply typed into the reports centre when generating the report (see reports centre for further information) Up to 6 lines can be reserved for additional notes to be included onto the report. If you do not require a notes section set the number of notes to 0. Note font styles Notes section heading label Number of lines for notes Select the font details, height and colour to use for the notes added to the report at printing time. An example note maybe Laser lines at 1.6m Enter the text for the section heading, ie Notes: You can select between 0 and 6 lines for notes on your report. Selecting 0 will eliminate the notes section from the report. The holes table section will be given space not required for the notes section Page 29 of 47

30 Approvals Section The approvals section is for specific position holders, (eg Senior Engineer) to sign to indicate approval of the collar markup plan. Up to 9 approval titles can be included. The approval titles can be spaced on each line by setting the number per line at 1, 2, or 3. If you do not require an approvals section set the number of approvals to 0. Approvals font styles Approvals section heading label Number of approvals / signatures required Approvals per line Approval titles Select the font details, height and colour to use for the approval names. For example Snr Engineer Enter the text for the section heading, ie APPROVALS: or SIGNATURES You can select between 0 and 9 approvals. Selecting 0 will eliminate the approvals section from the report. Enter the number of lines to allocate for the approvals. As an example if you have 4 approvals and allocate 2 lines then the first and second approvals would be on line one with the third and forth on line 2. Enter the text for each job title which must approve the design Page 30 of 47
 are defined in the EzyRings configuration section.")
31 Plot Drawing The plot drawing section defines what is drawn onto the drawing space of the report. Select the information to be drawn by selecting the appropriate checkboxes. Note that the drawing styles (line types, symbols, colours, etc) are defined in the EzyRings configuration section. There are a larger number of drawing styles available and you can also define your own custom Surpac plot entities to draw features on the plot. A discussion on setting drawing styles follows later in this document. A plot grid can be included by selecting the plot grid checkbox. You must provide the grid interval distance to use for the grid. An option exists to either trim laser and grid lines to the floor outline or simply extend them by a nominated distance either side from the reference line. A string file for survey markup can also be produced when the collar markup report is run. You can nominate under the Survey Markup Features section which additional features are required for survey to markup the rings. Example survey markup string file: Page 31 of 47

32 Plot Drawing Include a plot grid Grid Interval Trim laser/ring lines to floor outline Extend laser/ring lines from the refline by Collars & Toes Pivot markup points Ring plane box Select the features to be plotted on the report Select to include a plot grid onto the report Nominate the appropriate grid interval distance Select to trim laser and ring lines to the floor outline Select to extend laser and ring lines a nominated distance either side of the reference line Select to include a string of collar toe sequences for each ring into the survey markup string file Select to include adjusted pivot markup points into the survey markup string file. The adjusted pivot point is the pivot point moved so it is parallel with the reference point Select to include a string indicating the ring plane for each ring into the survey markup string file Page 32 of 47
 from the bottom left corner of the title block. Right click on the table to add or remove rows.")
33 Text and Images Constant text can be inserted into fixed positions on the plot, ie PLAN NOT VALID UNTIL APPROVED. Specify the text and the position on the plot along with text attributes. The position is measured in centimetres (cm) from the bottom left corner of the title block. Right click on the table to add or remove rows. Pictures from image files like jpeg, gif, png, etc can be included onto the plot, ie a caution symbol. Specify the image file along with the position on the plot and the width and height. Position, width, and height are measured in centimetres (cm). The image position is measured from the bottom left corner of the title block. Right click on the table to add or remove rows. Page 33 of 47

34 Stope Reports Overview A number of stope report templates are provided as follows Stope summary Designed Stope summary charged Scheduling Report Designed versus drilled metres Using the value browser to select items to report on, you can create any number of reports specific to the mines requirements from these four templates as the start point. Stope reports are created as Excel spreadsheets. Note that the Excel interface requires the Surpac V6.7 or later. Stope reports are broken into the following sections. Page 34 of 47

35 General Tab The general section allows you to change the name and description of the report. Report Name Report description The name to save the report as, ie Collar Markup A brief description for the report Page 35 of 47
36 Report Header The report header section permits you to change the actual text that appears in the report header and the date format to use. Report headings Report label Report name Date label Date format Select the font details, height and colour to use for the report heading The text to use for the report label, ie Report The name of the report to appear on the report The text to use for the date label, ie Date Select the date format to use Page 36 of 47
37 Sub Heading The sub heading section of the report allows you to assign heading information when the stope and/or drive changes when processing information from the database. You can assign fixed text of use the following special syntax (available from the drop down list) <stope_name> <drive_name> <ring_name> <stope_name><drive_name> <stope_name><drive_name><ring_name> <drive_name><ring_name> Where <stope_name> is replaced by the actual stope name at report time <drive_name> is replaced by the actual drive name at report time <ring_name> is replaced by the actual ring name at report time Sub heading Heading label Sub heading Select the font details, height and colour to use for the sub heading Enter any prefix text for the sub heading Select the required naming convention or enter fixed text for your sub heading Page 37 of 47

38 Table Details The table details section allows you to design the headings and content for the table containing the data. Note at the bottom of the form buttons to insert and remove columns. The table outline displayed is updated as your modify it. Column widths are adjusted automatically to fit the data. Table headings Table content No. Heading Lines Merge heading Column heading Column value Alignment Last row Select the heading alignment in the column along with the font details, height and colour to use for the headings of the table Select the font details, height and colour to use for the content in the table The table can have 1 or 2 heading lines When using 2 heading lines the top line for the particular column can be merged to the next column. The column that begins the merge contains the text for the heading. The heading text for the column. When using 2 heading lines then the second text entry box will be active for the second line of the heading. Using the value browser select the information required and the number of decimal places to use for this particular column. If you require a blank column set the value browser to no value Select how you would like the data positioned in the column, either centred, left, or right You have the option to set the last row in a column to be either Blank, Count, or Total. Blank will leave the last row of the column blank. Count will count all items in the column. Total will add all values in the column to provide a total amount. Page 38 of 47


39 Drawing Styles (lines, symbols, colours, etc) EzyRings uses the configuration details to determine how draw lines and symbols. The configuration items are used by both the reporting system and the database viewer to maintain consistency. Most items can be found under the system settings menu and explosive styles under the Explosive settings menu. Page 39 of 47

40 System Configuration The system configuration allows many of EzyRings settings to be adjusted. These settings are used throughout the design, database, and reporting functions. Hole Ids Element Settings Break Area Settings Name Line Style Width Colour Plot Pen Fill Style Fill Colour Plot Pen Custom Style Select either letters or numbers for hole ids Nominate the density attribute name and primary attribute (what are you mining). Burden should not be changed Set the system wide break area interpretations The name of the feature. Read only The style to draw the line with. The drop down list contains a number of line styles. Set to none if you don not want the feature drawn The width to draw the line in. Measured in millimetres. The colour used to draw the line EzyRings will automatically select the closest pen to the colour selected. If the feature is a closed polygon you can nominate a fill style to draw it with. Nominate any standard Surpac fill style or select none to leave the feature inside blank The colour to use for the fill style EzyRings will automatically select the closest pen to the colour selected. See section below on custom plotting styles Page 40 of 47
 select the symbol to represent in from the drop down list.")
41 Name Symbol Width Colour Plot Pen Custom Style Charge Symbol Width Charge colours The name of the feature. Read only If the feature is single point (not a polygon) select the symbol to represent in from the drop down list. Enter the width of the symbol in millimetres The colour to draw the symbol in EzyRings will automatically select the closest pen to the colour selected. See section below on custom plotting styles Select the symbol to use for the start and end of a charge. Note that on the start of charge the symbol is unfilled and on the end of charge the symbol in filled. Enter the width of the symbol in millimetres Charge colours a set from the explosive properties settings. Each explosive can be set to a different colour Explosive Properties On the explosive properties form you setup the names and SG for your explosives along with the characteristics to draw them with. Name Line Style SG Colour Width Plot Pen Plot Style The name of the explosive The style to draw the line with. The drop down list contains a number of line styles. Set to none if you don not want the feature drawn The specific gravity value for the explosive The colour used to draw the explosive The width to draw the explosive in. EzyRings will automatically select the closest pen to the colour selected. See section below on custom plotting styles Page 41 of 47


42 Custom Plotting Styles EzyRings automatically creates Surpac plotting entities to match the criteria that you provide in the system settings such as line style and colour. If the automatic drawing styles are not suitable for your purpose then you can define your own custom plotting entity to draw the particular feature with. This requires some knowledge of the Surpac plotting system. To create a custom entity you can either copy one of the EzyRings entities in the plot library and modify it or create a new definition. Make sure you use a unique name as the EzyRings entities are regenerated each time a report is run. The EzyRings entities are prefixed with ER. For further information on plot entities consult the Surpac manual or plotting tutorial. Once you have defined the plot entity you need to enter it into the custom style input for the feature on the system configuration settings form and/or explosive settings form. Once done EzyRings will then use your custom entity to draw the feature on your plots. Page 42 of 47

43 Reports Centre Once you have defined a report definition(s) you then use the Report Centre to produce a DWF plot, an Excel worksheet, and/or an IREDES xml file. The Reports Centre is invoked using the reports icon toolbar. on the main EzyRings Open Database. If you have more than one ring design database use this button to open a different database to report on Print. Use this button to run the selected report Report Designer. Use this button to start the report designer to modify or create a new report Exit. Use this button to cancel the report designer Page 43 of 47

44 Page 44 of 47
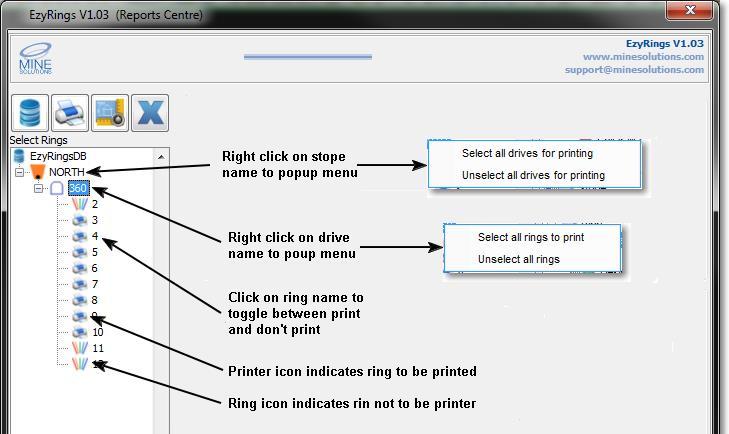
45 Generating DWF Plots To create DWF plot files select the rings you want to plot in the database tree view. Ensure the Create DWF plots checkbox is selected. You can optionally specify a directory to save the DWF files into otherwise the files will be saved into the current work directory. On completion the printer interface form will be displayed where you have the option to preview, print, or create PDF files from your plots. Creating Excel Spreadsheets To create Excel spreadsheets select the rings you want to report on in the database tree view. Ensure the Create Excel Workbooks checkbox is selected. You can optionally specify a directory to save the Excel files into otherwise the files will be saved into the current work directory. The workbooks will be automatically opened in Excel. Note that the Excel interface requires Surpac V6.7 or later. Generating IREDES XML Files To create IREDES XML files select the rings you want to report on in the database tree view. Ensure the Create IREDES data checkbox is selected. You can optionally specify a directory to save the XML files into otherwise the files will be saved into the current work directory. The XML format is slightly different for Atlas Copco and Sandvik drill rigs. Use the drop down list to select your drill rig manufacturer. For Sandvik rigs you can also optionally include the drive outline and stope outline into the XML file. Page 45 of 47
.")
46 Preview, Printing, and PDF generation Once the report centre has created the plots the print/preview reports form is displayed. All plots that have just been created are automatically selected to either preview, print, or create PDF file(s). The print/preview from can be invoked at any time by pressing the printer icon on the main EzyRings toolbar When generating PDF files you have the option to create individual PDF files for each DWF file selected or you can create a single multi-page PDF file of all DWF files selected. In the latter case you must specify the name of the multi-page PDF file to create. The PDF files are saved into the current work directory and displayed in the default PDF viewer. Page 46 of 47


47 When sending the DWF files directly to a printer you must select the printer to print to. The drop down list will contain all available printers on your system. Page 47 of 47
Creating a Survey Memo with FlexiSurv
 Creating a Survey Memo with FlexiSurv Initial Set Up The FlexiSurv extension for Surpac must be installed and either the FlexiSurv menu and/or the FlexiSurv Toolbar displayed so that you can select the
MSO Manual. 4th July 2015
 vcomp Pty Ltd (ABN 39 103 040 311) PO Box 7356 Cloisters Square Perth WA 6850 Australia MSO Manual 4th July 2015 Overview The Mine Survey Office (MSO) application is used to process and create raw files
CPM-200 User Guide For Lighthouse for MAX
 CPM-200 User Guide For Lighthouse for MAX Contents Page Number Opening the software 2 Altering the page size & Orientation 3-4 Inserting Text 5 Editing Text 6 Inserting Graphics 7-8 Changing the Colour
For Microsoft Office XP or Student Workbook. TECHNOeBooks Project-based Computer Curriculum ebooks.
 TECHNOConsultant For Microsoft Office XP or 2003 Student Workbook TECHNOeBooks Project-based Computer Curriculum ebooks www.bepublishing.com Copyright 1993 2010. TechnoKids Inc. in partnership with B.E.
Excel Select a template category in the Office.com Templates section. 5. Click the Download button.
 Microsoft QUICK Excel 2010 Source Getting Started The Excel Window u v w z Creating a New Blank Workbook 2. Select New in the left pane. 3. Select the Blank workbook template in the Available Templates
TIDY LABELS. User Guide
 TIDY LABELS User Guide TIDY LABELS User Guide Contents 1. Overview...3 2. Installation...3 3. Navigating through the application...3 4. Databases...4 4.1 Creating a new database manually...5 4.2 Importing
Working with Charts Stratum.Viewer 6
 Working with Charts Stratum.Viewer 6 Getting Started Tasks Additional Information Access to Charts Introduction to Charts Overview of Chart Types Quick Start - Adding a Chart to a View Create a Chart with
Ms excel. The Microsoft Office Button. The Quick Access Toolbar
 Ms excel MS Excel is electronic spreadsheet software. In This software we can do any type of Calculation & inserting any table, data and making chart and graphs etc. the File of excel is called workbook.
Microsoft Office Excel 2013 Courses 24 Hours
 Microsoft Office Excel 2013 Courses 24 Hours COURSE OUTLINES FOUNDATION LEVEL COURSE OUTLINE Getting Started With Excel 2013 Starting Excel 2013 Selecting the Blank Worksheet Template The Excel 2013 Cell
User Manual Version 1.1 January 2015
 User Manual Version 1.1 January 2015 - 2 / 112 - V1.1 Variegator... 7 Variegator Features... 7 1. Variable elements... 7 2. Static elements... 7 3. Element Manipulation... 7 4. Document Formats... 7 5.
BLASTEC GETTING STARTED
 BLASTEC GETTING STARTED Contents 1. Installation 2. Running the Surface part 3. Running the Tunnel part 1. Installation (Windows 95/98/NT/2000/XP) - Close all active sessions. Please note that hardware
MSO V2.02 Release Notes
 vcomp Pty Ltd (ABN 39 103 040 311) PO Box 7356 Cloisters Square Perth WA 6850 Telephone +618 9312 6158 Fax +618 9312 6158 Release Notes 31 st July 2013 MSO V2 Upgrade Q & A Q. Can I install and use both
Printing spreadsheets is easy. Microsoft Excel has lots of options available so you can print exactly what you want.
 Page Setup and Print Chapter 4 Printing spreadsheets is easy. Microsoft Excel has lots of options available so you can print exactly what you want. Print Preview is available so that you can check how
13 FORMATTING WORKSHEETS
 13 FORMATTING WORKSHEETS 13.1 INTRODUCTION Excel has a number of formatting options to give your worksheets a polished look. You can change the size, colour and angle of fonts, add colour to the borders
The Menu and Toolbar in Excel (see below) look much like the Word tools and most of the tools behave as you would expect.
 look much like the Word tools and most of the tools behave as you would expect.") Launch the Microsoft Excel Program Click on the program icon in Launcher or the Microsoft Office Shortcut Bar. A worksheet is a grid, made up of columns, which are lettered and rows, and are numbered.
Launch the Microsoft Excel Program Click on the program icon in Launcher or the Microsoft Office Shortcut Bar. A worksheet is a grid, made up of columns, which are lettered and rows, and are numbered.
Step-By-Step Instructions To Create A Simple Single Level Roof
 Tutorial One: Basic Step-By-Step Instructions To Create A Simple Single Level Roof Table of Contents Overview...1 Step 1: Draw the Outline of the Roof...2 Step 2: Construct the Hips, Valleys and Ridges...4
Microsoft Office Excel
 Microsoft Office 2007 - Excel Help Click on the Microsoft Office Excel Help button in the top right corner. Type the desired word in the search box and then press the Enter key. Choose the desired topic
EXCEL 2007 GETTING STARTED
 EXCEL 2007 GETTING STARTED TODAY S DESTINATION Quick Access Toolbar Customize it! Office Button Click Excel Options BREAK DOWN OF TABS & RIBBON Tab Name Contains Information relating to Contains the following
Excel 2016 Basics for Mac
 Excel 2016 Basics for Mac Excel 2016 Basics for Mac Training Objective To learn the tools and features to get started using Excel 2016 more efficiently and effectively. What you can expect to learn from
BusinessObjects Frequently Asked Questions
 BusinessObjects Frequently Asked Questions Contents Is there a quick way of printing together several reports from the same document?... 2 Is there a way of controlling the text wrap of a cell?... 2 How
How to Create Custom Name Badge Inserts with a Mail Merge in Microsoft Word 2007
 Many people know that you can use the Mail Merge feature in Microsoft Word 2007 to easily create mailing labels, but did you know you can use it to quickly create custom name badge inserts? Here, you will
eschoolplus+ Cognos Query Studio Training Guide Version 2.4
 + Training Guide Version 2.4 May 2015 Arkansas Public School Computer Network This page was intentionally left blank Page 2 of 68 Table of Contents... 5 Accessing... 5 Working in Query Studio... 8 Query
Learning Map Excel 2007
 Learning Map Excel 2007 Our comprehensive online Excel tutorials are organized in such a way that it makes it easy to obtain guidance on specific Excel features while you are working in Excel. This structure
WEEK NO. 12 MICROSOFT EXCEL 2007
 WEEK NO. 12 MICROSOFT EXCEL 2007 LESSONS OVERVIEW: GOODBYE CALCULATORS, HELLO SPREADSHEET! 1. The Excel Environment 2. Starting A Workbook 3. Modifying Columns, Rows, & Cells 4. Working with Worksheets
EXCEL 2003 DISCLAIMER:
 EXCEL 2003 DISCLAIMER: This reference guide is meant for experienced Microsoft Excel users. It provides a list of quick tips and shortcuts for familiar features. This guide does NOT replace training or
Excel 2007 Tutorials - Video File Attributes
 Get Familiar with Excel 2007 42.40 3.02 The Excel 2007 Environment 4.10 0.19 Office Button 3.10 0.31 Quick Access Toolbar 3.10 0.33 Excel 2007 Ribbon 3.10 0.26 Home Tab 5.10 0.19 Insert Tab 3.10 0.19 Page
The American University in Cairo. Academic Computing Services. Excel prepared by. Maha Amer
 The American University in Cairo Excel 2000 prepared by Maha Amer Spring 2001 Table of Contents: Opening the Excel Program Creating, Opening and Saving Excel Worksheets Sheet Structure Formatting Text
HOUR 12. Adding a Chart
 HOUR 12 Adding a Chart The highlights of this hour are as follows: Reasons for using a chart The chart elements The chart types How to create charts with the Chart Wizard How to work with charts How to
Query Studio Training Guide Cognos 8 February 2010 DRAFT. Arkansas Public School Computer Network 101 East Capitol, Suite 101 Little Rock, AR 72201
 Query Studio Training Guide Cognos 8 February 2010 DRAFT Arkansas Public School Computer Network 101 East Capitol, Suite 101 Little Rock, AR 72201 2 Table of Contents Accessing Cognos Query Studio... 5
Excel 2016 Basics for Windows
 Excel 2016 Basics for Windows Excel 2016 Basics for Windows Training Objective To learn the tools and features to get started using Excel 2016 more efficiently and effectively. What you can expect to learn
Quick Start Guide. ASR Automated Systems Research Inc. Toll free: Fax:
 Quick Start Guide ASR Automated Systems Research Inc. Toll free: 1-800-818-2051 Phone: 604-539-0122 e-mail: support@asrsoft.com Fax: 604-539-1334 www.asrsoft.com Copyright 1991-2014 ASR Automated Systems
NiceForm User Guide. English Edition. Rev Euro Plus d.o.o. & Niceware International LLC All rights reserved.
 www.nicelabel.com, info@nicelabel.com English Edition Rev-0910 2009 Euro Plus d.o.o. & Niceware International LLC All rights reserved. www.nicelabel.com Head Office Euro Plus d.o.o. Ulica Lojzeta Hrovata
PART ONE 1. LAYOUT. A file in Excel is called a Workbook. Each Workbook is made up of Worksheets (usually three but more can be added).
.") PART ONE 1. LAYOUT A file in Excel is called a Workbook. Each Workbook is made up of Worksheets (usually three but more can be added). The work area is where the data and formulae are entered. The active
PART ONE 1. LAYOUT A file in Excel is called a Workbook. Each Workbook is made up of Worksheets (usually three but more can be added). The work area is where the data and formulae are entered. The active
Excel 2007 Fundamentals
 Excel 2007 Fundamentals Introduction The aim of this document is to introduce some basic techniques for using Excel to enter data, perform calculations and produce simple charts based on that information.
Section 2 Customisation and Printing
 Level 6 Spreadsheet 6N4089 Section 2 Customisation and Printing Contents 1. Customise Toolbars and Create Custom Menus... 2 Recognise the Features Available on Toolbars... 2 Display or Hide the Ribbon...
CONTASign Pro User Manual
 CONTASign Pro User Manual CONTASign PRO MANUAL v3.5 rev01 Page 1 of 51 CONTA-CLIP Contents Page No. 1. Main Window Layout 4 - Window Layout Customisation 5 - Window Configuration 6 2. Start Menu & Quick
Excel Level 1: Beginner. Get started in Excel. Look good with easy formatting. Set out your first Excel calculations. Increase your efficiency
 Excel 2010 Level 1: Beginner Learning basic skills for Excel 2010 Estimated time: 04:05 6 modules - 49 topics Get started in Excel Discover Excel and carry out simple tasks: opening a workbook saving it,
Converting Your PDFs to Excel
 Converting Your PDFs to Excel Easy 3-Step Guide STEP 1: OPEN YOUR PDF Select the Open... command from the File menu. STEP 3: CONVERTING TO EXCEL After selecting, you are ready for conversion. For conversions
Excel 2010 Tutorials - Video File Attributes
 Get Familiar with Excel 2010 42.30 2.70 The Excel 2010 Environment 4.10 0.18 Quick Access Toolbar 3.10 0.27 Excel 2010 Ribbon 3.10 0.26 File Tab 3.10 0.28 Home Tab 5.10 0.17 Insert Tab 3.10 0.18 Page Layout
MICROSOFT EXCEL BIS 202. Lesson 1. Prepared By: Amna Alshurooqi Hajar Alshurooqi
 MICROSOFT EXCEL Prepared By: Amna Alshurooqi Hajar Alshurooqi Lesson 1 BIS 202 1. INTRODUCTION Microsoft Excel is a spreadsheet application used to perform financial calculations, statistical analysis,
Document Editor Basics
 Document Editor Basics When you use the Document Editor option, either from ZP Toolbox or from the Output option drop-down box, you will be taken to the Report Designer Screen. While in this window, you
PowerPoint Level 2 (Advancing your knowledge)
") Using the Outline Tab When you are creating a presentation, entering text in Outline View allows you to concentrate on the content and not be distracted by formatting, graphics and layout. 1. Select the
Using the Outline Tab When you are creating a presentation, entering text in Outline View allows you to concentrate on the content and not be distracted by formatting, graphics and layout. 1. Select the
System Tools Manual. 10th November 2015
 vcomp Pty Ltd (ABN 39 103 040 311) PO Box 7356 Cloisters Square Perth WA 6850 Australia Manual 10th November 2015 Overview is collection of visual editors that allow the everyday Surpac user to leverage
Microsoft Excel 2010 Handout
 Microsoft Excel 2010 Handout Excel is an electronic spreadsheet program you can use to enter and organize data, and perform a wide variety of number crunching tasks. Excel helps you organize and track
Excel Foundation Quick Reference (Windows PC)
") Excel Foundation Quick Reference (Windows PC) See https://staff.brighton.ac.uk/is/training/pages/excel/foundation.aspx for videos and exercises to accompany this quick reference card. Structure of a spreadsheet
Excel Foundation Quick Reference (Windows PC) See https://staff.brighton.ac.uk/is/training/pages/excel/foundation.aspx for videos and exercises to accompany this quick reference card. Structure of a spreadsheet
Getting Started with. Office 2008
 Getting Started with Office 2008 Copyright 2010 - Information Technology Services Kennesaw State University This document may be downloaded, printed, or copied, for educational use, without further permission
Solo 4.6 Release Notes
 June9, 2017 (Updated to include Solo 4.6.4 changes) Solo 4.6 Release Notes This release contains a number of new features, as well as enhancements to the user interface and overall performance. Together
Workshop on Census Data Processing. TELEform Designer User Manual
 Workshop on Census Data Processing TELEform Designer User Manual Contents TELEFORM MODULES... 1 TELEFORM DESIGNER MODULE... 1 FORM TEMPLATES... 1 Available Form Templates... 2 THE DESIGNER WORKSPACE...
Excel Tutorials - File Size & Duration
 Get Familiar with Excel 46.30 2.96 The Excel Environment 4.10 0.17 Quick Access Toolbar 3.10 0.26 Excel Ribbon 3.10 0.26 File Tab 3.10 0.32 Home Tab 5.10 0.16 Insert Tab 3.10 0.16 Page Layout Tab 3.10
blast simulation evaluation and management User Manual
 blast simulation evaluation and management User Manual Copyright JKTech 1998, Soft-Blast 2006 All rights reserved. Both the software and documentation of JKSimBlast, 2DBench, 2DRing, 2DFace, JKBMS, 2DView,
Stamina Software Pty Ltd. TRAINING MANUAL Viságe Reporter
 Stamina Software Pty Ltd TRAINING MANUAL Viságe Reporter Version: 2 21 st January 2009 Contents Introduction...1 Assumed Knowledge...1 Pre Planning...1 Report Designer Location...2 Report Designer Screen
MINI-CAD HEADER CAD VERSION 9
 Integrated 2D CAD system for additional annotation of GGU application graphics MINI-CAD HEADER CAD VERSION 9 Last revision: January 2019 Copyright: Prof. Dr. Johann Buß Technical implementation, layout
Using Microsoft Word. Working With Objects
 Using Microsoft Word Many Word documents will require elements that were created in programs other than Word, such as the picture to the right. Nontext elements in a document are referred to as Objects
LinkMotion and CorelDraw 9, 10, 11, 12, X3, X4, X5, X6, X7 and X8:
 LinkMotion and CorelDraw 9, 10, 11, 12, X3, X4, X5, X6, X7 and X8: After you install LinkMotion software and set up all settings launch CorelDraw software. Important notes: Solustan s LinkMotion driver
PARTS OF A WORKSHEET. Rows Run horizontally across a worksheet and are labeled with numbers.
 1 BEGINNING EXCEL While its primary function is to be a number cruncher, Excel is a versatile program that is used in a variety of ways. Because it easily organizes, manages, and displays information,
Creating Web Pages with SeaMonkey Composer
 1 of 26 6/13/2011 11:26 PM Creating Web Pages with SeaMonkey Composer SeaMonkey Composer lets you create your own web pages and publish them on the web. You don't have to know HTML to use Composer; it
User Manual Mail Merge
 User Manual Mail Merge Version: 1.0 Mail Merge Date: 27-08-2013 How to print letters using Mail Merge You can use Mail Merge to create a series of documents, such as a standard letter that you want to
TUTORIAL: CREATING A SCANNABLE SURVEY Part 1: Bubble Publishing Form Shop
 TUTORIAL: CREATING A SCANNABLE SURVEY Part 1: Bubble Publishing Form Shop OVERVIEW Bubble Publishing Form Shop is a tool for designing and printing professional quality, OMR (optical mark read) surveys.
EXCEL TUTORIAL.
 EXCEL TUTORIAL Excel is software that lets you create tables, and calculate and analyze data. This type of software is called spreadsheet software. Excel lets you create tables that automatically calculate
Exporting Data in Version 3.6
 The modern, fast and easy to use risk analysis tool Exporting Data in Version 3.6 BowTie Pro Westhill Business Centre Arnhall Business Park Westhill, Aberdeenshire, AB32 6UF, UK Tel: +44 (0) 1224 51 50
Introduction to Excel 2007
 Introduction to Excel 2007 These documents are based on and developed from information published in the LTS Online Help Collection (www.uwec.edu/help) developed by the University of Wisconsin Eau Claire
ABOUT THIS COURSE... 3 ABOUT THIS MANUAL... 4 LESSON 1: MANAGING LISTS... 5
 Table of Contents ABOUT THIS COURSE... 3 ABOUT THIS MANUAL... 4 LESSON 1: MANAGING LISTS... 5 TOPIC 1A: SORT A LIST... 6 Sort a list in A-Z or Z-A Order... 6 TOPIC 1B: RENUMBER A LIST... 7 Renumber a List
Kenora Public Library. Computer Training. Introduction to Excel
 Kenora Public Library Computer Training Introduction to Excel Page 2 Introduction: Spreadsheet programs allow users to develop a number of documents that can be used to store data, perform calculations,
Excel Basics. TJ McKeon
 Excel Basics TJ McKeon What is Excel? Electronic Spreadsheet in a rows and columns layout Can contain alphabetical and numerical data (text, dates, times, numbers) Allows for easy calculations and mathematical
Chapter 1 : Getting Started with Integrity... Chapter 2 : Interface Layout... Chapter 3 : Navigation... Chapter 4 : Printing...
 .0 User s Manual Table of Contents Chapter : Getting Started with Integrity... Chapter : Interface Layout... Chapter : Navigation... Chapter : Printing... Chapter : Quick Search and Results Pane... Results
Advanced Excel. Click Computer if required, then click Browse.
 Advanced Excel 1. Using the Application 1.1. Working with spreadsheets 1.1.1 Open a spreadsheet application. Click the Start button. Select All Programs. Click Microsoft Excel 2013. 1.1.1 Close a spreadsheet
Create a new document based on default template, other available template like: memo, fax, agenda.
 Word Processing 3 Objectives: Working with Documents Enhancing Productivity Using the Application Open, close a word processing application. Open, close documents. Create a new document based on default
EXCEL BASICS: MICROSOFT OFFICE 2007
 EXCEL BASICS: MICROSOFT OFFICE 2007 GETTING STARTED PAGE 02 Prerequisites What You Will Learn USING MICROSOFT EXCEL PAGE 03 Opening Microsoft Excel Microsoft Excel Features Keyboard Review Pointer Shapes
Version 8 Release Notes
 Version 8 Release Notes www.buildsoft.com.au 8.2.4 Release 30 July 2018 Fixes Fixed an issue where the Total of a Job might be incorrect if any Item was Picked from multiple Quotes that included only INCL
Excel Tutorial 2: Formatting Workbook Text and Data
 Excel Tutorial 2: Formatting Workbook Text and Data Microsoft Office 2013 Objectives Change fonts, font style, and font color Add fill colors and a background image Create formulas to calculate sales data
Staff Microsoft VISIO Training. IT ESSENTIALS Creating Organisation Charts Using Visio 2013 (ST560) August 2015
 August 2015") Staff Microsoft VISIO Training IT ESSENTIALS Creating Organisation Charts Using Visio 0 (ST0) August 0 Book online at: Royalholloway.ac.uk/it/training Self-Study packs also available 9 th August 0 Table
Staff Microsoft VISIO Training IT ESSENTIALS Creating Organisation Charts Using Visio 0 (ST0) August 0 Book online at: Royalholloway.ac.uk/it/training Self-Study packs also available 9 th August 0 Table
ArmCAD 6. reinforced concrete detailing program [updated for Build 2028]
![ArmCAD 6. reinforced concrete detailing program [updated for Build 2028]](/thumbs/89/97716434.jpg "ArmCAD 6. reinforced concrete detailing program [updated for Build 2028]") ArmCAD 6 reinforced concrete detailing program [updated for Build 2028] This user manual explains only new program features and commands that have not been included in ArmCAD 2005, so it is thus primarily
ArmCAD 6 reinforced concrete detailing program [updated for Build 2028] This user manual explains only new program features and commands that have not been included in ArmCAD 2005, so it is thus primarily
COMPUTER TECHNOLOGY SPREADSHEETS BASIC TERMINOLOGY. A workbook is the file Excel creates to store your data.
 SPREADSHEETS BASIC TERMINOLOGY A Spreadsheet is a grid of rows and columns containing numbers, text, and formulas. A workbook is the file Excel creates to store your data. A worksheet is an individual
This section provides an overview of the features available within the Standard, Align, and Text Toolbars.
 Using Toolbars Overview This section provides an overview of the features available within the Standard, Align, and Text Toolbars. Using toolbar icons is a convenient way to add and adjust label objects.
Using Microsoft Excel
 Using Microsoft Excel Formatting a spreadsheet means changing the way it looks to make it neater and more attractive. Formatting changes can include modifying number styles, text size and colours. Many
INTRODUCTION... 1 UNDERSTANDING CELLS... 2 CELL CONTENT... 4
 Introduction to Microsoft Excel 2016 INTRODUCTION... 1 The Excel 2016 Environment... 1 Worksheet Views... 2 UNDERSTANDING CELLS... 2 Select a Cell Range... 3 CELL CONTENT... 4 Enter and Edit Data... 4
Excel 2003 Tutorials - Video File Attributes
 Using Excel Files 18.00 2.73 The Excel Environment 3.20 0.14 Opening Microsoft Excel 2.00 0.12 Opening a new workbook 1.40 0.26 Opening an existing workbook 1.50 0.37 Save a workbook 1.40 0.28 Copy a workbook
SUM - This says to add together cells F28 through F35. Notice that it will show your result is
 COUNTA - The COUNTA function will examine a set of cells and tell you how many cells are not empty. In this example, Excel analyzed 19 cells and found that only 18 were not empty. COUNTBLANK - The COUNTBLANK
In this section you will learn some simple data entry, editing, formatting techniques and some simple formulae. Contents
 In this section you will learn some simple data entry, editing, formatting techniques and some simple formulae. Contents Section Topic Sub-topic Pages Section 2 Spreadsheets Layout and Design S2: 2 3 Formulae
Microsoft Access II 1.) Opening a Saved Database Music Click the Options Enable this Content Click OK. *
 Opening a Saved Database Music Click the Options Enable this Content Click OK. *") Microsoft Access II 1.) Opening a Saved Database Open the Music database saved on your computer s hard drive. *I added more songs and records to the Songs and Artist tables. Click the Options button next
Microsoft Access II 1.) Opening a Saved Database Open the Music database saved on your computer s hard drive. *I added more songs and records to the Songs and Artist tables. Click the Options button next
A Step-by-step guide to creating a Professional PowerPoint Presentation
 Quick introduction to Microsoft PowerPoint A Step-by-step guide to creating a Professional PowerPoint Presentation Created by Cruse Control creative services Tel +44 (0) 1923 842 295 training@crusecontrol.com
Office of Instructional Technology
 Office of Instructional Technology Microsoft Excel 2016 Contact Information: 718-254-8565 ITEC@citytech.cuny.edu Contents Introduction to Excel 2016... 3 Opening Excel 2016... 3 Office 2016 Ribbon... 3
Cell to Cell mouse arrow Type Tab Enter Scroll Bars Page Up Page Down Crtl + Home Crtl + End Value Label Formula Note:
 1 of 1 NOTE: IT IS RECOMMENDED THAT YOU READ THE ACCOMPANYING DOCUMENT CALLED INTRO TO EXCEL LAYOUT 2007 TO FULLY GRASP THE BASICS OF EXCEL Introduction A spreadsheet application allows you to enter data
Layout and display. STILOG IST, all rights reserved
 2 Table of Contents I. Main Window... 1 1. DEFINITION... 1 2. LIST OF WINDOW ELEMENTS... 1 Quick Access Bar... 1 Menu Bar... 1 Windows... 2 Status bar... 2 Pop-up menu... 4 II. Menu Bar... 5 1. DEFINITION...
ECDL Module 4 REFERENCE MANUAL
 ECDL Module 4 REFERENCE MANUAL Spreadsheets Microsoft Excel XP Edition for ECDL Syllabus Four PAGE 2 - ECDL MODULE 4 (USING MICROSOFT EXCEL XP) - MANUAL 4.1 USING THE APPLICATION... 4 4.1.1 FIRST STEPS
Guide to WB Annotations
 Guide to WB Annotations 04 May 2016 Annotations are a powerful new feature added to Workbench v1.2.0 (Released May 2016) for placing text and symbols within wb_view tabs and windows. They enable generation
CostX 6.5 Release Notes
 CostX 6.5 Release Notes Overview CostX version 6.5 is an exciting new development in the Exactal range of world-class digital measurement and estimating software. In addition to many new features and improvements
Roof Wizard. Advanced Software for Roof Modeling and Estimating. Tutorial for Modifying Reports
 Roof Wizard Advanced Software for Roof Modeling and Estimating Tutorial for Modifying Reports Document Issue 1.0.0-25th October 1999 Table of Contents TABLE OF CONTENTS... 2 INTRODUCTION... 2 Using this
LETTER BUILDER. Letter Builder. For RiskMan Version Last reviewed 24 Jun Copyright 2017 Page RiskMan 1 of International 17 Pty Ltd
 Letter Builder For RiskMan Version 16.02 Last reviewed 24 Jun 2016 Copyright 2017 Page RiskMan 1 of International 17 Pty Ltd Contents What does the Letter Builder do?... 3 Examples... 3 Detailed Overview...
Excel 2013 Intermediate
 Instructor s Excel 2013 Tutorial 2 - Charts Excel 2013 Intermediate 103-124 Unit 2 - Charts Quick Links Chart Concepts Page EX197 EX199 EX200 Selecting Source Data Pages EX198 EX234 EX237 Creating a Chart
Tutorial 01 Quick Start Tutorial
 Tutorial 01 Quick Start Tutorial Homogeneous single material slope No water pressure (dry) Circular slip surface search (Grid Search) Intro to multi scenario modeling Introduction Model This quick start
Rev. C 11/09/2010 Downers Grove Public Library Page 1 of 41
 Table of Contents Objectives... 3 Introduction... 3 Excel Ribbon Components... 3 Office Button... 4 Quick Access Toolbar... 5 Excel Worksheet Components... 8 Navigating Through a Worksheet... 8 Making
Publisher 2013 Foundation SAMPLE
 Publisher 2013 Foundation Publisher 2013 Foundation Microsoft Publisher 2013 Foundation - Page 2 2013 Cheltenham Group Pty. Ltd. All trademarks acknowledged. E&OE. No part of this document may be copied
Rich Text Editor Quick Reference
 Rich Text Editor Quick Reference Introduction Using the rich text editor is similar to using a word processing application such as Microsoft Word. After data is typed into the editing area it can be formatted
Configuring Ad hoc Reporting. Version: 16.0
 Configuring Ad hoc Reporting Version: 16.0 Copyright 2018 Intellicus Technologies This document and its content is copyrighted material of Intellicus Technologies. The content may not be copied or derived
Nintex Reporting 2008 Help
 Nintex Reporting 2008 Help Last updated: Thursday, 24 December 2009 1 Using Nintex Reporting 2008 1.1 Chart Viewer Web Part 1.2 Importing and Exporting Reports 1.3 Import Nintex report page 1.4 Item Level
LEICA TCRA1103 INSTRUMENT SETTINGS
 Survey Management System LEICA TCRA1103 INSTRUMENT SETTINGS Revision: draft D Document Owner OLIVER GLOCKNER CONTRACT MINE SURVEYOR Date Originated 11-July-03 Approval Date Deployment Date Archive Date
Microsoft How to Series
 Microsoft How to Series Getting Started with EXCEL 2007 A B C D E F Tabs Introduction to the Excel 2007 Interface The Excel 2007 Interface is comprised of several elements, with four main parts: Office
TSM Report Designer. Even Microsoft Excel s Data Import add-in can be used to extract TSM information into an Excel spread sheet for reporting.
 TSM Report Designer The TSM Report Designer is used to create and modify your TSM reports. Each report in TSM prints data found in the databases assigned to that report. TSM opens these databases according
Dolphin PartMaster Wire EDM
 Dolphin PartMaster Wire EDM Copyright 2000-2017 Dolphin CADCAM Systems Ltd. This document is copyrighted and all rights are reserved. This document may not, in whole or in part, be copied or reproduced