Flicker Comparison of 2D Electrophoretic Gels
|
|
|
- Luke Cannon
- 6 years ago
- Views:
Transcription

1 Flicker Comparison of 2D Electrophoretic Gels Peter F. Lemkin +, Greg Thornwall ++ Lab. Experimental & Computational Biology + National Cancer Institute ++ SAIC-Frederick Frederick, MD, USA lemkin@ncifcrf.gov Revised:
2 Overview Flicker is an open-source stand-alone Java computer program for visually comparing 2D gel electrophoresis images 2D polyacrylamide gel electrophoresis (2D-PAGE) gels are often difficult to compare because of rubber-sheet distortions Flicker allows you to compare your gel images against each other or against those found in Internet databases Many published Internet gels have subsets of spots identified which may make them useful to compare with your gels. 2
3 Main Features of Flicker Flicker allows comparison of two gels at a time Menu system helps organize and access a set of local user gels and access Internet reference database gels Built-in demonstration gels with calibration data Built-in access to Swiss-2DPAGE active map reference gel database. Easily extendible to other federated databases Image enhancement optimizes images - helps support visual comparison: zoom, brightness/contrast, spatialwarping, smoothing, sharpening Build lists of spot measurements for estimating spot quantification and annotation 3
4 Main Features (continued) Calibrate gray scale if OD, CPM, etc. standards are available Export measured spot lists and annotated paired spot lists (to Excel, etc.) Save/restore data-mining sessions Written in Java as open source and is freely available Runs on MS Windows, MacOS-X, Linux, Solaris Documentation available as HTML on the Web site or as PDFs Tutorial vignettes available on using Flicker 4

5 In Table of Contents: * Introduction * Reference Manual * Vignettes * Download * Other Web resources 5

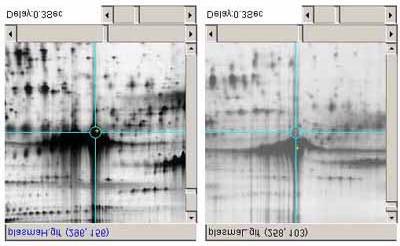
6 Flicker Program User Interface Parameter sliders Flicker window Two scrollable images user specifies 6
7 Concept of Flicker-Comparison Flickering is a dynamic visualization technique If two images could be perfectly aligned then one could simply align them by overlaying one over the other and shifting one image until they line up However, many images such as 2D PAGE gels have non-linear rubber-sheet distortion (i.e., local translation, rotation, and magnification) May be more distortion in some parts of the images than in others Although it may be impossible to align two whole images at one time, they may be locally aligned piece-by-piece by matching the morphology of local regions Alternating two images in the same visual space will fuse the aligned regions in your minds-eye when they are optimally aligned 7
8 Problems with Flicker-Comparison Because flickering is a dynamic visualization technique that depends on hand-eye-brain integration, we find that some people are better at using this technique than others There is the occasional danger of false alignments when comparing charge-trains of spots if there is not enough local morphology context 8
9 Problems with Flicker-Comparison (continued) Because it may be difficult to compare a user s entire gel against an Internet database reference gel (e.g., Swiss- 2DPAGE) which was run in a quite different way: IPG vs CA, linear vs non-linear gradients, pie isoelectric range, MW molecular mass range, etc. However, parts of the gels may be comparable Even when a comparison is made and a putative correspondence made between the user s and the reference gel, the spot of interest may not be identified in the Internet database reference gel 9
10 Solution: Image Transforms for Better Visualization It is difficult to visually compare gels of different magnification, contrast, and geometry Flicker has a zoom transform to magnify or de-magnify a gel so it is closer to the magnification of the other gel Flicker has a brightness-contrast adjustment to adjust one gel to the range of the other gel Flicker has geometric correction using spatial warping transforms Additional image enhancement transforms are available for smoothing and sharpening images to make they 10 easier to compare
11 Finding Putative Identifications by Accessing Reference 2D Web Databases 1. First find a putative match between a user s gel and an active map reference gel 2. The user then clicks on the spot in the reference gel to access that spot s identification in the Internet reference gel database 3. The reference database then supplies the identification of the spot selected and by inference the putative identification of the user s spot 11
12 Finding Putative Identifications by Accessing Reference 2D Web Databases (continued) The active map reference gel must be supported by a federated 2D gel map Internet database such as Swiss-2DPAGE Additional lab work can confirm that putative identification of the spot extracted from their gel 12
 Match")
 Putative ID")
13 Putative Identification - Click on Active Map 1) Match spot 2) Make map active 3) Click on spot 4) Putative ID pops up 13


14 Warping a Gel to Other Gel s Geometry Original Warped 14


15 Zooming a Gel to Other Gel s Magnification Original Zoomed 15

16 Adjusting Brightness/Contrast So Similar Original Adjusted 16
17 Estimating Spot Quantification Flicker provides a limited estimated-spot quantification capability to collect a list of manually measured spots that may be reported and saved for further analysis Integrated density (grayscale or calibrated OD) may be estimated for isolated spots using measurement circle masks (1 to 51 pixels in diameter) Background density, D b, near the spot is measured first Then, an isolated spot s density, D s, is measured and the density corrected for background D' s is estimated as D s - D b Lists of spots may be created with user-supplied annotation 17


18 User Measured Spot Lists 18
19 Spot List Functionality Define, delete, annotate, edit spots in the spot list View spots with various overlay options List spots in report-form or tab-delimited form suitable for export to Excel or other analysis programs List paired-spots reports with same IDs in tab-delimited form Save spot lists for further use when exit Flicker and reload them when reload those gel images 19

20 Manually Annotating Paired Spots 1. Select pairs of spots 2. Assign ID to both spots 20

21 Generate Paired-Spots Reports For Spots with Same IDs 21
22 Looking Up Spot ID Annotation At Reference DB Putatively identify a list of spots in your gel that are identified in an active reference gel by first identifying spots in the reference gel and then using them to identify corresponding spots in your gel. 1. Open 2 gels to compare (let one of them be an active reference gel). 2. Flicker align similar regions for each of the spot(s) of interest. 3. Add spots of interest to spot lists (a separate list for each gel). 4. Request Flicker visit the active reference gel Web server and try to lookup the protein IDs (e.g., Swiss-PROT) for the spots you have defined in the active gel. 5. Then click on corresponding spots in your gel and then pair them using a common annotation id from the reference gel. 6. List the spots in the paired spot list (this can be generated as tabdelimited data for export to Excel). 22

23 Define Reference Gel Spot List 23

24 Look Up Reference Gel Spot ID Annotation 24

25 Assign Reference Gel Annotation to User Gel 25
26 Lookup PIR Database Pages for Identified Proteins Access PIR (pir.georgetown.edu) UniProt, iproclass and iprolink server Web pages for selected proteins in the spot list through their Swiss-Prot accession names. A two-step process enabled using the (Edit Select access to active DB server...) checkbox command to select either SWISS-2DPAGE, UniProt, iproclass or iprolink servers. When you measure a spot (select a spot in an active gel image and add it to the spot list by typing C-M) and are connected to the Internet, it will also lookup the Swiss-Prot protein (accession name and protein id) on the SWISS-2DPAGE server. Then, if you enable "Click to access DB", it will pop up the particular active PIR DB server you have selected. 26

27 PIR UniProt Web Page for Identified Protein 27

28 PIR iproclass Web Page for Identified Protein 28

29 PIR iprolink Web Page for Identified Protein 29
30 Calibrating Grayscale for Better Quantification If the gel s stain/detection method is stoichiometric, then integrated density can correspond to protein concentration in a non-saturating range The scanner and other systematic sources of nonlinearity can be corrected to some degree by calibrating the image against a calibration standard and mapping grayscale to that standard (e.g., optical density, CPM, etc.) Their subsequent spot quantification measurements will then be more accurate 30

31 Calibrating Grayscale with a ND Step-Wedge 1. The ND step wedge must be scanned with the image and the corresponding OD values known for each step ROI over step-wedge 2. A region of interest (ROI) is overlaid on the step stepwedge 3. The ND wedge calibration wizard is invoked to analyze the data and estimate the calibration 31

32 Calibrating Grayscale from ND Wedge Data ROI histogram, peaks found and extrapolated calibration curve OD vs gray-peaks table 32

33 Calibrating Grayscale with a Spot List of Calibrated Data 1. The image must contain calibrated regions with known concentrations or corresponding OD values known for each spot List of spots you defined 2. You define a set of spots using (C-M) or (ALT-click) 3. The Spot List Calibration wizard is invoked to analyze the data and estimate the calibration 33

34 Calibrating Grayscale from Spot List Data OD vs gray-peaks table ROI histogram, peaks found and extrapolated calibration curve 34
35 Summary Flicker is an open-source 2D gel visual image comparison Java program freely available at Useful for visual comparison of 2D gels and other images Putative spot identification made by comparison with reference 2D gel databases Manual creation of lists of estimated quantified spot densities can be exported (to Excel, etc.) 35
Flicker Comparison of 2D Electrophoretic Gels
 Flicker Comparison of 2D Electrophoretic Gels Peter F. Lemkin +, Greg Thornwall ++ Lab. Experimental & Computational Biology + National Cancer Institute ++ SAIC-Frederick Frederick, MD, USA lemkin@ncifcrf.gov
Flicker Comparison of 2D Electrophoretic Gels
 Flicker Comparison of 2D Electrophoretic Gels Peter F. Lemkin +, Greg Thornwall ++ Lab. Experimental & Computational Biology + National Cancer Institute - Frederick ++ SAIC - Frederick lemkin@ncifcrf.gov
Comparing 2D Electrophoretic Gels Across Internet Databases An Open Source Application
 Lemkin-ProteinProtocolsHandbook-3rd-Ed-Chapter-40-Flicker-2009.doc page 1 of 1 Comparing 2D Electrophoretic Gels Across Internet Databases An Open Source Application Peter F. Lemkin 1, Gregory C. Thornwall
TotalLab TL100 Quick Start
 TotalLab TL100 Quick Start Contents of thetl100 Quick Start Introduction to TL100 and Installation Instructions The Control Centre Getting Started The TL100 Interface 1D Gel Analysis Array Analysis Colony
Image Processing Fundamentals. Nicolas Vazquez Principal Software Engineer National Instruments
 Image Processing Fundamentals Nicolas Vazquez Principal Software Engineer National Instruments Agenda Objectives and Motivations Enhancing Images Checking for Presence Locating Parts Measuring Features
CmpSpots - 2D Spot Pairing
 CmpSpots - 2D Spot Pairing http://open2dprot.sourceforge.net/cmpspots Revised: 12-04-2004, P. Lemkin, NCI-Frederick Outline 1. Overview 2. Algorithm 2.1 Landmark sets 2.2 Pairing features dp and dl 2.3
Synoptics Limited reserves the right to make changes without notice both to this publication and to the product that it describes.
 GeneTools Getting Started Although all possible care has been taken in the preparation of this publication, Synoptics Limited accepts no liability for any inaccuracies that may be found. Synoptics Limited
English. Delta2D ANALYZING 2D GELS AS EASY AS POINT AND CLICK EXPLORING LIFE
 Getting started English 2D Western Blots Delta2D ANALYZING 2D GELS AS EASY AS POINT AND CLICK EXPLORING LIFE 2 Copyright DECODON GmbH. DECODON makes no representations, express or implied, with respect
Matthew Baker. Visualisation of Electrophoresis Gels using TEX
 Visualisation of Electrophoresis Gels using TEX 1 Visualisation of Electrophoresis Gels using TEX Matthew Baker This paper describes a TEX system for creating interactive PDF files to visualize electrophoresis
IMAGE STUDIO LITE. Tutorial Guide Featuring Image Studio Analysis Software Version 3.1
 IMAGE STUDIO LITE Tutorial Guide Featuring Image Studio Analysis Software Version 3.1 Notice The information contained in this document is subject to change without notice. LI-COR MAKES NO WARRANTY OF
Introduction to Data Mining of Microarrays using the MicroArray Explorer
 Introduction to Data Mining of Microarrays using the MicroArray Explorer Peter F. Lemkin Lab. Experimental & Computational Biology, CCR, NCI Frederick, MD 21702 MAExplorer: http://www.lecb.ncifcrf.gov/maexplorer
Quick Guide for Photoshop CC Basics April 2016 Training:
 Photoshop CC Basics Creating a New File 1. Click File > New 2. Keep Default Photoshop Size selected in the Preset drop-down list. 3. Click OK. Showing Rulers 1. On the Menu bar, click View. 2. Click Rulers.
Motic Images Plus 3.0 ML Software. Windows OS User Manual
 Motic Images Plus 3.0 ML Software Windows OS User Manual Motic Images Plus 3.0 ML Software Windows OS User Manual CONTENTS (Linked) Introduction 05 Menus and tools 05 File 06 New 06 Open 07 Save 07 Save
GelQuant Express Analysis Software
 user guide GelQuant Express Analysis Software General information for using the Gel- Quant Express software for analysis of agarose gels Revision Date 1 August 2011 Publication Part Number MAN0004869 Contents
ENVI Tutorial: Interactive Display Functions
 ENVI Tutorial: Interactive Display Functions Table of Contents OVERVIEW OF THIS TUTORIAL...2 OPENING A PANCHROMATIC (SPOT) IMAGE FILE...2 PERFORMING INTERACTIVE CONTRAST STRETCHING...2 Linear Stretching
ENVI Classic Tutorial: Interactive Display Functions 2
 ENVI Classic Tutorial: Interactive Display Functions Interactive Display Functions 2 Files Used in this Tutorial 2 Opening a Panchromatic (SPOT) Image File 3 Performing Interactive Contrast Stretching
Features included in isolution Lite, i-solution, isolution DT
 Features included in isolution Lite, i-solution, isolution DT Include: Live Measurement and Overlay Settings Users can perform measurements on the live preview image, using the crosshair or grid masks
Quantification and Processing of SAED Pattern. (QSAED3d) User s manual. X.Z. LI, Ph. D. (November 27, 2017)
 User s manual. X.Z. LI, Ph. D. (November 27, 2017)") Quantification and Processing of SAED Pattern (QSAED3d) User s manual X.Z. LI, Ph. D (November 27, 2017) Copyright 2011-2017 LANDYNE All Right Reserved 1 Contents 1. Introduction... 3 1.1 Version history...
Quantification and Processing of SAED Pattern (QSAED3d) User s manual X.Z. LI, Ph. D (November 27, 2017) Copyright 2011-2017 LANDYNE All Right Reserved 1 Contents 1. Introduction... 3 1.1 Version history...
ADOBE LIGHTROOM CC KEYBOARD SHORTCUTS
 ADOBE LIGHTROOM CC KEYBOARD SHORTCUTS (FEBRUARY 2019 RELEASE) Installing & Opening Lightroom Help F1 F1 Full Screen Window F11 Cmd Opt F Quit Lightroom Ctrl Q Cmd Q Adding Photos Add Photos Ctrl Shift
Table of Contents. Logos Imaging Application User s Manual Version Page 1
 Table of Contents About... 4 System Requirements... 5 Uninstall Previous Versions... 5 Install LIA 6.0... 6 Install the Device Drivers... 13 Register... 14 Getting Help... 14 Technical Support... 14 Workspace
SYSTEM LINEARITY LAB MANUAL: 2 Modifications for P551 Fall 2013 Medical Physics Laboratory
 SYSTEM LINEARITY LAB MANUAL: 2 Modifications for P551 Fall 2013 Medical Physics Laboratory Introduction In this lab exercise, you will investigate the linearity of the DeskCAT scanner by making measurements
ImageMaster 2D Platinum 6.0
 GE Healthcare ImageMaster 2D Platinum 6.0 User Manual Contents 1 Introduction 1.1 About ImageMaster 2D Platinum... 1 1.2 What s new in this release?... 1 1.3 ImageMaster resources... 2 1.3.1 User manual...
Comparing Two-Dimensional Electrophoretic Gels Images... Internet
 1 of 20 10/28/2003 12:00 PM Comparing Two-Dimensional Electrophoretic Gels Images across the Internet Peter F. Lemkin Image Processing Section / LECB Bld 469 Room 150 NCI-FCRDC/NIH, Frederick, MD 21702,
RT_Image v0.2β User s Guide
 RT_Image v0.2β User s Guide RT_Image is a three-dimensional image display and analysis suite developed in IDL (ITT, Boulder, CO). It offers a range of flexible tools for the visualization and quantitation
IMAGEQUANT. USER S GUIDE Version 5.0. for Microsoft Windows NT Apple Power Macintosh
 IMAGEQUANT USER S GUIDE Version 5.0 for Microsoft Windows NT Apple Power Macintosh Cover (Foreground): Image of a fluorescent 2-color TaqMan (assay in 96-well microplate scanned with a FluorImager 595.
Volocity ver (2013) Standard Operation Protocol
 Standard Operation Protocol") Faculty Core Facility Volocity 6.3.0 (2013) SOP A-1 Volocity ver. 6.3.0 (2013) Standard Operation Protocol Faculty Core Facility Volocity 6.3.0 (2013) SOP A-2 A. Content Overview. 3 Start up. 3 Change
Faculty Core Facility Volocity 6.3.0 (2013) SOP A-1 Volocity ver. 6.3.0 (2013) Standard Operation Protocol Faculty Core Facility Volocity 6.3.0 (2013) SOP A-2 A. Content Overview. 3 Start up. 3 Change
Reference Manual. TotalLab TL100 v web:
 Reference Manual TotalLab TL100 v2009 email: info@nonlinear.com web: www.nonlinear.com Nonlinear Dynamics Ltd Cuthbert House All Saints Newcastle upon Tyne NE1 2ET UK tel: +44 (0)191 230 2121 fax: +44
Page Number Mouse Menu
 Adobe Photoshop CS5 Quick Reference Summary Adobe Photoshop CS5 Quick Reference Summary Number Mouse Adjustment Layer PS 187 Clip to Layer button on Adjustments Layer New Adjustment Layer Background Eraser
Crop Counting and Metrics Tutorial
 Crop Counting and Metrics Tutorial The ENVI Crop Science platform contains remote sensing analytic tools for precision agriculture and agronomy. In this tutorial you will go through a typical workflow
ADOBE ILLUSTRATOR CS3
 ADOBE ILLUSTRATOR CS3 Chapter 2 Creating Text and Gradients Chapter 2 1 Creating type Create and Format Text Create text anywhere Select the Type Tool Click the artboard and start typing or click and drag
IApioneer v3.0.3 Technical Specifications. Powered by the GeoSPHERIC v3.0 Common Code Foundation
 IApioneer v3.0.3 Technical Specifications Powered by the GeoSPHERIC v3.0 Common Code Foundation TABLE OF CONTENTS Introduction...1 IApioneer Environment...1 Backstage... 1 Session Panel... 2 Help Panel...
You need to use the URL provided by your institute s OMERO administrator to access the OMERO.web client.
 1 OMERO.web Client Using OMERO.web to view and work with image data via a web browser. You need to use the URL provided by your institute s OMERO administrator to access the OMERO.web client. Logging in,
Manual and tutorials for CurveAlign V4.0 Beta (August 31, 2017) UW-Madison
 UW-Madison") Manual and tutorials for CurveAlign V4.0 Beta (August 31, 2017) LOCI @ UW-Madison http://loci.wisc.edu/software/curvealign 1 Introduction Overview: CurveAlign 4.0 framework is a curvelet transform based
Manual and tutorials for CurveAlign V4.0 Beta (August 31, 2017) LOCI @ UW-Madison http://loci.wisc.edu/software/curvealign 1 Introduction Overview: CurveAlign 4.0 framework is a curvelet transform based
Innovative Solutions - Technical Excellence. API ImageViewer. Virtual Microscopy. API ImageViewer Instructions
 Innovative Solutions - Technical Excellence API ImageViewer Virtual Microscopy API ImageViewer Instructions Table of Contents Overview... 3 Getting Started Selecting the Result Form... 4 Selecting the
Adobe Lightroom. Work Flow
 Adobe Lightroom Work Flow Place ALL image on your computer or external drive Import/add your images into the Lightroom Catalog Edit your images in the Develop Module Edit your images in 3 rd party application
Supporting Information. High-Throughput, Algorithmic Determination of Nanoparticle Structure From Electron Microscopy Images
 Supporting Information High-Throughput, Algorithmic Determination of Nanoparticle Structure From Electron Microscopy Images Christine R. Laramy, 1, Keith A. Brown, 2, Matthew N. O Brien, 2 and Chad. A.
Freeform metrology using subaperture stitching interferometry
 Freeform metrology using subaperture stitching interferometry APOMA November 10-11, 2016 Presented By: Christopher Hall QED Optics Sr. Engineer, QED Technologies Copyright QED Technologies 2016 Interferometry
Data management for Proteomics ABRF 2005
 MASCOTIntegra Data management for Proteomics 1 Mascot Integra: Data management for proteomics What is Mascot Integra? What Mascot Integra is not Security and Electronic signatures in Mascot Integra Instrument
User's Guide. AIDA Image Analyzer. Multi Labeling. raytest Isotopenmeßgeräte GmbH
 User's Guide AIDA Image Analyzer Multi Labeling raytest Isotopenmeßgeräte GmbH AIDA Image Analyzer Multi Labeling User s Guide The software described in this manual is furnished under a license agreement
Customizable information fields (or entries) linked to each database level may be replicated and summarized to upstream and downstream levels.
 linked to each database level may be replicated and summarized to upstream and downstream levels.") Manage. Analyze. Discover. NEW FEATURES BioNumerics Seven comes with several fundamental improvements and a plethora of new analysis possibilities with a strong focus on user friendliness. Among the most
Manage. Analyze. Discover. NEW FEATURES BioNumerics Seven comes with several fundamental improvements and a plethora of new analysis possibilities with a strong focus on user friendliness. Among the most
Rare Event Detection Algorithm. User s Guide
 Rare Event Detection Algorithm User s Guide Copyright 2008 Aperio Technologies, Inc. Part Number/Revision: MAN 0123, Revision A Date: September 2, 2008 This document applies to software versions Release
ENGR3390: Robotics Fall 2009
 J. Gorasia Vision Lab ENGR339: Robotics ENGR339: Robotics Fall 29 Vision Lab Team Bravo J. Gorasia - 1/4/9 J. Gorasia Vision Lab ENGR339: Robotics Table of Contents 1.Theory and summary of background readings...4
Advanced Vision System Integration. David Dechow Staff Engineer, Intelligent Robotics/Machine Vision FANUC America Corporation
 Advanced Vision System Integration David Dechow Staff Engineer, Intelligent Robotics/Machine Vision FANUC America Corporation Advanced Vision System Integration INTRODUCTION AND REVIEW Introduction and
QUARTZ PCI. SLOW-SCAN for ANALOG SEMs THE MEASURING, ANNOTATING, PROCESSING, REPORTING, ARCHIVING, DO EVERYTHING SOLUTION FOR MICROSCOPY
 QUARTZ PCI SLOW-SCAN for ANALOG SEMs THE MEASURING, ANNOTATING, PROCESSING, REPORTING, ARCHIVING, DO EVERYTHING SOLUTION FOR MICROSCOPY ADDING THE LATEST DIGITAL IMAGING CAPABILITIES TO YOUR SEM IMPROVES
Tutorial 2: Analysis of DIA/SWATH data in Skyline
 Tutorial 2: Analysis of DIA/SWATH data in Skyline In this tutorial we will learn how to use Skyline to perform targeted post-acquisition analysis for peptide and inferred protein detection and quantification.
GE Healthcare. ImageQuant TL 7.0. Image Analysis Software. Getting Started
 GE Healthcare ImageQuant TL 7.0 Image Analysis Software Getting Started Contents 1 Introduction and installation instructions 1.1 Introduction... 5 1.2 Installation... 5 1.3 E-licensing... 6 1.3.1 E-license
SIVIC GUI Overview. SIVIC GUI Layout Overview
 SIVIC GUI Overview SIVIC GUI Layout Overview At the top of the SIVIC GUI is a row of buttons called the Toolbar. It is a quick interface for loading datasets, controlling how the mouse manipulates the
Basic AUC SV data analysis with Sedfit
 Basic AUC SV data analysis with Sedfit Sedfit could be downloaded at http://www.analyticalultracentrifugation.com/download.htm, Sample file for this tutorial can be downloaded in BCF AUC page. http://140.109.66.224/auc.htm
10 Microarray Analysis Using the MicroArray Explorer
 10 Microarray Analysis Using the MicroArray Explorer Peter F. Lemkin, Gregory C. Thornwall, Jai Evans 3 (1) Laboratory of Experimental and Computational Biology, CCR, NCI- Frederick, Frederick, MD 21702;
Chapter 1 Introduction to Photoshop CS3 1. Exploring the New Interface Opening an Existing File... 24
 CONTENTS Chapter 1 Introduction to Photoshop CS3 1 Exploring the New Interface... 4 Title Bar...4 Menu Bar...5 Options Bar...5 Document Window...6 The Toolbox...7 All New Tabbed Palettes...18 Opening an
Image Quant TL (PSC 563, 537, NSC 338, 438)
") Image Quant TL (PSC 563, 537, NSC 338, 438) Contact: Hyuk Kyu Seoh hseoh@gsu.edu Rm: PSC 537 Tel: (404) 413-5379 This software can analyze 1D gels, dot and slot blots, microplates, other basic arrays and
Image Quant TL (PSC 563, 537, NSC 338, 438) Contact: Hyuk Kyu Seoh hseoh@gsu.edu Rm: PSC 537 Tel: (404) 413-5379 This software can analyze 1D gels, dot and slot blots, microplates, other basic arrays and
Introduction to XDisp Qt The New HKL-2000 and HKL-3000 Diffraction Image Display
 Introduction to XDisp Qt The New HKL-2000 and HKL-3000 Diffraction Image Display HKL-2000 and HKL-3000 have a new, sleeker way of displaying your diffraction data, because HKL is now distributed with XDisp
fmri/dti analysis using Dynasuite
 fmri/dti analysis using Dynasuite Contents 1 Logging in 2 Finding patient session 3 Viewing and adjusting images 4 Checking brain segmentation 5 Checking image registration 6 Seeing fmri results 7 Saving
CLAREMONT MCKENNA COLLEGE. Fletcher Jones Student Peer to Peer Technology Training Program
 CLAREMONT MCKENNA COLLEGE Fletcher Jones Student Peer to Peer Technology Training Program Preparing Image Content for Presentations, Web Pages and Structured Documents (Editing Documents and Images with
Galaxie Workstation Configuration Manager
 Varian, Inc. 2700 Mitchell Drive Walnut Creek, CA 94598-1675/USA Galaxie Workstation Configuration Manager User s Guide Varian, Inc. 2002-2005 Printed in U.S.A. 03-914973-00:Rev. 3 Table of Contents Using
PRESETTER SP40. Pesaro, September 2013
 Pesaro, September 2013 1 PRESETTER SP40 TECHNICAL SPECIFICATIONS: AXIS DIMENSIONS: Diameter 600mm, Height XXXX mm MAIN STRUCTURE: Entirely made in C45 medium carbon steel it ensures greater strength and
Applying Hounsfield unit density calibration in SkyScan CT-analyser
 1 Bruker-microCT Method note Applying Hounsfield unit density calibration in SkyScan CT-analyser Hounsfield units (HU) are a standard unit of x-ray CT density, in which air and water are ascribed values
Using a standard photographic (18%) Gray Card as a reference
 Gray Card as a reference") Using a standard photographic (18%) Gray Card as a reference 5-5-08 This example assumes familiarity with pages 1 3 of http://www.paulroark.com/bw- Info/Making_B-W_ICCs-1.pdf Making the ICC Input Data
Using a standard photographic (18%) Gray Card as a reference 5-5-08 This example assumes familiarity with pages 1 3 of http://www.paulroark.com/bw- Info/Making_B-W_ICCs-1.pdf Making the ICC Input Data
QUARTZ PCI. SLOW-SCAN for ANALOG SEMs THE MEASURING, ANNOTATING, PROCESSING, REPORTING, ARCHIVING, DO EVERYTHING SOLUTION FOR MICROSCOPY
 QUARTZ PCI SLOW-SCAN for ANALOG SEMs THE MEASURING, ANNOTATING, PROCESSING, REPORTING, ARCHIVING, DO EVERYTHING SOLUTION FOR MICROSCOPY ADDING THE LATEST DIGITAL IMAGING CAPABILITIES TO YOUR SEM IMPROVES
GUIDE TO View3D. Introduction to View3D
 View3D Guide Introduction to View3D... 1 Starting Hampson-Russell Software... 2 Starting View3D... 4 A Brief Summary of the View3D Process... 8 Loading the Seismic and Horizon Data... 8 Viewing the Data...
Alignment and Other Challenges in Reconstructing Cryotomograms with IMOD
 Alignment and Other Challenges in Reconstructing Cryotomograms with IMOD Challenges in Cryotomography Alignment, alignment, alignment It can be hard to get fiducials onto/in the sample The low SNR makes
Importing and processing a DGGE gel image
 BioNumerics Tutorial: Importing and processing a DGGE gel image 1 Aim Comprehensive tools for the processing of electrophoresis fingerprints, both from slab gels and capillary sequencers are incorporated
InSyTe FLECT/CT Application Note
 Summary This note is a quick guide for FLECT and CT image co-registration and fusion with VivoQuant (VQ3.0Patch1). Scope This application note is for users who process/analyze images acquired with InSyTe
Geostatistics 2D GMS 7.0 TUTORIALS. 1 Introduction. 1.1 Contents
 GMS 7.0 TUTORIALS 1 Introduction Two-dimensional geostatistics (interpolation) can be performed in GMS using the 2D Scatter Point module. The module is used to interpolate from sets of 2D scatter points
How to...create a Video VBOX Gauge in Inkscape. So you want to create your own gauge? How about a transparent background for those text elements?
 BASIC GAUGE CREATION The Video VBox setup software is capable of using many different image formats for gauge backgrounds, static images, or logos, including Bitmaps, JPEGs, or PNG s. When the software
Load KEGG Pathways. Browse and Load KEGG Pathways
 Note: This is just partial of VisANT manual related with the NAR 2007 submission. Please visit http://visant.bu.edu for the full user manual. Load KEGG Pathways...1 Browse and Load KEGG Pathways...1 Load
University of Minnesota Nano Fabrication Center Standard Operating Procedure
 Equipment Name: University of Minnesota Nano Fabrication Center Coral Name: hs-scope Revision Number: 1.5 Model: HS200A Revisionist: M. Fisher Location: Bay 1 Date: 9/12/2013 1 Description The Hyphenated
Docuscan. User Guide. October Docupace Technologies, Inc. 10/08. For broker-dealer use only. Not to be used with the public.
 Docuscan User Guide October 2008 2008 Docupace Technologies, Inc. 10/08 For broker-dealer use only. Not to be used with the public. Contents INTRODUCTION...1 INSTALLING DOCUSCAN...1 SETTING UP DOCUSCAN...2
Adobe FrameMaker 12 Voluntary Product Accessibility Template
 Adobe FrameMaker 12 Voluntary Product Accessibility Template The purpose of the Voluntary Product Accessibility Template is to assist Federal contracting officials in making preliminary assessments regarding
Disc I: (2:51:00) Disc II: (2:34:00) Part I: Intro/Environment. Part III: Tools. Part II: Selection Tools, Basic Editing & Layers.
 Disc II: (2:34:00) Part I: Intro/Environment. Part III: Tools. Part II: Selection Tools, Basic Editing & Layers.") Disc I: (2:51:00) Disc II: (2:34:00) Part I: /Environment Part III: Tools 21:59 Stamp Tools 6:21 Environment 24:22 Color Management Profiles Color # s Custom Colors Back to settings Edit: Preferences 5:57
Disc I: (2:51:00) Disc II: (2:34:00) Part I: /Environment Part III: Tools 21:59 Stamp Tools 6:21 Environment 24:22 Color Management Profiles Color # s Custom Colors Back to settings Edit: Preferences 5:57
ImageQuant TL. User Guide. v
 ImageQuant TL User Guide v2003 63-0050-82 Amersham Biosciences Corp 800 Centennial Avenue P.O. Box 1327 Piscataway NJ 008855 USA Tel: 1-800 526 3593 Fax: 1-800 329 3593 Amersham Biosciences Amersham Place
Standard Operating Procedure for Bathymetric Mapping with Humminbird 365i and Dr. Depth
 Standard Operating Procedure for Bathymetric Mapping with Humminbird 365i and Dr. Depth Software September 26 2012 DOCUMENT NUMBER: UIDAHO BATHY SOP 1 For use in the Limnology laboratory and associated
Vision MET/METCAD. 2D measurement system
 Vision MET/METCAD 2D measurement system September 2012 ~ Contents ~ 1 GENERAL INFORMATION:... 3 1.1 PRECISION AND RESOLUTION... 3 2 GETTING STARTED:... 5 2.1 USER IDENTIFICATION... 5 2.2 MAIN WINDOW OF
Table of Contents. Imaging Nucleic Acid Gels on the LI-COR Odyssey FC Imager User Guide University of Puget Sound Updated June 2014 by Amy Replogle
 Imaging Nucleic Acid Gels on the LI-COR Odyssey FC Imager User Guide University of Puget Sound Updated June 2014 by Amy Replogle Table of Contents I. Disclaimer!... 2 II. Introduction... 2 III. Safety
Adobe Illustrator CC 2018 Tutorial
 Adobe Illustrator CC 2018 Tutorial GETTING STARTED Adobe Illustrator CC is an illustration program that can be used for print, multimedia and online graphics. Whether you plan to design or illustrate multimedia
Fluorescence Tomography Source Reconstruction and Analysis
 TECHNICAL NOTE Pre-clinical in vivo imaging Fluorescence Tomography Source Reconstruction and Analysis Note: This Technical Note is part of a series for Fluorescence Imaging Tomography (FLIT). The user
Segger Tutorial. NCMI Workshop on Single Particle Reconstruction, Validation and Analysis. March 14-17, 2011
 NCMI Workshop on Single Particle Reconstruction, Validation and Analysis March 14-17, 2011 Segger Tutorial Segmentation of Density Maps and Rigid Body Docking of Structures Greg Pintilie Baylor College
3D FeatureXtract User s Guide. Powered by the GeoSPHERIC v3.0 Common Code Foundation
 3D FeatureXtract User s Guide Powered by the GeoSPHERIC v3.0 Common Code Foundation CONTENTS 1 Getting Started... 1 1.1 UI Conventions... 1 1.2 Installation and Licensing... 1 1.2.1 Licensing... 2 1.3
Keynote Basics Website:
 Keynote Basics Website: http://etc.usf.edu/te/ Keynote is Apple's presentation application. Keynote is installed as part of the iwork suite, which also includes the word processing program Pages. If you
Computer and Machine Vision
 Computer and Machine Vision Lecture Week 5 Part-2 February 13, 2014 Sam Siewert Outline of Week 5 Background on 2D and 3D Geometric Transformations Chapter 2 of CV Fundamentals of 2D Image Transformations
User Guide for beginners: Drishti Prayog
 User Guide for beginners: Drishti Prayog Content 1. Introduction to Drishti and Drishti Prayog... 2 2. Drishti... 3 2.1 Downloading Drishti... 3 2.2 Loading a volume into Drishti... 3 2.2.1 Starting with
Scanner Parameter Estimation Using Bilevel Scans of Star Charts
 ICDAR, Seattle WA September Scanner Parameter Estimation Using Bilevel Scans of Star Charts Elisa H. Barney Smith Electrical and Computer Engineering Department Boise State University, Boise, Idaho 8375
ACDSee Pro Photo Manager 3
 Manage your images the way that works best for you. ACDSee Pro is built to help you save time in all the key steps of your photography workflow. Experience an accelerated workflow with ACDSee Pro 3 - developed,
Annotating a single sequence
 BioNumerics Tutorial: Annotating a single sequence 1 Aim The annotation application in BioNumerics has been designed for the annotation of coding regions on sequences. In this tutorial you will learn how
TexRAD Research Version Client User Guide Version 3.9
 Imaging tools for medical decision makers Cambridge Computed Imaging Ltd Grange Park Broadway Bourn Cambridge CB23 2TA UK TexRAD Research Version Client User Guide Version 3.9 Release date 23/05/2016 Number
CS Multimedia and Communications REMEMBER TO BRING YOUR MEMORY STICK TO EVERY LAB! Lab 02: Introduction to Photoshop Part 1
 CS 1033 Multimedia and Communications REMEMBER TO BRING YOUR MEMORY STICK TO EVERY LAB! Lab 02: Introduction to Photoshop Part 1 Upon completion of this lab, you should be able to: Open, create new, save
Multivariate Calibration Quick Guide
 Last Updated: 06.06.2007 Table Of Contents 1. HOW TO CREATE CALIBRATION MODELS...1 1.1. Introduction into Multivariate Calibration Modelling... 1 1.1.1. Preparing Data... 1 1.2. Step 1: Calibration Wizard
QUANTAX EDS SYSTEM SOP
 QUANTAX EDS SYSTEM SOP December 2017 Energy-Dispersive X-Ray Spectroscopy (EDS, EDX, EDXS or XEDS), is an analytical technique used for the elemental analysis or chemical characterization of a sample.
Version 1.0 PROTEOMICA DEMYSTIFYING PROTEINS. Indian Institute of Technology Bombay, India Bhushan N Kharbikar
 Version 1.0 PROTEOMICA DEMYSTIFYING PROTEINS Indian Institute of Technology Bombay, India Bhushan N Kharbikar Software User s Manual Version 1.0 Copyright 2013 Bhushan N Kharbikar, Proteomics Lab Department
Georeferencing Imagery in ArcGIS 10.3.x
 Georeferencing Imagery in ArcGIS 10.3.x Georeferencing is the process of aligning imagery (maps, air photos, etc.) with spatial data such as point, lines or polygons (for example, roads and water bodies).
GUIDE TO VIEW3D. Introduction to View3D
 View3D Guide Introduction to View3D... 1 Starting Hampson-Russell Software... 2 Starting View3D... 4 A Brief Summary of the View3D Process... 8 Loading the Seismic and Horizon Data... 8 Selection Errors...
Trimble RealWorks. What s new in version 9.0
 Trimble RealWorks What s new in version 9.0 Trimble RealWorks v9.0 What s new Over 40 new features and enhancements Navigation and visualization improvements SketchUp interoperability Additional 3 rd party
Network Analysis, Visualization, & Graphing TORonto (NAViGaTOR) User Documentation
 User Documentation") Network Analysis, Visualization, & Graphing TORonto (NAViGaTOR) User Documentation Jurisica Lab, Ontario Cancer Institute http://ophid.utoronto.ca/navigator/ November 10, 2006 Contents 1 Introduction 2
Network Analysis, Visualization, & Graphing TORonto (NAViGaTOR) User Documentation Jurisica Lab, Ontario Cancer Institute http://ophid.utoronto.ca/navigator/ November 10, 2006 Contents 1 Introduction 2
Melanie 3 User Manual
 Melanie 3 User Manual MELUMBR0199 Warranty Bio-Rad Laboratories warrants that the Melanie software shall substantially conform, in all operational features, to Bio-Rad s current specifications as published
Paint Brush. Airbrush Kinked. Pencil Basic. Eraser Polygon. Bucket. Blend. Wand. Marquee. Row Selection Polygon. Column Selection. Oval.
 Canvas X Tools Canvas X Tools Selection tools Painting Line Selection Paint Brush Line Lasso selection Airbrush Kinked Direct edit lasso selection Neon Smooth Kinked Direct group selection Pencil Basic
ENVI Tutorial: Basic SAR Processing and Analysis
 ENVI Tutorial: Basic SAR Processing and Analysis Table of Contents OVERVIEW OF THIS TUTORIAL...2 Background...2 SINGLE-BAND SAR PROCESSING...3 Read and Display RADARSAT CEOS Data...3 Review CEOS Header...3
Paint Brush. Airbrush. Neon. Pencil. Marker. Eraser. Bucket. Blend. Wand. Marquee. Row Selection. Column Selection. Oval. Lasso. Polygon Lasso.
 Canvas X Tools Canvas X Tools Selection tools Painting Line Selection Paint Brush Line Lasso selection Airbrush Kinked Direct edit lasso selection Neon Smooth Kinked Direct group selection Pencil Basic
Vector Xpression 3. Speed Tutorial: III. Creating a Script for Automating Normalization of Data
 Vector Xpression 3 Speed Tutorial: III. Creating a Script for Automating Normalization of Data Table of Contents Table of Contents...1 Important: Please Read...1 Opening Data in Raw Data Viewer...2 Creating
TABLE OF CONTENTS PRODUCT DESCRIPTION VISUALIZATION OPTIONS MEASUREMENT OPTIONS SINGLE MEASUREMENT / TIME SERIES BEAM STABILITY POINTING STABILITY
 TABLE OF CONTENTS PRODUCT DESCRIPTION VISUALIZATION OPTIONS MEASUREMENT OPTIONS SINGLE MEASUREMENT / TIME SERIES BEAM STABILITY POINTING STABILITY BEAM QUALITY M 2 BEAM WIDTH METHODS SHORT VERSION OVERVIEW
Keynote 08 Basics Website:
 Website: http://etc.usf.edu/te/ Keynote is Apple's presentation application. Keynote is installed as part of the iwork suite, which also includes the word processing program Pages and the spreadsheet program