Teaching and Learning Dashboard Guide
|
|
|
- Hugh Page
- 5 years ago
- Views:
Transcription
1 Teaching and Learning Dashboard Guide Contents Introduction... 2 Dashboard Basics... 3 How to use the University of Manchester Teaching and Learning Dashboard NSS Overview To filter: To drill down: NSS Overview Schools NSS Overview School (Individual) NSS Programme Data NSS Programme Comparison NSS Trends Glossary... 23
2 Introduction The dashboard has been designed with your needs in mind. It is intended to present student data in a consolidated, at a glance, dashboard format, thereby making Management Information more accessible and contributing to more informed decision-making. For now, the data presented is related to the National Students Survey (NSS). There will be more aspects added to the dashboard in future, and it will incorporate a number of pages focussed on different student datasets, with several related data items on each page. The underlying dashboard datasets will be drawn from a variety of sources, primarily existing Campus Solutions data from the Data Warehouse but also from other data such as HESA and NSS. The Dashboard focuses initially on Undergraduate data and aims to develop the following pages: Admissions Student Profile Progression Student Satisfaction Portfolio Review The project will be developed over a number of phases, each of which will address a specific data area, and gradually grow into a comprehensive view of Undergraduate performance across the University. Implementation of the dashboard will: Make existing datasets and Management Information more accessible for key users through appealing visuals and drill-down functionality Bring together independent but related datasets onto one page Encourage greater use of Management Information as part of routine decision making process across the University Reduce resource required in producing faculty/school specific analysis by introducing standard formats Provide a self-service facility to answer many common questions Improve data quality through exposure of data quality errors and inconsistencies provide a view on how the University is performing against its strategic organisational goals

3 Dashboard Basics Teaching and Learning Dashboard Access The dashboard can be accessed at dashboard.its.manchester.ac.uk. The Active Dashboards application is web-based and is accessed through a standard web browser we find Firefox works best for the Teaching and Learning Dashboard. Steve Wilkes, the Developer of the T&L Dashboard, can grant you access - steven.wilkes@manchester.ac.uk Dashboard Structure Within the Active Dashboards application a Dashboard displays a collection of Dashboard Items as illustrated below. Active Dashboards Application Structure A Dashboard Item usually displays data in a single graphical chart or text grid. Using the Dashboard Page When you access the Active Dashboards web application a Dashboard page will appear in your web browser. A Header Bar appears at the top of the page and contains controls allowing you to choose which Dashboard to view, which Items to view on the Dashboard, the layout of the Dashboard, Filter options and hypertext links such as Logout and Refresh. Dashboard Items are displayed below the Header Bar. Dashboard - Layout dropdown


4 Selecting will open a layout pick control shown below. Based upon the current dashboard displayed the Layout control will default to show the corresponding page and highlight the current layout. The image above shows the 3x3 layout selected in Green. To close the Layout control either select a layout option by clicking on it, click on the browser outside of the control or click the close icon (see highlighted are in the adjacent diagram). Layout Control - Grid Depending upon which option is chosen, it will determine how many Items are displayed in the Dashboard and how they are laid out. For instance, if you want to display 4 Items in this Dashboard, you could choose: 2x2 layout which would display 4 Items in 2 columns each containing two Items:

5 Add a Dashboard Item As well as changing the layout of the dashboard to show more or fewer graphs, you can change the graphs displayed. To do this if there are no spaces free on the page, you ll need to close one of the existing graphs using the red X in the top right. Once you ve freed up a space, go to the Add a dashboard item button in the top left of the page. This drop down menu will list the options for graphs to be shown on the page. Select one, and it will appear in the empty gap.

6 Moving a graph To move individual graphs around on the page, hover on the top of the border around a chart and the cursor will turn to four arrows as below. Click and drag to reorder the graphs. Dragging one graph on top of another will cause the graphs to swap places.
7 Dashboard Filters The Dashboard allows you to filter the data on all displayed Items by applying Dashboard level filters. These are displayed on a button labelled Dashboard Filters with an Expand icon below the main Dashboard Title bar (see below). Clicking on the Expand icon will drop down the filter panel. Filter values can then be set using the controls revealed. To affect changes to the Dashboard filters three buttons are available: Apply applies the settings to the Dashboard; Clear resets the filters to the default values specified by the Administrator; Cancel resets the currently applied filters and closes the filter panel.

8 Changing one of these filters and clicking Apply will result in the contents of the Dashboard being refreshed with the data displayed in accordance with the new filter settings. Automatic Filter Refreshing By default, the filter area will refresh when one of the filters is changed as shown in below. Dashboard Filters - Automatic Refresh This is useful when there are linked Dashboard filters, i.e. dropdown options which are conditional on other filter selections. By default, the dashboard filters will refresh to help avoid any unexpected results being displayed due to filter choices.

9 Drilling Down Some charts have a drill down facility. This is indicated by the appearance of a hand cursor when the cursor is moved over a chart, and by the caption Click to drill down above the graphic. Drill down facility If you click on a drill down link then depending on how the Item has been configured, a new Chart, Grid, Dashboard, Web page or Document will be displayed showing you more specific information about the data you clicked on. Drilling down to an Item When you drill down to a new Item this will either pop up in a new window or in a new page depending upon how it has been configured in the Dashboard Designer. If the Item has been configured to show applied filters it will show them in read-only text below the Item title.
10 Display of currently applied Item filters After applying filters, the filter display details the Active filters (see red box in diagram below). Exporting Data Some Items in the Dashboard may have an option to export the data. Currently, there are two options for exporting data; Micros oft Exce l file form a t. Comma Separated Value (CSV) text file. Where this option is available, clicking on the Export link exports the data currently displayed in the Chart or Grid to Excel. You will then have the option to either open up the file or save the file for viewing later.
11 How to use the University of Manchester Teaching and Learning Dashboard The dashboard can be assessed at Log on using your central services username and password. NSS Overview The NSS overview page can be accessed via the tabs at the top of the dashboard page (see below). On this page you ll find a question list, with the full wording of each NSS question; NSS results for each Faculty by Section; NSS results for each Question by Faculty; and results for each Section by Faculty. From this page, you can filter the dashboard to show data for specific faculties or schools and drill down to open the NSS Overview - Schools page. Hover the cursor over any of the bars will bring up the faculty or school it relates to, the NSS question, and the percentage of positive responses.

12 To filter: If you click on the Dashboard Filters button, highlighted in red on the right of image above, a dropdown will open enabling you to narrow down what s displayed on the screen by Faculty and by School, as shown below.
 that you make - wait for this to happen before making your next choice.")
13 Once you ve selected the areas you re interested in, click Apply and the graphs will refresh. The graphs will not update unless Apply is clicked. NB the filters will refresh between each selection (result year, faculty, school) that you make - wait for this to happen before making your next choice. To drill down: Some of the graphs have the option to drill down further into the information on display. By clicking on one of the faculties shown in the graph, you can access a new page called NSS Overview Schools. When the cursor is hovered over a faculty chart it turns into a hand and clicking at this stage will drill down into the school level data.

14 NSS Overview Schools This page is available by drilling down from the NSS Overview page s Faculty by Section graph. As seen in the figure above, by drilling down from the initial Overview page, the active filters have already been set to display the selected Faculty and School in the new page. Clicking to drill down further into the School by Section graph will open a new window and a new page: NSS Overview School (Individual).

15 NSS Overview School (Individual) This page details the results for each programme by section, school result by section, and school by question. In the top right graph, you re asked to Click to see Individual Programme Detail This drills down to the NSS Programme Data page.

16 NSS Programme Data This page shows results for a specific programme by NSS question, as well as other important information relating to students such as library visits, average salary and destinations, the number of applications to the programme, and programme numbers/withdrawals. The programme will be automatically selected for you
.")
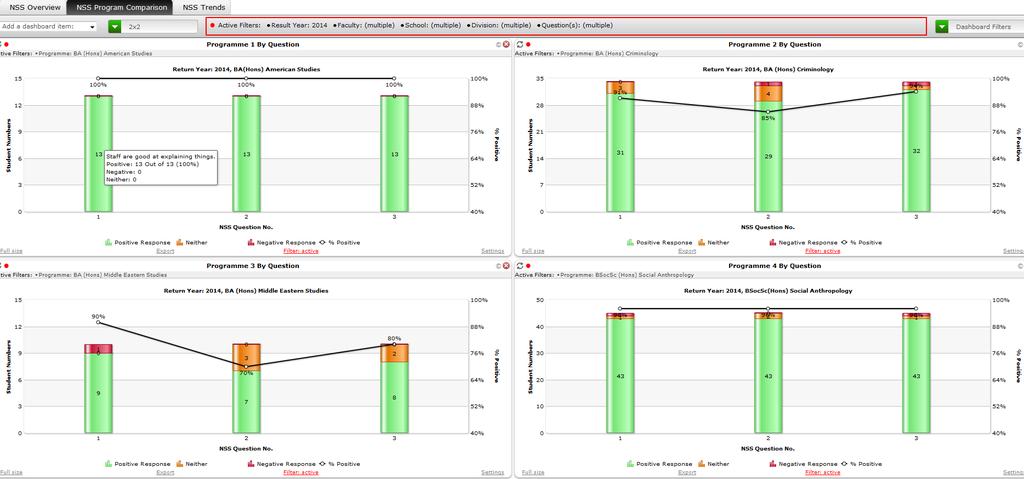
17 NSS Programme Comparison This page allows you to compare up to four individual programmes side by side, with the option to select any number of questions from the NSS. The data can be access through the NSS Program comparison tab (see diagram below). To select a programme, click on the Filter: Active label highlighted in red above, at the bottom of each graph and choose a programme from the drop down menu. Clicking on Apply Filter will load the programme data onto the graph. Initially the dashboard will display data for every question in the NSS. If you wish to restrict the results visible to fewer questions, this can be done via the Dashboard Filters menu in the top right, as per other dashboard pages. Click 'Apply' once you have made your selections and the dashboard will refresh.

18 If you only want to see results for a select number of questions, do this using the Dashboard Filters first, before using the Filter: Active option on the graph itself. This is because the page will reset once you ve chosen questions, so any programmes will need to be reselected after this.
19

20 NSS Trends The trends page allows you to see how NSS results have changed over the years ranging from 2011 to Graphs are shown for Programme, Section and Question by year. You can define the faculties, schools, and programmes you d like to view in the same way as the other pages, by using the Dashboard Filters button, allowing it to refresh and then clicking apply.
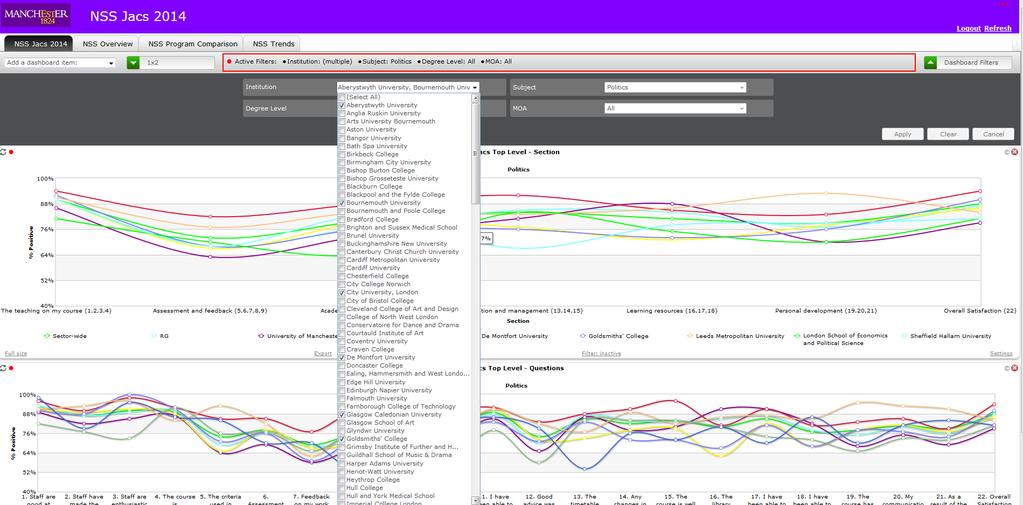
21 NSS JACS 2014 The JACS codes page of the dashboard compares one subject from the level 3 JACS codes by section and by question. The Russell Group, Sector Wide, and University of Manchester lines will always remain visible on the graphs. Other institutions can be selected in the dashboard filters, as can the different JACS codes. Once the institutions and JACS area have been selected, Please Wait will show while the dashboard refreshes, and then clicking Apply will update the graphs to show the selected information (see diagram below). As the dashboard has a limited number of colours available, selecting too many institutions to show will result in repetition and a lack of clarity between lines on the graphs. A maximum of 7 additional institutions can be selected before colours start to repeat. NB: Part Time responses are included in the filters under MOA. Both Full and Part Time will be auto selected on opening the JACS page but can be filtered out if desired. If only one of the MOAs is selected and there are fewer than 10 responses for it, then the data will not display. If both Full and Part Time are selected and one has fewer than 10 responses, all of the responses will be included in the aggregated data.
22
23 Glossary 1. Dashboard This refers to the whole entity. So we might have a Research Dashboard, a DLHE dashboard, a PGR dashboard etc. as well as a UG Student Dashboard. There may be some cross-over of data and all of these dashboards would consist of one or more pages (see below). 2. Page This equates to the different tabs which make up a dashboard. A page might be either an overview of data, or a subordinate which expands on the data shown in the overview. 3. Header Bar This appears at the top of the page and contains controls allowing you to choose which Dashboard to view, which Items to view on the Dashboard, the layout of the Dashboard, Filter options and hypertext links such as Logout and Refresh. 4. Item This represents one of the individual graphs or charts which make up a dashboard page. 5. Filter The selection criteria at the top of the page, which controls what level of data is displayed, i.e., Faculty, School, Year, etc. These might apply only to a specific page (overview or subordinate), or flow through the entire dashboard from overview through to subordinate(s). 6. Text Box supporting text which gives additional information to help interpret the data displayed on the page, i.e., similar to the list of sections and questions in the middle of the NSS dashboard. 7. Drilling and Navigation Drilling is when one hovers over a graph, pie chart, etc., clicks and is taken, for example from Faculty level, down to a view of the same data for the individual schools making up that Faculty. Navigation is more pre-defined. For example, you might navigate to some NSS data showing Q22 responses for the whole University.
DASHBOARD PERFORMANCE INDICATOR DATABASE SYSTEM (PIDS) USER MANUAL LIBERIA STRATEGIC ANALYSIS TABLE OF CONTETABLE OF CONT. Version 1.
 USER MANUAL LIBERIA STRATEGIC ANALYSIS TABLE OF CONTETABLE OF CONT. Version 1.") UNITED STATES AGENCY FOR INTERNATIONAL DEVELOPMENT TABLE OF CONTETABLE OF CONT PERFORMANCE INDICATOR DATABASE SYSTEM (PIDS) LIBERIA STRATEGIC ANALYSIS DASHBOARD USER MANUAL Version 1.0 PERFORMANCE INDICATOR
UNITED STATES AGENCY FOR INTERNATIONAL DEVELOPMENT TABLE OF CONTETABLE OF CONT PERFORMANCE INDICATOR DATABASE SYSTEM (PIDS) LIBERIA STRATEGIC ANALYSIS DASHBOARD USER MANUAL Version 1.0 PERFORMANCE INDICATOR
Dashboard 8.0. User Guide
 Dashboard 8.0 User Guide Table of Contents Dashboard User Reference Guide Table of Contents...2 Basic Navigation...3 Content Section...3 Filter Frame...4 Table Types...5 The Drilling Process...6 The Metric
MicroStrategy Desktop
 MicroStrategy Desktop Quick Start Guide MicroStrategy Desktop is designed to enable business professionals like you to explore data, simply and without needing direct support from IT. 1 Import data from
MicroStrategy Analytics Desktop
 MicroStrategy Analytics Desktop Quick Start Guide MicroStrategy Analytics Desktop is designed to enable business professionals like you to explore data, simply and without needing direct support from IT.
OBIEE. Oracle Business Intelligence Enterprise Edition. Rensselaer Business Intelligence Position Control
 OBIEE Oracle Business Intelligence Enterprise Edition Rensselaer Business Intelligence Position Control TABLE OF CONTENTS INTRODUCTION... 1 USER INTERFACE... 1 HOW TO LAUNCH OBIEE... 1 HOW TO NAVIGATE...
Introduction to WISER: Departments
 Department Search To view financial detail by department, navigate to the Main Menu and choose the Find Departments option. On the Find Departments page, you will have the option to search using a single
Bill Analyser User Guide
 Bill Analyser User Guide emobile.ie/business Contents 1.0 Basic Concepts... 3 1.1 Users and Roles... 3 Standard Users... 3 Global Users... 3 eircom User Roles... 3 Available user roles... 3 1.2 Data Structure...
gc4you.com User Guide 2010
 Table of Contents Introduction... 2 Sign On and Authentication... 3 Standard Portal Page Components... 4 Navigation... 8 Searching Portal Search... 10 Search Results... 11 Bring2Mind\DMX... 12 Document
ALES Wordpress Editor documentation ALES Research websites
 ALES Wordpress Editor documentation ALES Research websites Contents Login... 2 Website Dashboard... 3 Editing menu order or structure... 4 Add a new page... 6 Move a page... 6 Select a page to edit...
IRA Basic Running Financial Reports
 IRA Basic Running Financial Reports Dartmouth College maintains a data warehouse of institutional finances, student data, advancement giving and other important measures. Institutional Reporting and Analysis
OBIEE. Oracle Business Intelligence Enterprise Edition. Rensselaer Business Intelligence Admissions, Undergraduate
 OBIEE Oracle Business Intelligence Enterprise Edition Rensselaer Business Intelligence Admissions, Undergraduate TABLE OF CONTENTS INTRODUCTION... 1 USER INTERFACE... 1 HOW TO LAUNCH OBIEE... 1 HOW TO
Creating Dashboard. Version: 7.3
 Creating Dashboard Version: 7.3 Copyright 2015 Intellicus Technologies This document and its content is copyrighted material of Intellicus Technologies. The content may not be copied or derived from, through
This quick reference guide is designed for consumers of the Program Dashboard and provides details on how to: Log in
 This quick reference guide is designed for consumers of the Program Dashboard and provides details on how to: Log in Filter data using input controls Access the Dashboard Access Collibra/ Definitions Glossary
Creating a Test in TAG
 www.dmac- solutions.net 1.866.988.6777 support@dmac- solutions.net Creating a Test in TAG 1. Log into DMAC Solutions at https://www.dmac-solutions.net * Your username and password will be given to you
Performance Evaluation Essentials
 Performance Evaluation Essentials Program Outline Table of contents Quick Reference Guide Navigating the myua Dashboard... 3 Quick Reference Guide Create Performance Evaluation... 4 Quick Reference Guide
Creating a Test in TAG
 www.dmac-solutions.net 1.866.988.6777 support@dmac-solutions.net Creating a Test in TAG Log-in to DMAC Solutions at https://www.dmac-solutions.net. *Your user-name and password will be given to you by
Central Skills Log For Learners
 Central Skills Log For Learners To access the Central Skills Log open a Web Browser, go to http://www.cqual.org and click on the Central Skills Log link in the top menu. Then click the CSL Login button.
OBIEE. Oracle Business Intelligence Enterprise Edition. Rensselaer Business Intelligence Finance Author Training
 OBIEE Oracle Business Intelligence Enterprise Edition Rensselaer Business Intelligence Finance Author Training TABLE OF CONTENTS INTRODUCTION... 1 USER INTERFACE... 1 HOW TO LAUNCH OBIEE... 1 TERMINOLOGY...
Kingsley Associates Portal User Guide
 Kingsley Associates Portal User Guide Kingsley Portal Overview The Kingsley Portal is a web-based, real time survey tracking tool Dashboard Response Rates Respondent List Reporting Online Reputation Key
Astra Scheduling Grids
 Astra Scheduling Grids To access the grids, click on the Scheduling Grids option from the Calendars tab. A default grid will be displayed as defined by the calendar permission within your role. Choosing
Business Warehouse reports Running and manipulating reports. Newcastle University Andy Proctor 9 th March 2017
 Business Warehouse reports Running and manipulating reports Newcastle University Andy Proctor 9 th March 2017 Table of Contents Running a business warehouse report... 2 Adding a characteristic... 4 Drag
STRATEGIC INFORMATION AND BUSINESS INTELLIGENCE DASHBOARD AND REPORT PORTAL TRAINING
 STRATEGIC INFORMATION AND BUSINESS INTELLIGENCE DASHBOARD AND REPORT PORTAL TRAINING CONTENTS: 1.0 IE Settings for Cognos Access 2.0 Cognos Login 3.0 Strategic Information and Business Intelligence Dashboard
IRA Basic Running Financial Reports
 IRA Basic Running Financial Reports Updated 6-7-2013 1 Training Index Part I Introduction to the IRA Reporting Tool IRA Resources (3) Logging onto the system (4) Navigating the Dashboard (5-9) Running
Houghton Mifflin Harcourt and its logo are trademarks of Houghton Mifflin Harcourt Publishing Company.
 Guide for Teachers Updated September 2013 Houghton Mifflin Harcourt Publishing Company. All rights reserved. Houghton Mifflin Harcourt and its logo are trademarks of Houghton Mifflin Harcourt Publishing
Astra Scheduling Grids
 Astra Scheduling Grids To access the grids, click on the Scheduling Grids option from the Calendars tab. A default grid will be displayed as defined by the calendar permission within your role. Choosing
Steps: 1. Log in to the Dmitri application through the following website URL, as appropriate:
 Dmitri Suite Getting Started Logging In and Logging Out Logging In Use the following steps to log in to the Dmitri application. Steps: 1. Log in to the Dmitri application through the following website
Instructional Improvement System (IIS) Dashboard District User Guide Statewide Longitudinal Data System (SLDS)
 Dashboard District User Guide Statewide Longitudinal Data System (SLDS)") Instructional Improvement System (IIS) Dashboard District User Guide Statewide Longitudinal Data System (SLDS) June 10, 2014 Page 1 of 36 IIS Dashboard District User Guide 2 Contents Project Overview...
Instructional Improvement System (IIS) Dashboard District User Guide Statewide Longitudinal Data System (SLDS) June 10, 2014 Page 1 of 36 IIS Dashboard District User Guide 2 Contents Project Overview...
RONA e-billing User Guide
 RONA e-billing Contractor Self-Service Portal User Guide RONA e-billing User Guide 2015-03-10 Table of Contents Welcome to RONA e-billing What is RONA e-billing?... i RONA e-billing system requirements...
econnect Baccarat User Guide EC7 June 2017
 econnect Baccarat User Guide EC7 June 2017 Table of Contents Baccarat Camera View A. Card Displayed on Virtual Table B. Bet Session Recording C. How to open a camera D. What is displayed on Data View E.
ASTRA USER GUIDE. 1. Introducing Astra Schedule. 2. Understanding the Data in Astra Schedule. Notes:
 ASTRA USER GUIDE 1. Introducing Astra Schedule Astra Schedule is the application used by Academic Space Scheduling & Utilization to schedule rooms for classes and by academic colleges, schools, and departments
ERP Student Manual. Contents
 ERP Student Manual Contents Logging into the ERP... 2 Common Dashlet features... 3 Calendar Dashlet... 4 Attendance Dashlet... 5 Viewing your courses information... 7 Student Information dashlet... 8 Logging
Introduction 3. Why LUCIA BI? 3 Before You Start 4. Does LUCIA BI Require an Internet Connection? 4 Getting StartedI 5
 User s Guide 2 Contents Introduction 3 Why LUCIA BI? 3 Before You Start 4 Does LUCIA BI Require an Internet Connection? 4 Getting StartedI 5 Logging in for the first time 5 Retrieving forgotten password
idata User Manual September 2015
 idata User Manual September 2015 Table of Contents What is idata? 3 How to log in 4 6 Dashboards 7 15 What data is available in? Data Warehouse Level 1 Subgroups and Program Service Data NYS Test Scores
Hosted PBX QUICK START GUIDE. Call Recording SmartRecord V4 SP7
 Hosted PBX QUICK START GUIDE Call Recording SmartRecord V4 SP7 HOSTED PBX CALL RECORDING INTRODUCTION This guide provides information about Hosted PBX Call Recording End User Interface features, functions,
Gradebook Entering, Sorting, and Filtering Student Scores March 10, 2017
 Gradebook Entering, Sorting, and Filtering Student Scores March 10, 2017 1. Entering Student Scores 2. Exclude Student from Assignment 3. Missing Assignments 4. Scores by Class 5. Sorting 6. Show Filters
Visual Insights system
 Visual Insights system Supplier User Guide Packaged (Pick by store) version Date: September 2016 1 Contents Visual Insights system... 1 Supplier User Guide... 1 Grocery version... 1 1.0 Overview and Purpose...
Chapter 1 : Getting Started with Integrity... Chapter 2 : Interface Layout... Chapter 3 : Navigation... Chapter 4 : Printing...
 .0 User s Manual Table of Contents Chapter : Getting Started with Integrity... Chapter : Interface Layout... Chapter : Navigation... Chapter : Printing... Chapter : Quick Search and Results Pane... Results
Chronodat Help Desk (Lite)
") Chronodat Help Desk (Lite) (User Manual) By CHRONODAT, LLC For further information, visit us at www.chronodat.com For support, contact us at support@chronodat.com Version 2.0.0.0 Created: 10-03-2018 1
Chronodat Help Desk (Lite) (User Manual) By CHRONODAT, LLC For further information, visit us at www.chronodat.com For support, contact us at support@chronodat.com Version 2.0.0.0 Created: 10-03-2018 1
FRGGR90 Closeout Workflow for Funds Ending on Contracts and Grants
 Finance Systems Management Date: 10/24/2016 FRGGR90 Closeout Workflow for Funds Ending on Contracts and Grants The following steps will outline the procedure for running Report FRGGR90 Closeout Workflow
Chronodat Help Desk. (User Manual) By CHRONODAT, LLC
 By CHRONODAT, LLC") Chronodat Help Desk (User Manual) By CHRONODAT, LLC For further information, visit us at www.chronodat.com For support, contact us at support@chronodat.com Version 2.0.0.0 Created: 09-24-2018 1 P a g e
Chronodat Help Desk (User Manual) By CHRONODAT, LLC For further information, visit us at www.chronodat.com For support, contact us at support@chronodat.com Version 2.0.0.0 Created: 09-24-2018 1 P a g e
Mastering the Environment WVU ecampus
 Mastering the Environment WVU ecampus Information Technology Services, West Virginia University Service Desk (304) 293-4444, ITShelp@mail.wvu.edu Mastering the Environment of WVU ecampus 1 Table of Contents
Getting Started with Qualtrics
 Getting Started with Qualtrics Qualtrics Guidelines 1. The Office of Institutional Effectiveness provides the following guidelines when sending surveys. If you do not follow these guidelines, your access
TRAINING GUIDE. Web App End User Training
 TRAINING GUIDE Web App End User Training Web Application End-User Training In this booklet, we will introduce you to the Lucity Web application. The Web system allows you to utilize customized views, forms,
NEXTIVA ANALYTICS USER GUIDE. nextiva.com/support
 NEXTIVA ANALYTICS USER GUIDE nextiva.com/support Contents Logging In... 2 Landing Page... 2 Reporting... 3 Total Count Chart... 4 Count by Day Chart... 4 Hourly Average Chart... 4 Counts by State Chart...
Notice of Intent (NOI) Faculty & Department User Guide
 Faculty & Department User Guide") Notice of Intent (NOI) Faculty & Department User Guide Last Updated: 11/10/2017 Page 1 of 12 Table of Contents Background... 3 Accessing the NOI... 4 How to obtain access... 4 Logging in... 4 Viewing Permissions...
Notice of Intent (NOI) Faculty & Department User Guide Last Updated: 11/10/2017 Page 1 of 12 Table of Contents Background... 3 Accessing the NOI... 4 How to obtain access... 4 Logging in... 4 Viewing Permissions...
Version 1.6. UDW+ Quick Start Guide to Functionality. Program Services Office & Decision Support Group
 Version 1.6 UDW+ Quick Start Guide to Functionality Program Services Office & Decision Support Group Table of Contents Access... 2 Log in/system Requirements... 2 Data Refresh... 2 00. FAME Chartfield
Getting started with Inspirometer A basic guide to managing feedback
 Getting started with Inspirometer A basic guide to managing feedback W elcome! Inspirometer is a new tool for gathering spontaneous feedback from our customers and colleagues in order that we can improve
Customise your module structure
 VITAL how to guides Customise your module structure Creating new menu items in a module menu Editing menu items in a module menu Re-ordering items in a module menu The Module Page elearning Unit Last updated:
Admissions & Intro to Report Editing Participants Guide
 IBM Cognos Analytics Admissions & Intro to Report Editing Participants Guide Welcome to Cognos - Admissions and Introduction to Report Editing! Today s objectives include: Gain a Basic Understanding of
How to use the Sales Based Availability Dashboard
 How to use the Sales Based Availability Dashboard Supplier Guide Sept 2017 v1 1 Contents What is Sales Based Availability and why is it important?... 3 How is Sales Based Availability calculated and how
National Geographic Learning Panorama Teacher s User Guide
 Table of Contents Logging in to the System... Using the Header Bar... 3 Resources... 5 Navigating the Teacher s Edition Content... 7 Content Tools... Search... 2 Standards Correlations... 4 Assignments...
FORMSTACK ONLINE FORMS
 FORMSTACK ONLINE FORMS Introduction The online application forms are built through a product called Formstack. With Formstack you can build intelligent and professional looking forms and map them into
Veco User Guides. Grids, Views, and Grid Reports
 Veco User Guides Grids, Views, and Grid Reports Introduction A Grid is defined as being a list of data records presented to the user. A grid is shown generally when an option is selected from the Tree
IPEDS Human Resources Survey
 IPEDS Human Resources Survey - 2018 User Guide For Reports Version 5 November 2018 Table of Contents Overview... 3 Log in Procedure... 4 Running Reports... 6 Export Reports to Excel... 9 Drill Down to
The Researcher Development Online Tool User Guide for AUT Postgraduate Research Students
 The Researcher Development Online Tool User Guide for AUT Postgraduate Research Students What is the Researcher Development Online Tool Used For? You can use the Researcher Development (RD) Online Tool
How to use the Instant Atlas tools
 How to use the Instant Atlas tools 1. Open an internet browser and navigate to the Research and Statistics homepage www.cipfastats.net. Please click the Login link at the top of the page and enter your
Broker ASSESS administrator s guide
 Broker ASSESS administrator s guide This guide focuses on administrative tasks. Please consult the Broker ASSESS user s guide for a broad explanation of the following, which will not be covered within
Creating a Recording in Canvas Embedding a Recording in Canvas To embed a recording into a discussion
 Table of Contents What is Kaltura... 3 Things to Remember... 3 My Media... 3 To access My Media... 3 Upload Media... 4 To perform a media upload... 4 Viewing Videos... 6 Add New List Options... 6 Media
Chronodat Issue Tracker Add-in. User Manual CHRONODAT, LLC. February 15, 2017 Version P age
 Chronodat Issue Tracker Add-in User Manual CHRONODAT, LLC February 15, 2017 Version 2.0 1 P age Introduction The introduction section of the document describes the scope and objective of Office 365 Chronodat
Query Studio Training Guide Cognos 8 February 2010 DRAFT. Arkansas Public School Computer Network 101 East Capitol, Suite 101 Little Rock, AR 72201
 Query Studio Training Guide Cognos 8 February 2010 DRAFT Arkansas Public School Computer Network 101 East Capitol, Suite 101 Little Rock, AR 72201 2 Table of Contents Accessing Cognos Query Studio... 5
Chemical Marketing Concepts LLC MySamplecenter.com Quick Reference Guide
 Chemical Marketing Concepts LLC MySamplecenter.com Quick Reference Guide Welcome to our end-user portal! MySamplecenter.com was developed to provide you with a simple, cost effective, and accurate means
CASCAID Manager User Guide
 CASCAID Manager User Guide Free with every subscription, CASCAID Manager is our powerful management and tracking suite that will allow you to monitor and evaluate your users activity and better support
Department of Instructional Technology & Media Services Blackboard Grade Book
 Department of Instructional Technology & Media Services Blackboard Grade Book In your control panel, go to Assessment and grade center. Creating a Test In the Assessment section of the Control Panel, click
Compliance Document Manager User Guide
 Compliance Document Manager User Guide Contents OVERVIEW... 3 SYSTEM REQUIREMENTS... 3 VENDORMATE PASSWORD REQUIREMENTS... 3 LOGIN... 4 THE HOME SCREEN... 5 BA Screening... 5 BA Oversight... 5 My Screening
ParcelQuest Quick Reference Guide
 ParcelQuest Quick Reference Guide Table of Contents BASIC SEARCHING Where is the Get Me Close search box? 3 Where is the Find My Parcels search area? 3 Where can I perform a Radius or Comp search? 4 How
Getting Started Guide
 Getting Started Guide Sage MAS Intelligence 90/200 Table of Contents Getting Started Guide... 1 Login Properties... 1 Standard Reports Available... 2 Financial Report... 2 Financial Trend Analysis... 3
TxAIR Training Manual
 Introduction and Overview TxAIR, the Texas Achievement Items Repository, is a TEKS-aligned system that provides science and mathematics resources for grades 3 8, Integrated Physics and Chemistry, Biology,
Creating and Managing Surveys
 S Computing Services Department Creating and Managing Surveys Select Survey Apr 2016 Page 0 of 27 U n i v e r s i t y o f L i v e r p o o l Table of Contents 1. Introduction... 2 2. How to Access the Survey
Records and Enrollment Participants Guide
 IBM Cognos Analytics Welcome to Cognos Records and Enrollment Training! Today s objectives include: Gain a Basic Understanding of Cognos Understand University policies on data security including FERPA
An Introduction to Oracle Business Intelligence
 Table of Contents Introduction... 2 What is OBI...2 What is a Dashboard?...2 Accessing OBI... 3 Viewing Data via Dashboards... 4 Using Favorites... 5 Filtering Data... 6 Changing the way data is displayed...
Import Grades from Canvas to My Sac State
 Import Grades from Canvas to My Sac State This manual will show you the process of assigning letter grades in Canvas, exporting grades from Canvas to a CSV file, and importing and approving grades in My
SmartView. User Guide - Analysis. Version 2.0
 SmartView User Guide - Analysis Version 2.0 Table of Contents Page i Table of Contents Table Of Contents I Introduction 1 Dashboard Layouts 2 Dashboard Mode 2 Story Mode 3 Dashboard Controls 4 Dashboards
Advanced Training Manual: Surveys Last Updated: October 2013
 Advanced Training Manual: Surveys Last Updated: October 2013 Advanced Training Manual: Surveys Page 1 of 28 Table of Contents Introduction Training Objective Surveys Overview Survey Table Survey Options
DEPARTMENT OF EDUCATION. Schedules
 DEPARTMENT OF EDUCATION EDUCATOR CERTIFICATION Contents Revision History... 2 Revision History Chart... 2 1. How do I get started?... 3 2. Selecting a Schedule?... 5 3. Viewing the selected results...
USING ITEM SYNC FINESTRA POS
 USING ITEM SYNC FINESTRA POS POSitec is pleased to provide the Item Sync program to support the review and apply process for items presented based on your Pharmasave My Catalogue subscription. Item Sync
RITIS Training Module 9 Script
 RITIS Training Module 9 Script Welcome to the Regional Integrated Information System or RITIS Module 09 CBT. To begin, select the start button or press Shift+N on your keyboard. This training module will
I. Overview... 2 A. Users and User Roles... 2 B. System Information... 2 C. Help Menu... 3 D. Changing Your Password... 3 E. Logging In... 3 F.
 I. Overview... 2 A. Users and User Roles... 2 B. System Information... 2 C. Help Menu... 3 D. Changing Your Password... 3 E. Logging In... 3 F. Logging Off... 4 G. Navigation Bar... 4 II. Search Menu...
CCRS Quick Start Guide for Program Administrators. September Bank Handlowy w Warszawie S.A.
 CCRS Quick Start Guide for Program Administrators September 2017 www.citihandlowy.pl Bank Handlowy w Warszawie S.A. CitiManager Quick Start Guide for Program Administrators Table of Contents Table of Contents
Project and Portfolio Management Center
 Project and Portfolio Management Center Software Version: 9.42 Getting Started Go to HELP CENTER ONLINE http://admhelp.microfocus.com/ppm/ Document Release Date: September 2017 Software Release Date: September
GETTING STARTED. A Step-by-Step Guide to Using MarketSight
 GETTING STARTED A Step-by-Step Guide to Using MarketSight Analyze any dataset Run crosstabs Test statistical significance Create charts and dashboards Share results online Introduction MarketSight is a
CHRIS Introduction Guide
 1 Introduction... 3 1.1 The Login screen... 3 1.2 The itrent Home page... 5 1.2.1 Out of Office... 8 1.2.2 Default User Preferences... 9 1.2.3 Bookmarks... 10 1.3 The itrent Screen... 11 The Control Bar...
Getting Started With. A Step-by-Step Guide to Using WorldAPP Analytics to Analyze Survey Data, Create Charts, & Share Results Online
 Getting Started With A Step-by-Step Guide to Using WorldAPP Analytics to Analyze Survey, Create Charts, & Share Results Online Variables Crosstabs Charts PowerPoint Tables Introduction WorldAPP Analytics
Institutional Reporting and Analysis (IRA) For help, blitz "Financial Reports", or
 For help, blitz Financial Reports, or") Institutional Reporting and Analysis (IRA) 1 Training Agenda Introduction to the IRA Reporting Tool Logging onto the system (4-5) Navigating the Dashboard (6-10) Running Reports (11-12) Working with Reports
Institutional Reporting and Analysis (IRA) 1 Training Agenda Introduction to the IRA Reporting Tool Logging onto the system (4-5) Navigating the Dashboard (6-10) Running Reports (11-12) Working with Reports
Day 1 Agenda. Brio 101 Training. Course Presentation and Reference Material
 Data Warehouse www.rpi.edu/datawarehouse Brio 101 Training Course Presentation and Reference Material Day 1 Agenda Training Overview Data Warehouse and Business Intelligence Basics The Brio Environment
Help Guide DATA INTERACTION FOR PSSA /PASA CONTENTS
 Help Guide Help Guide DATA INTERACTION FOR PSSA /PASA 2015+ CONTENTS 1. Introduction... 4 1.1. Data Interaction Overview... 4 1.2. Technical Support... 4 2. Access... 4 2.1. Single Sign-On Accoutns...
Planning User Manual
 Planning 11.1.2 User Manual Budget Office May 2011 Hyperion Planning/Workspace/Reports Hyperion Planning Overview.... 3 Logging In.... 3 Setting User Preferences.... 3 Workspace Logging In..4 Navigating
My Query Builder Function
 My Query Builder Function The My Query Builder function is used to build custom SQL queries for reporting information out of the TEAMS system. Query results can be exported to a comma-separated value file,
Blackboard Student Quick Reference Guide
 Blackboard Student Quick Reference Guide Welcome to Blackboard, UTT s E-Learning System! This Quick Reference Guide is designed to help get you started using Blackboard Release 9.1.120113.0. Page 1 of
User Guide. General Navigation
 User Guide General Navigation Table of Contents INTRODUCTION 2 TECHNICAL REQUIREMENTS 3 Screen Display for Laptop 3 Screen Display for Desktop PC 3 NAVIGATION 4 Contact Us 4 Log Out 4 Menu > Sub Menu Display
EDITING AN EXISTING REPORT
 Report Writing in NMU Cognos Administrative Reporting 1 This guide assumes that you have had basic report writing training for Cognos. It is simple guide for the new upgrade. Basic usage of report running
Roster Central v2.0. User Guide
 Roster Central v2.0 User Guide Version 0.4 Status Final Issue Date 04/02/2009 1. Log into Roster Central 2. Click on the Change Password link displayed in the left of the title bar The change password
OneView. User s Guide
 OneView User s Guide Welcome to OneView. This user guide will show you everything you need to know to access and utilize the wealth of information available from OneView. The OneView program is an Internet-based
Create & Use Your Own Teaching Website BJORN CANDEL FUJAIRAH MEN S COLLEGE
 Create & Use Your Own Teaching Website BJORN CANDEL FUJAIRAH MEN S COLLEGE 2 Go to www.kahoot.it 3 Here are some different ways to communicate with your students and deliver your classes 28 February 2018
Kapi olani Community College. Training Manual
 Kapi olani Community College Training Manual eportfolio Introduction Getting to the Gateway Page The Kapi olani Community College eportfolio is located at the following URL: http://eportfolio.kcc.hawaii.edu/portal.
ATS Questionnaire Management Interface (QMI) School Administrator Manual
 School Administrator Manual") 2014 ATS Questionnaire Management Interface (QMI) School Administrator Manual 1 Table of Contents QMI: BATCH PAGE...3 LOGGING IN TO THE QUESTIONNAIRE MANAGEMENT INTERFACE...4 SEARCHING FOR EXISTING BATCHES...5
2014 ATS Questionnaire Management Interface (QMI) School Administrator Manual 1 Table of Contents QMI: BATCH PAGE...3 LOGGING IN TO THE QUESTIONNAIRE MANAGEMENT INTERFACE...4 SEARCHING FOR EXISTING BATCHES...5
Login: Quick Guide for Qualtrics May 2018 Training:
 Qualtrics Basics Creating a New Qualtrics Account Note: Anyone with a Purdue career account can create a Qualtrics account. 1. In a Web browser, navigate to purdue.qualtrics.com. 2. Enter your Purdue Career
Creating and Managing Surveys
 Creating and Managing Surveys May 2014 Survey Software Contents 1. INTRODUCTION 2 2. HOW TO ACCESS THE SURVEY SOFTWARE 3 The User Profile 3 3. GETTING STARTED ON A NEW SURVEY 5 4. FURTHER WORK ON SURVEY
Training Manual and Help File
 Training Manual and Help File 30.06.2011 Update Manage Grow Welcome to your new Juniper Website Management System with CMS Introduction The Juniper Website Management System with CMS (Website Content Management
User Manual. perfectionlearning.com/technical-support
 User Manual perfectionlearning.com/technical-support 1 User Manual Accessing Math X... 3 Login... 3 Forgotten Password... 3 Navigation Menu... 4 Logout... 4 Admin... 5 Creating Classes and Students...
Altus Call Recording. Dashboard Admin User Guide. Document Version Maryland Way, Suite 300 Brentwood, TN Tel
 Altus Call Recording Dashboard Admin User Guide Document Version 1.3 5121 Maryland Way, Suite 300 Brentwood, TN 37027 Tel +1 615.465.4001 WWW.ALTUSUC.COM Table of Contents About This Document... 5 1.1