Quodfish Operators Manual
|
|
|
- Reynard Simon
- 5 years ago
- Views:
Transcription


1 Quodfish Operators Manual Copyright Chartworx B.V., Versie
2 CONTENTS 1. Before you start sailing with Quodfish Which functions are supported by my system Introduction to basic menu s The use of icons and system menu s User database (UDB) User files track file User files Way Points (for example see section 13b) Arpa AIS Log book Raster charts Modules a. 3-d b. Proudman tidal module Miscellaneous subjects a. Sources of digital charts b. Making a way point file c. Short cut keys vessel marks d. Automatic scale change Versie
3 annex A The installation of Chartworx software and digital charts annex B Installation of the database annex C C-Map real time update service for cm professional (+) (cm93/3) 101 annex D Chart manager for Max Pro 102 annex E Quodfish electronic chart series functions 105 Versie
4 1 1. Before you start sailing with Quodfish Quodfish is a practical aid to prepare an intended voyage and indeed an indispensable tool to support safe navigation and maritime operations Whether you are new to using an Electronic Chart System or an experienced Quodfish user, it is most recommendable to spend some time in familiarising yourself in the functions of Quodfish before actually taking it out to sea. To be able to make the most effective use of the system it is necessary to interface the system to a GPS receiver. It may also be possible to interface your system to other equipment like echo sounder, automatic pilot, gyrocompass, ARPA radar etc. This is depending on the type of Quodfish system you have acquired. Please check against the capability matrix in the back of this manual. In the first place the CD purchased from either your dealer or Chartworx has to be loaded into your PC. The PC used to operate the Quodfish system should support the following:- Windows 7 or 8 Pentium CPU minimum 2 GHz preferably dual core Pointing device (mouse with mouse wheel and 3d (middle) button or similar. Minimum free disc space (on C disc) 40 Gb Sufficient internal memory 2048Mb Minimal 2 USB ports for dongles to protect data and software Serial port (GPS) if the GPS has a serial output plug or otherwise USB port for GPS DirectX version 9.0C CD / DVD drive VGA card with a screen resolution of 1024x768, 32 bits colour Internet Explorer version 6.0 or higher. A RS 232 cable to connect the GPS to the computer if so required. Before you start installing the Chartworx software and the digital chart data, please make sure that your version of Windows has been updated with the most recent updates provided by Microsoft. The same applies for the software drivers of the Mother board, BIOS, CD / DVD driver s video board and PCI / USB COM ports. The actual installation is a straightforward Windows feature. It is described in detail in Annex B of this manual. Basically it should in most cases be sufficient to click Next until Finish or During the final stage of the installation process the system will look for some particular drivers. If these drivers have not been installed in the past, the system will ask to load these drivers from the (Windows) system CD. In this case the computer should be switched off (and on) after the installation before further usage. Versie
5 Connect the GPS receiver to the PC. This should preferably be done with both the GPS and the PC switched off to prevent any damage. For further information about connecting a GPS receiver see annex A of this manual Versie
6 2 2. Which functions are supported by my System Chartworx Quodfish systems can be delivered in several versions supporting, depending on the version, more or less functions. All systems however support all the functions necessary for safe navigation. Which functions your system supports can be seen from the capability matrix in the back of this manual. (Annex E) This manual describes all the functions being supported by Quodfish 610. If you have another Quodfish system some functions may not be supported. Attempting to activate a function not supported by your system may result in a message informing you about this. Versie

7 3 3. Introduction to Basic Menu s Several practical and straightforward designed menus allow an operator to use to the full, all facilities for planning, storing of gathered data and to view the chart content and the information of the interfaced sensors using any display scale. In the next pages these menus will be explained step by step supported where applicable with examples. First the start page which disappears automatically after some seconds. It shows information about the type of software being used (e.g. Quodfish 210 or Quodfish 610 etc.) and the version number of the software. It also shows the Chartworx Internet address where all information about Chartworx systems, databases and other services can be found. Versie
 shows that National Hydrographic Offices do not accept any responsibility for the correctness of the electronic chart data shown by this system.")
8 Until the user clicks Done this page shows the Disclaimer and the product version number. The next displayed page (Warning) shows that National Hydrographic Offices do not accept any responsibility for the correctness of the electronic chart data shown by this system. Furthermore a warning is displayed that neither this system nor the used electronic chart data may be used to replace official navigational publications. After clicking OK on this page and if only one database or one chart was purchased with the system, this chart will be displayed automatically. The area or part of the database, which is displayed, is random. However as soon as the system receives incoming signals from the navigation receiver, it will display the position of the vessel on the chart. If the system does not receive the appropriate signal the receiver output should be checked for output in NMEA0183 protocol and the interface of the navigation receiver to the correct computer port. See also below and if necessary annex A. Versie


9 It may now be necessary to check and if necessary correct the basic parameters. Click File and thereafter Properties. Note that where appropriate a keyboard can be shown on the display by clicking on keyboard. Under General the lay out of the presentation of cursor co-ordinates can be selected. The cursor is either the small arrow or the cross hair being moved with the mouse or roller ball. Select ddd mm.fff for a presentation in degrees, minutes and decimal minutes. Versie

10 The other possibility is degrees, minutes and seconds and if desired tenths of seconds. Ships Position Format provides the same facility as described above for the ships position but here it is also possible to use the round off facility of the GPS by clicking on Rcv. At the right side of the cursor / ships position format presentation selection tools one finds the possibility to select the desired language. With Cursor shape you can choose for a cursor displayed as an arrow or a cross hair. A choice of units for depth and distance parameters are the remaining options in this part of the General menu. Using the system the first time absolutely requires to fill in the sub menu Devices otherwise the GPS signal may not be recognised. The instructions below assume a GPS receiver to be used for positional input. A RS232 cable or USB cable is used to connect the GPS receiver to the computer and the computer port is known. Under Device type a NMEA 183 receiver is selected. Type under Name RecNMEA This is a free input field so if the user desires to put another name in this field he can do so. When actually using the system the Name will be display under the display of the actual time. The actual chart datum must be selected under Datum e.g. WGS 84. Versie
11 Normally standard values are shown in Port, Speed and Parity although under Port the COM port used for the GPS must be mentioned Rcvr kind should only be changed if a GPS receiver with a non-standard protocol is being used (e.g. a Garmin set to Garmin protocol output). View, when clicked on shows the data stream from the GPS to check that the GPS is outputting data. In a similar way the output of another sensor e.g. the ARPA can be checked. If an echo sounder has been interfaced, this should be indicated in the column Device Type (Depth Snd) Note that in the last column under Sub Type, the echo sounder depth can be set either under the transducer DBT or from the sea surface DBS. This is assuming that the echo sounder provides the option. Other devices to select are: ARPA, Auto pilot, Gyro, Log, Sonar, Wind, Bottom discrimination and AIS. Other options are a possibility to check the connected devices, a combined input of AIS and GPS and to select an IP port. The third option of Properties is Track colour. This enables the user to allocate certain colours to certain speed or depth brackets. These will be displayed on the display in the wake of the vessel and, when the Track option is activated the speed of the vessel or the depth will be recorded in the track file on the disk in colour as well. (See also section 6). Instead of displaying and recording the speed or the depth, the system provide an option to show the roughness of the bottom when Bottom discrimination under the Track colour option is activated. This requires special equipment (Seascan) to be interfaced between the echo sounder and the system. Versie

12 If more colours are required, simply click on one of the colours and a new selection of colours will be displayed. Versie

13 The next submenu of Properties is Options. This enables the user to select thicker lines on the display for various functions where the actual thickness may be selected using the line thickness option on the right hand side of this menu, to select the C-MAP chart boarder showing a division of the chart boarder in minutes identical to the paper nautical chart, and to select the display of AIS labels. Furthermore this menu allows to choose the Chart resolution and the screen size of the monitor in use. On the left hand site on the bottom one can fill in the MMSI number and the Ship s name. The right hand side offers the option to choose the colour of the 2 Point Cursor, the Default vessel Colour and the Default Arpa Colour. Chart Resolutions: This menu (shown below) allows you to set the dimensions of the monitor. Versie

.")
14 Autopilot This menu contains the input fields necessary to use the Auto Pilot (see the manual of your Auto Pilot). Versie

15 Offsets Versie

16 Safety Depth The contour line selected as danger contour is depending on the safety depth input under Safety depth. The Deep water contour is the limit for deep waters. The Safety contour is the contour related to own vessel to be used to distinguish between safe and unsafe waters. The Shallow water contour is the limit for shallow waters. The Safety depth is the vessels draught + the required under keel clearance. Soundings below the safety depth in the chart will be shown coloured grey. Otherwise they will be shown in black. The Safety height relates to under bridge clearance. Versie

17 Alarm function With the Alarm function it is possible to get a visual indication of possible dangerous obstacles. The function offers different types of sectors to be guarded. 1. Corridor Guard zone 2. Sector Guard zone 3. Circle Guard zone en 4. Combined Guard zone The Corridor Guard zone uses a rectangular shape with selectable latitude. The Sector Guard zone uses a wedge of cake shape with a selectable angle. The Circle Guard zone uses a circle with a selectable radius. The Combined Guard zone uses a combination of the above mentioned shapes. Possible dangerous objects (e.g. buoys) will be marked with a red square around the object. Possible dangerous areas (e.g. contour lines) will be marked with a red line. The contour line selected as danger contour is depending on the draught input under Offsets in the menu File > Properties Versie

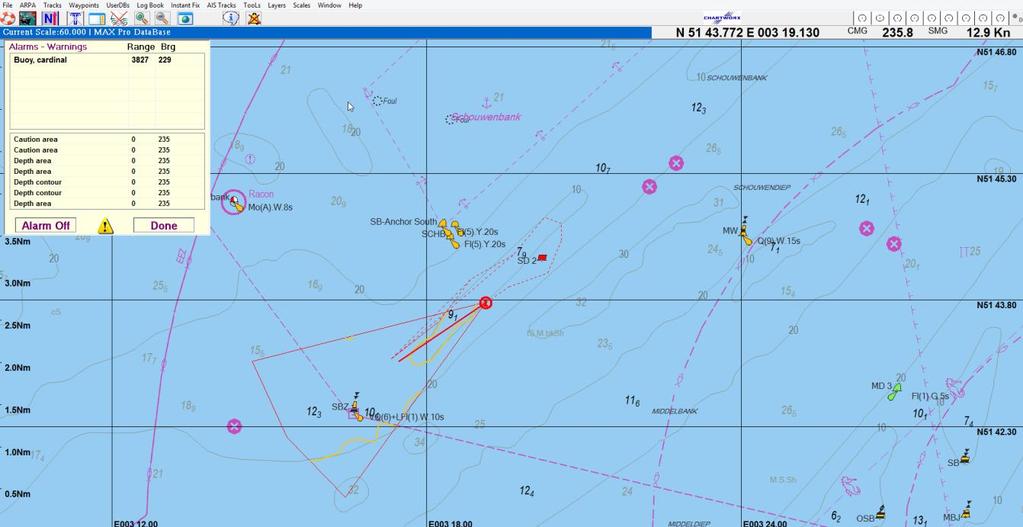
18 The use of Alarm functions Assuming that the alarm function has been activated as described above clicking with the left hand mouse button over the bell shaped icon in the icon bar will, assuming that there are any objects within the sector that causes the system to warn the operator, it may apart from an audio alarm generate a window as shown below. The sector width is 30% and the length matching the selected length of the ships heading line as selected under Extra. The top window shows the actual dangerous objects while the bottom window shows the caution areas. Note that the ship is sailing just across a restricted area. The area has been highlighted by the operator by double clicking in the window on restricted area.. Versie

19 Versie
.")
20 By double clicking in the window on a selected object this object will be highlighted in the alarm sector. In the example the yellow beacon has been highlighted. Clicking on the yellow triangle at the bottom of the Alarms Warnings window will reduce the window to show only the Alarms (see next page). Clicking on the yellow triangle reduces the window to show only the dangerous objects. Clicking on the triangle again will bring back the warnings as well. Versie

21 The Basic Display Assuming a C-Map database has been opened the display would show up more or less similar as seen below. Note that the displayed chart area may be different. Of the variable values only the geographical position of the cursor is shown. As soon as a signal from the GPS is received the display looks a lot more complete. In the case as shown in the example above, the ships position is shown and the system has already worked out the course and speed over the ground of the vessel. Users experience the continuous display of bearing and distance to the cursor as very useful. In this case the bearing and distance from the ship to the position of the cursor is degrees, distance 5 Nm. Note that in this case the unit of distance has been set to miles under File/Properties. To get a better insight in the many functions your system offers we will use the display as shown above starting with the menu buttons at the top. These buttons activate the main menu s to operate the system. File : Here we find the available C-Map databases and/or ARCS or Maptech raster charts. Versie
22 This menu is also used to import or export user data bases (UDB s) and to merge two of these UDB s. ARCS, BSB and C-Map charts may be installed via this option. There is also a function which enables C-Map subscription holders to update their charts via Internet or . An important part of this menu is Properties which handles, as described earlier, amongst others the connections and protocol to interfaced sensors. ARPA This sub-menu handles all the ARPA target information and the actual presentation of these targets. Files may be made to record ARPA target information. It is also possible to select earlier recorded ARPA files. Also the functions to display processed information from ARPA targets can be assessed through this sub-menu. It can, of course, only be used if an ARPA has been interfaced and your system supports this function. See for a detailed description section 8. Tracks This menu covers the handling of recording your track. It is also possible through this menu to select and view previously recorded tracks. Other parameters such as track interval, track colour etc. can be selected as well under this menu. This menu enables you to save the depth of the echo sounder directly to a database, which can be used to improve the three-dimensional display of the bottom. See for a detailed description section 6. Way Points This menu enables you to plan your intended voyage. A series of turning points (called Way Points) can be established. These way Points are connected with lines (your planned course lines). Way Points can be edited such as deleting points, moving points or adding points, changing the colour of the route etc. The Way Point files can be filed for future use. See for a detailed description section 7. User Data Bases One of the most powerful tools of your system is the facility to create your own databases. It enables you to add lines, circles, polygons, and a number of symbols, text and many more features. It provides an excellent way of putting Notices to Mariners in a database which can be superimposed on your database to immediately view any changes in navigational objects, warnings etc. It can also be used to mark your own observations for future reference or to mark dangerous objects. With Set mark symbols one can put any of the symbols displayed at the right hand side of the icon bar to any position on the chart. The user can also display a database, derived from notices to mariners (NTM), as extra layer over the chart. A unique method to keep your chart (temporarily) up to date. See for a detailed description section 5. Log Book : The Logbook can be used as your narrative of your journey. It enables you to file everything you experience during your voyage, your maritime operations and other things worthwhile to record for future analysis etc. It is possible to export your logbook onto a floppy or hard disk for instance to transfer it to a spreadsheet or any other database format. See for a detailed description section 10. Versie
23 Instant Fix A useful tool to immediately drop a fix. Can also be set to a certain time interval i.e. in equivalence with noting you position at certain fixed intervals in the paper chart. Can also be used as man over board knob however a special icon (top left) or the asterisk (*) of the numerical pad may be used as well. See for a detailed description section 4. AIS Tracks This menu enables the user to plot AIS tracks Tools Tools enables the user to change the chart colour or to adjust the chart colour for dawn/dusk and night vision. Other facilities covered by this menu are the possibility to change the heading line length, to select connected devices, to apply an offset to the navigation receiver position and to display tidal current at other dates and times than the current one. With this function one can also, when using a C-Map chart, display the vertical tidal curve of over 4000 locations world-wide. Although it but seldom happens, it is possible that the so-called ini-file gets damaged by unforeseen interrupts. This menu offers the possibility to create a copy of the ini-file to replace the damaged one. See for a detailed description section 4. Layers The Layer menu is divided in Chart Information, AIS / Arpa targets and Supplementary Information. Chart Information C-Map databases are built up in layers. This makes it possible for the user to select only the chart information he wants to be displayed. Through the layer menu layers can be enabled or disabled. The user may for instance not really be interested in the light characters of buoys during daylight or one may be interested to see the 10 meter contour line but not any other deeper contours. Many combinations are possible. The strength of this facility lies in the possibility to reduce the chart information, particularly in confined waters, to the most essential information necessary for save navigation. AIS / Arpa targets See section 8 and 9 Supplementary Information This function is only available when using C-MAP by Jeppesen MAX Pro charts. See page 39. Scale One of the (many) advantages of an electronic chart is the facility to change scale of the chart on the screen. The user needs to be aware that zooming in on a, from origin small scale chart, can reduce the accuracy of the displayed chart considerably. With Quodfish systems one can either change scale using the Scale menu or simply use Page Up and Page Down buttons on the keyboard or the zoom in/out icons or, if available, use the centre mouse wheel. For raster charts one can use the right hand mouse button. See for a detailed description section 4. Versie
24 Windows When clicking on Windows the icons bar disappears and leaves more space for the chart. Help Provides the standard Windows facility to explain details of facilities available in your system. Much more easily is, in case any function needs more explanation, to click on the Chartworx logo in the top bar and open the digital manual and using the Word search facility to find the subject (see below under The Chartworx logo). About provides you with information about Chartworx copyright to software and chart data. The Chartworx logo By clicking on the Chartworx logo (next to the help button) some very useful information about Chartworx and its products can be viewed. Under the Chartworx logo you will also find this manual as a MS Word document. (On Chartworx website this manual can be found as a PDF file). Topics can be looked easily up through Search. The right hand mouse button This button offers you a quick way to carry out certain actions. Under this button one finds sub menus for Normal mode and User file mode (See sections 5, 6 and 7) This concludes the brief introduction to the menus of your system. The next pages will explain the meaning of the displayed icons and cover in more detail the actual use of the menus. Versie
25 4 4. The use of Icons and System Menu s The top two bars of the display show the menu buttons, several icons and some symbols. The icons activate the following functions (from left to right): - Man overboard knob (drops immediately an instant fix) clicking on * gives the same result. Position, bearing and distance to the man over board will continuously be shown and updated. - Enables or disables Follow Ship If you look on a part of the chart outside the area where you are sailing, clicking this icon will immediately return you to the position of the vessel. By clicking on this item the following options are provided. a. The ships position is displayed on the chart and centres itself when about one third of the screen size from the edge. b. The ships position remains in the centre of the display (small red dot in the centre of the icon). c. The ships position repositions itself such that, depending on the actual heading of the vessel, most of the sea room is shown on the display (small red dot in the right upper corner of the icon). d. Follow ship is disabled. - Option to select either course up or north up. - Turn on or turn off track recording. - Switches on or off the information panel at the right hand side of the screen (Includes also Way Point information). - Activates the tidal current data (if tidal current database has been purchased). See also under Tools for the possibility to display tidal stream at other dates and times than the current one. - There are two icons to provide a possibility to zoom in and out (change scale) quickly. The next two icons display the 3D view. The first icon displays the 3D view based on the depth information. All Chartworx systems with a depth 3-D depth module can be started up twice. The second system can be shown on a separate monitor. By showing the 3-D option on this system the other system remains available at all times for safe navigation, The screen with the 3-D is not suitable for safe navigation! - The one but last icon is the information icon. When clicked upon it will change the normal cursor into the information cursor that may be moved over a particular object, and clicked upon to show additional information about this object - The last Icon is the alarm icon to activate the alarm window Versie
26 On the right hand side of the bar 9 symbols are displayed. Initially these 9 places are shown as small circles with a dot in the centre. By clicking with the right hand mouse button a menu appears where the user can choose a symbol (and a colour) to replace one of the circles If a User Data Base (UDB) is open for update and the user clicks on one of these symbols the symbol will be dropped in the ships position. This enables the user to mark certain positions in the wake of his vessel for future reference. Via Set Mark Symbols under User Databases these symbols can be placed in another position. See section 5. Versie

27 Just on top of the displayed chart (in the blue bar) the name of the database (or chart) in use is displayed. For C-MAP by Jeppesen Professional + data it will always display World notwithstanding that you may have ordered only one zone or area. When you use MAX Pro you will see MAX Pro database in the blue bar. Next to this information the ships position and the ships course and speed over the ground are displayed. More detailed instructions for the use of the system menus Under the File menu the sub-menu Properties has already been explained, as it is one of the essential menus to get started with the system. Other sub-menus of File are the following: Active Files: shows the names of the databases and/or charts being used (only if more than 1 database is opened). If the loaded chart is an ARCS chart you can find extra information by clicking on the info button. Open Chart File: To open a database or chart to be displayed. If only one database or chart has been purchased, it is not necessary to use this sub-menu, as the system will automatically display this database or chart at start up. Chart info & NtM If you load an ARCS chart, the Chart info & NtM button will show appropriate information about the chart and the status of the chart corrections. Properties A most important sub-menu. It is recommended that, once the user is happy with the initial settings, not to change the parameters. It is also recommendable to instruct users not to change any parameters unless one is absolutely sure about the implications, particularly for changes related to the GPS settings. However a sub-menu can be used at any time to check the presentation of co-ordinates, depth and distance units being used etc. The explanation of the following sub-menu is of particular interest to users who want to manipulate existing user databases (UDB s) Copy UDB from External Medium - Activating this sub-menu enables the user to select a user data base file from an external medium to copy to the hard disk of the computer. This includes UDB s from MaxSea and Sodena. Versie

28 Export UDB to External Medium - Activating this sub-menu enables the user to select a user data base file from the hard disk and to copy it to an external medium. The file size of the UDB is not critical. Export TDB to External Medium - Activating this sub-menu enables the user to select a track data base file from the hard disk and to copy it to a external medium. The file size of the TDB is not critical. Merge UDB s Provides a facility to merge two user databases into one new user database. Enter a name and select two user databases from the available user databases. Import UDB Files - Activating this sub-menu enables the user to import a UDB file from either a Sodena or MaxSea Fish plotter into the system. The system will recognise the original system format. Further handling is similar to Copy UDB from Floppy. Install ARCS charts - Activating this sub-menu enables the user to install ARCS charts. Install BSB charts - Activating this sub-menu enables the user to install BSB charts. CMAP DB Manager - Activating this sub-menu enables the user to install C- MAP CM93/3 data. CMAP DB License - To fill out the licence number for your C-MAP area CMAP RTU - With this menu you can automatically, if you have a subscription contract, update your C-Map charts via Real Time Chart Updating, Versie
29 UDB Update to v Import 3D depth Export 3D depth- Import RWS files Exit For a more comprehensive instruction please read the RTU manual. (see annex C). Updating MAX Pro data works different and will also be explained in Annex C To convert an older UDB to version This enables that older UDB s may be updated. When, under the Tracking menu, 3-D is activated, echo sounder depths will be recorded in a separate file to be used to improve the 3 dimensional image. It is possible through Import 3-D depth to load a similar file obtained from a colleague using a Quodfish system with a 3-D module. Similarly it is also possible to export a 3-D echo sounder file to provide it to another Quodfish 3- D user. Enables the user to import the updates buoyage file as provided approximately every two weeks by the Netherlands Department of Waterways and Public Works To exit the program. The program can also be closed using the small X (Windows feature) top right of the display. It is recommended to advise users not to play with the Windows button top right side of the screen. This may lead to an (unnecessary) restart of the software. Versie

30 The next pages describe in detail the contents of the chart database and how and when it is shown on the monitor of your system. As an example an area off the East Anglia coast near Felixstowe and Harwich has been selected. Starting with a small-scale display of the area (the selected scale in the example as shown above is 1: 750,000) we will zoom in, in the Harwich area. Normally at such a small scale the user will not expect to see for instance all the buoys in the area. C-Map databases are seamless and are based on both small scale and large scale charts from the same area. However the program will always show data equivalent to what the user is used to, when using a paper chart. So if the user increases the scale (that means to a smaller number 1:5,000 is a larger scale than 1:50,000!) the chart will start showing more detail. C-Map databases are divided in scale brackets (not to be confused with the Layer menu that enables the user to switch on and off certain details of chart information). These scale brackets (or scale break points) regulate the information shown in certain scale ranges. The increment or decrement of the amount of information can be noticed when passing the scale breaking points as described below. Apart from manipulating displayed content with passing scale brackets the Layer menu provides also a facility to clean up the displayed information by switching of some layers which are not of any significance for the user for a certain place and time. Versie

31 Zooming in by either using the Scale menu or Page Up/Page Down or the zoom in/out icons in the top bar brings us, in the above displayed example, to a scale of 1:60,000. This information is from the coastal chart of Felixstowe. C-Map databases are seamless which means that all charts, of all scales, match. However if under Layers Geographical Borders has been activated, the user will see the original borders of the paper chart that has been used to produce the digital information. If the original data from a National Hydrographic Office has been offered in digital form instead of the paper chart, these borders may not be visible. The user may however note that sometimes information seems missing or is not detailed enough. This can be caused by not looking at the correct chart scale. This shows the power of a seamless database which contains many charts of the same area, which always show the correct data at the correct scale. It is therefore important that the navigator, in accordance with good seamanship, always uses the correct scale depending on the area he or she is sailing through. Versie


32 Increasing scale to 1:12,500 in our example results in displaying all the necessary detail of the area near Harwich. This information came available after passing the scale bracket. The display shows the chart with all chart layers ON. The layer function Versie

33 On the next screen shot one can view charts with all layers, except buoys, lights and wrecks, switched OFF To illustrate the use of the Layer function a display of the area near Felixstowe with only a few layers switched on. No layer, which shows information directly important for the safety of the vessel, shall be switched off. Things to bear in mind when selecting layers are: size of vessel, draught of vessel, manoeuvrability of the vessel, depth, visibility, area, traffic etc. Versie
 the officials colours as defined by the International Hydrographic Organisation (IHO), to Alternative, a sometimes more preferred")

34 In the example below, with all layers on and the colour presentation has been switched from ECDIS (Electronic Chart Display and Information System) the officials colours as defined by the International Hydrographic Organisation (IHO), to Alternative, a sometimes more preferred presentation. The colours can be set under Tools The choice is entirely up to the user. The ECDIS colours come very close to the paper chart colours. Colour settings can be adjusted under Tools. Also under Tools the display can be adjusted for twilight and night. Versie

35 Changing the display scale This can be done by using the Scale menu. The scale can be adjusted by putting the mouse cursor on the arrow and move it either to the right or to the left. It is also possible to put the mouse cursor on the white bar and move the scale pointer to the desired value with continuous clicking of the left mouse knob. It is also possible to select an own scale. This can be achieved by putting in the desired value in the box own scale and ticking the box left of the input value. Another possibility to change the scale is by using the right hand mouse button (only when in normal* mode) or using Page Up or Page Down or the zoom in/out icons in the icon bar. (*) this means not in UDB-, Track-, and Way Point mode because in these cases the right hand mouse button handles a different menu. For an explanation of NAVSCALE.BOX see section 13d. Versie

36 Clicking on the Zoom in causes the scale display to be increased (enlarged) by one scale step. Clicking on Zoom out has the opposite effect. The top two lines of the right hand mouse button menu Overview and Normal Presentation are originally designed for ARCS raster charts. However they can also be used for vector charts to make standard scale jumps. Another way to change scale is by using the icons as described above or by using the Page Up and Page Down keys to respectively decrease scale and increase (enlarge) scale. Other functions that can be operated by using the right hand mouse button. Edit UDB Update file Edit Way Point Update File Edit Track Update File Edit ARPA Update File The above mentioned 4 functions relate to 4 kinds of user databases. Activating one of them results in a requirement to click the right hand mouse button again to open a menu specially designed for that particular own data file. Centre on cursor: The screen will centre on the present cursor position. This can also be achieved by pressing the Home button on the keyboard. However the quickest way to home on the cursor is to double click with the left hand mouse button. This also provides a way, because the cursor always returns to its original position, to move the screen rapidly in a certain direction. Versie

37 The function Hold Chart results in the chart staying stable i.e. not follow the ship. So the ship may move off the display. This result can also be achieved by clicking on the small icon, with a ship displayed on it, second from the left in the top bar. Clicking on this icon again will immediately result in the system jumping back to the ships position. Most useful when looking ahead on the chart and suddenly feeling an urge to see where you are. 2nd Point Cursor: provides a quick way to find out a bearing and distance between 2 points. Click on it and then move the cursor to the first point, click and drag the cursor to the second point, click the left hand mouse button again and a line will be shown between the two points with next to it a small window displaying bearing and distance between the two points. This action can be repeated to establish bearing and distance between other points. Finally switch of the function by clicking on 2nd Point Cursor again. The distance units used are set under Properties under the menu File. 2nd Point Cursor is most convenient to check your position by visual observations or distance measurements from onshore conspicuous and chartered objects. 2 nd Point Clear : When you used the 2 nd point cursor you can delete these points quickly via this function. Snap cursor : Displays a position from a chart database symbol or a UDB symbol. Activate the function and place the cursor now as a small square over the symbol. Click and the position, bearing and distance from the vessel and the CPA will be shown next to the symbol. Click again to remove the information. Information cursor : Displays the position from a UDB symbol and any text attached to it previously. Activate the function and move the small square with a capital I in it over the symbol. The position and text will be displayed next to the symbol. Click again to remove the information. Clicking on Snap cursor followed by clicking on Information cursor and there after clicking on the chart display enables the user to check the edition of the chart being used by C-MAP and it s last update (click on + in front of CMAP followed by position ). On completion click on Information cursor again to switch off info mode. Chart Information Clicking on Extra Information followed by clicking on Information cursor and there after clicking on the chart display or a particular object will have the same result as clicking on the Information Icon i.e. providing additional information from the MAX Pro object data base and information about the chart, latest update etc. On completion click on Information cursor in the right hand menu again, to switch off info mode. When all layers are activated under the menu Extra Information Go to Lat/Long position : Versie

38 Choose this function to centre the chart on a specific position. Type in the co-ordinates. An input in degrees-minutes-seconds or degrees-minutes-decimals of minutes is acceptable. Also in input in decimal degrees will be accepted e.g. 53 degrees and 30 minutes may be input as The box accepts free format so the user may use both options. Normally geographic co-ordinates are added with an indication whether the position is north or south of the equator and east or west of the Greenwich meridian. For Quodfish systems this indication may be omitted if the position in north of the equator and east of the Greenwich meridian. Standard abbreviations like N for North, S for South W for West and E for East are to be used. Another way to indicate the global quadrant is by using the mathematical convention using negative values left of the Y axis and blow the X axis and positive to the right of the Y axis and above the X axis. Summarising: N or + S or - E or + W or - (or no indication which means North) (may not be omitted) (or no indication which means East) (may not be omitted) It is also possible to indicate on which geographical Datum the co-ordinates are based. The list is restricted to the most common Datum s e.g. ED50, WGS 84 and OSGB 1936 (for the UK, if applicable). Go to Range/Bearing position : It is possible to move the cursor in a given direction over a given distance. Values to be input as shown above. Upon clicking Done the cursor will move to the new position. If necessary the chart display will be refreshed and centred on the new position of the cursor. It may be clear that the distance units as pre-set under properties will be used. Go to Decca Position. A facility specially built in for use on board Fishing Vessels. Versie

39 The Layer menu: The facility to split the chart information of vector charts into different layers is one of the most powerful functions of Quodfish systems. This facility cannot be offered when using raster charts. Apart from information obtained from digitising (vectorising) the paper chart, also information generated by the system like wake, User Data Bases (UDB s), instant fixes etc. can, through the layer menu, be activated or suppressed. For clarity reasons the objects have been divided into 4 main groups. It is possible to activate or de-activate a whole group by clicking a single button. It is also possible to activate/de-activate a single layer or to switch on or off all groups simultaneously. It is important to remember that under Other data groups (right hand bottom box,) User Data Base (UDB) information and other user information can be switched on and off as well. So if a UDB symbol or an Instant Fix does not show it may be because the relevant layer has been switched off. All groups on : All objects will be activated and shown upon clicking on done All groups off : The reverse of all groups on. The result will be that all chart information apart from the coastline and some mandatory information will be suppressed. Copy current to larger : Versie

40 The ticked objects will also be shown on the display on all scales larger than the present This option is most practical to prevent that every time the user decides to increase the scale the layers have to be activated again and also to fix the scale and larger where probably all objects can be displayed without cluttering or overwriting. Copy current to smaller : This will result in the same objects being displayed when the operator decreases the scale value. Done : Done must be clicked to confirm the settings as decided by the operator using the functions as described above. The menu will disappear and the chart with the new settings will be displayed. Supplementary Information (only for MAX Pro database) When supplementary Information is selected the window as shown below will appear. This enables the operator to select the additional layers with information from the MAX Pro database. The selected layers may be copied to higher and lower scales. It is also possible to select different layers settings for different scales. C-MAP Tides (tidal Heights and Streams). When this option is enabled the user will see the horizontal stream arrows superimposed over the chart. More detailed information can be obtained by first moving the cursor to the info icon, click on it (which will change the cursor into the info cursor) move to a particular stream arrow and click again. This will result in the window, as shown below, being displayed. Versie


41 This window now shows the rate and direction of the horizontal stream in this position for 24 hours on the date as shown in the date window. Clicking on Tide will show the vertical tidal movement as forecasted for this position. This is only possible when vertical tidal information is available for the area. This is indicated by a small yellow rectangular box It is also possible to display the information for other dates using the date window. Versie


42 MAX Pro Ports and Marina s This layer, when selected will show places where information about ports and marinas is available. These places are annotated with a small blue encircled sailing vessel. When the info cursor is moved over the blue sailing vessel and clicked upon a red square is put over the symbol and the following information may appear. Selecting Full will result in additional information about the source of the chart and a possibility to display additional information as shown in the left column. Versie

43 Selecting Port/Marina will result in additional information / warnings as shown in the right hand column and an aerial overview of the marina. If more marinas are available, additional views may be selected. The next available layer under Supplementary Information is GMDSS Sea Areas GMDSS stands for Global Maritime Distress Safety System. GMDSS sea areas serve two purposes: to describe areas where GMDSS services are available, and to define what GMDSS ships must carry. Prior to the GMDSS, the number and type of radio safety equipment ships had to carry depended upon its tonnage. With GMDSS, the number and type of radio safety equipment ships have to carry depend upon the areas in which they travel. GMDSS sea areas are defined by governments. The next layer is SAR Regions. The International Maritime Organisation has divided the world s oceans into 13 search and rescue (SAR) areas, in each of which the countries concerned have delimited search and rescue regions for which they are responsible. In many countries SAR is organised by the military in close co-operation with the national coastguard and national life saving organisations. Versie

44 The next layer is Roads. When this layer is selected a large amount of useful on shore data becomes available. Numerous different objects are shown on the chart ranging from hospitals, dentists, museums, police offices to local restaurants, public houses etc. By moving the Info cursor over an object the general location (see the example below) will be shown. When clicking on Full and selecting Road the location will be shown. The next examples show the information of several objects after Full has been selected. Versie


45 The following layer of Supplementary information is Space images. This layer shows satellite images superimposed on the chart resulting in a very realistic presentation of the land area. Note that under Layers / Chart Information not all layers have been activated to obtain a clear image. Note also the objects shown in the land area as described under Roads above.. Area with Space images overlaid above. Same area without Space images below Versie


46 The last layer of Supplementary Information is Terrain. The effect of this layer can only be shown on a very small scale i.e. covering a large area. It shows clearly the topography of the continent and particularly the large mountain ridges. Note that when this picture was taken the position of the cursor from the vessel was in bearing degrees at a distance of Nautical miles. Versie

47 On larger scales, up to 1 : , MAX Pro will also clearly depict the major dual carriage ways.. Versie

48 Instant Fix. Instant Fix : A facility which, when activated drops a fix, with time annotation, in the wake of the vessel at a certain time interval. It enables the user to overview the past track. It is also possible to drop an instant fix at any time using this menu. More practical is to use the man over board button in the top bar. Another possibility is to press the * on the right hand side of the keyboard (the number pad). The shift function of 8 cannot be used for this purpose. To remove the man over board fix, click on the I icon in the top bar and drag the info cursor to the man over board fix and click. The fix will disappear. It is also possible to remove the fix by using the method as explained below. The time interval can be set and ticking repeat will result in a repetition of the fix until changed or stopped by removing the tick. Fixes can be deleted by highlighting them and by pressing Delete. If more than one instant fix has to be deleted they must all be highlighted by dragging the mouse over them. Instant fixes will only be shown if the appropriate layer in the Layer menu has been activated. Versie

49 5 5. User Database (UDB) This section covers the use of User databases (UDB s). Some items are also relevant to Way Point files and Track files which will be covered in more detail in section 6 and 7 QUICK DRAWING OF A SEARCH AREA. It is possible to draw a rectangular area with keeping the left hand mouse cursor depressed and click on the small square in the right hand top corner. The area may be removed by clicking the right hand mouse button, select Edit UDB update file and next delete line. Note that a UDB (see below) should be active to use this option. Also note that if one clicks in the box but outside the small square as mentioned above, the area will be displayed filling the whole screen i.e. the scale will increase. Search area User database : This function has been developed in order to enable the user to put superimpose his own information over the displayed chart. It is a most useful feature for many purposes. Lines, polygons, circles, symbols, lines of symbols, colour fill, text can be added to a UDB (whether a new or existing one). All this information can later be edited or deleted. The information can be filed for later use and or modification. The operation of UDB s may at first look complicated to the novice user of the system but after a very short while the logic and systematic approach will become clear. First the user has to initiate the UDB section by clicking on User DB s. It is then possible to view which files are already activated or to put in a new name for a UDB file under open file for update. Another option is to just view a UDB file (this option does not offer the possibility to edit the file. When the file has been opened for update, the right hand mouse button can be used the call up the main UDB update menu. It is possible to direct access the active file, as long as it has not been closed, at any time by pressing the right hand mouse button and choose for Edit UDB update file Versie


50 See picture on next page. The main UDB menu will be displayed after selecting Edit UDB update file. Versie

51 The functions for adding, moving, changing and deleting of symbols and lines are divided into a group for adding or editing symbols and a group for adding or editing lines. Activating Add Symbol under the group Symbols will result in displaying the list as shown below from which a choice can be made. Each symbol can be allocated a colour, a text and it is also possible to separately file a long text connected to a symbol. This long text, which if it would be shown continuously, might clutter the display, can be typed in after clicking the Info button. At any moment this long text can be displayed next to the symbol, by putting the cursor in Info mode over the symbol. In all cases you can get the normal cursor back by clicking on done. It is also possible to change one of the nine symbols in another symbol from the UDB symbol table. Point your cursor at the symbol you would like to change and click with the right mouse button. The list gives you an overview of all available symbols There must be an active UDB under own files. In case you want another colour, click on colour and select a colour then press on done. Click on set mark symbols under UDB. Versie
52 After this you can drag one of the symbols from the upper right to any position or you can choose after selection of the symbol to drop it on a certain position via the right mouse button (e.g. via Go to Lat/Long position ) Apart from symbols the program provides the facility to add lines, lines of symbols, closed polygons or circles to UDB s. Closed polygons and circles may be colour filled. The picture on the next page shows a line being drawn as part of a UDB. The system will only accept and store an addition or amendment to a UDB file after Done has been clicked. Some double functions in this menu: Zoom in- Also possible with Page Down key or zoom in icon Zoom out- Also possible with Page Up key or zoom out icon Centre on cursor Also possible with home key or by double clicking with left mouse button Go to Lat/Long position - In case an UDB symbol or a line has to be dropped very accurately, and precise co-ordinates are known. Versie
 or created in case of a new track file.")

53 6 6. User files Track File To record the track of the vessel: This function offers the facility to record the tracks of the vessel for later analysis. Creating a Track file is a simple operation. A file in which the track information must be recorded should be opened (if the file already exists) or created in case of a new track file. Creation and opening of files to be used to record the track is analogue to the method as described for UDB s. Some specific functions to be used with track files can be found under the menu Track. Tracking control: To activate or de-activate the actual recording of the track on disk. It is also possible to handle this by using the T icon in the icon bar displayed above the chart. This symbol is shown when recording has been activated. If one clicks with the cursor (left hand mouse button) over this symbol it changes into: Versie


54 This indicates that the track is not being recorded. Position recording interval : By clicking on this button the below shown sub menu is displayed. This allows the operator to put in the interval for recording the ships position If the operator decides to Record all data points it will result in a position being recorded every second. To save bytes on the hard disk an interval can be selected by ticking on the small interval circle and moving the pointer to the desired number of minutes. If it is important to record every movement of the vessel, Record all data points must be selected. Otherwise while replaying the track it may show cut off turns. Depth recording interval : The handling of this sub menu is similar to the one described for the recording of positions. It enables the operator to decide on the interval of depth recording. To use this function an echo sounder with a NMEA0183 output must be interfaced and activated under Properties and Tools Select Track line colour : Select one of the colours available. During tracking the colour of the track may be changed. Versie

55 Automatic colour select on or off A switch which if set to on automatically changes the colour of the track after an interrupt in recording. The colours are selected automatically by the system. 3-D On To write own echo sounder depths in 3-D data base to enhance 3-D display. See also section 4. Other Track functions: Edit update file Clicking this line activates following sub menu. This menu is also available under the right hand mouse button. Done : To be used to execute one of the edit functions of this submenu as chosen by the operator or to immediately return to the full chart display. Delete by track : A track may consist of more than one separate track segments. This function allows the operator to delete one segment (line). Delete by colour : To delete track segments (lines) with the same colour. Click on this line and then move the cursor (now with a square box shape) to a line with the colour that must be deleted. Click and all lines with a similar colour will now be deleted. Versie
56 Delete point to point : To delete a segment (line) between two points. Click on this line and bring the square (cursor) box over a point on the line from where the operator wants the track to be deleted. Click and then move the square box to a second position on the line. Click angina and the line between the two points will be deleted. Colour by track : This function may be used to change a colour of a recorded track if the operator decides on other colour to be more suitable for that particular track. First select a colour and then move the cursor to the track segment of which the colour needs to be changed.. Colour by colour : A track line may consist of more than one colour. Assume a track has been recorded in red and blue and the operator decides afterwards to change the colour into yellow and blue. Select yellow, move the cursor to the red part of the line and click. The red part will then change into yellow. Undo last action It may be clear that editing track files, particular deleting parts, may lead to unwillingly loosing valuable information. If one realises this before executing the action by clicking Done, this function allows the operator to rectify his applied corrections to the track file. Zoom in : Zoom out : Go to Lat/Long Position : Go to Range / Bearing Position : Go to Loran Position : Go to Decca Position : These functions are also included in the track edit menu. It allows the operator to use these functions without having to return to a previous menu. For an explanation how to handle these functions see section 4. Versie
 can be set by dropping Way Points in the chart This may be done very accurate by typing in geographical co-ordinates or by dropping the Way Point triangles in a")
57 7 7. User files Way Points (for example see section 12b) Way Points: Another powerful feature of your Quodfish system. The intended track (over the ground) can be set by dropping Way Points in the chart This may be done very accurate by typing in geographical co-ordinates or by dropping the Way Point triangles in a certain position with the cursor. An excellent tool for passage planning. If a Way Point file has been activated it can assist by establishing estimated time of arrival in Way Points (or the last Way Point) the distance to the next turning point, the offset to the track, etc. A Way Point in Quodfish systems is always a part of a Way Point File. A name can be added to the way point. A Way Point File must be given a name. The maximum number of Way Points per file depends on the type of Quodfish system you use. Active Files, Open files for update and Open files for view are repeatedly used functions for own user files. As these functions have been discussed earlier, this section will only cover the typical Way Point functions. Edit update file : To be used to edit, add, or delete Way Points in a file with a name that has been activated under Open files for update (The file may still be empty). Similar to Edit update way point file which may be found under the right hand mouse button. Reverse Way point line : A Way Point File, once established may be reversed resulting in an original route planned from A to B being handled as a new route running from B to A. Versie


58 Move to ship : Moves the first Way point to the current ships position. Quick route on/off : Enables the user, without any preparation to quickly set out a Way Point Route, starting at the vessels current position. Way Points can be established in the normal way by clicking the left hand mouse button with the cursor in the desired triangle position. Clicking on Done under the right hand mouse button will terminate the route. This route file will automatically be listed as Quick Route A Quick route from the vessel may also be generated by clicking with the right hand button on (preferably the most left) symbol spaces at the right hand top of the display. The following menu will be shown. By now selecting Quick Way Point a small triangle will appear as shown below. In future cases clicking on the small triangle will immediately start a quick route from the ships position. The menu as shown left will be available shown unde as soon as under the Way Point menu Edit update file has been chosen. It can also be activated by clicking the right hand mouse button. Done : Closes and executes the editing action. Add : To be used when dropping a first point in a new Way Point File but also to add a Way Point to the end of an existing Way Point Route.. Versie
59 Delete : Click on this line which will change the cursor into the square box. Position the box over the Way Point to be deleted and click with the left hand mouse button. The result of this action will be that the Way Points on either side of the deleted point will be connected. Insert : Inserts a new Way Point between two existing ones. The old leg remains visible until the new Way Point has been inserted. Move : Select this instruction, move the cursor to the Way Point to be moved, press the left hand mouse button and drag the Way Point to its new position. It is also possible to move the Way Point to a new position by typing in co-ordinates Select Colour : This enables the user to select a colour from the colour pallet and allocate it to a Way Point Route. The remaining functions of this sub-menu are general functions which have been described earlier in section 4 of this manual. Versie

60 8 8. ARPA ARPA : An ARPA radar may be interfaced to a Quodfish 610 system or Quodfish Navigator in order to display radar targets over the electronic chart display. Another enhancement to safe navigation and also a most practical tool to support maritime operations. The heading lines of the displayed targets provide an immediate overview of the nearby shipping. Targets may be recorded for later analysis. Depending on the type of ARPA, an overview is available to display other information like course and speed of the target, bearing and distance to the target, Closest Point of Approach (CPA), Time of Closest Approach (TCPA), Angle over bow (AOBow) and an Identifier of the target. The sub menu s to check which ARPA file is active, opening of files for update, editing and view are similar to the earlier described handling of UDB files and Way Point files. They can be found under the menu ARPA. Versie

61 Other sub menu s which may be activated under the ARPA menu are: Active ARPA targets Activating this sub menu will show the overview as described above. It is possible to record one or more ARPA target tracks by ticking the record box in the bottom bar of the ARPA target overview. After ticking the box, move the cursor to the line, which contains the ARPA target to be recorded and click. ARPA target tracks which are being recorded can be recognised by an asterisk (*) being attached to the target number. Ticking the box colour enables the user to give a specific colour to a target. Useful when steaming up with a colleague or if a vessel should be kept at the same bearing and or distance. Delete allows the operator to delete targets. Versie
62 9 9. AIS The menu shown below which will be displayed by clicking on AIS under the Layer Menu enables the operator to switch on or off several parts of the targets (e.g. Labels, vector, turn indicator or a complete categorie of targets. Black AIS targets switches between black targets and green as the official ARPA green colour is sometimes difficult to distinguish from the background. Versie


63 Example of AIS targets Clicking with the info cursor on a target will display the information shown below Versie


64 Virtual aids to navigation with a base station Sleeping targets. If AIS targets come outside a pre-set range they will get smaller. Versie


65 The menu Plot recorded AIS tracks under AIS Tracks as shown below enables the operator to switch on or off the display of all recorded tracks (it is possible tho display more than one track). Above an example of a plotted track of an AIS target where the vessel is shown In true (scaled) size. Versie


66 Log Book Logbook : The logbook may be used as a narrative of the voyage and to mark incidents and other important events worthwhile recording for future reference or analysis. This facility may be used as follows: Choose a file name by clicking Open file for update. Thereafter click on done button to call up log book layout as shown below. Versie
67 The name of the file is shown on top of the log book overview. Click on SET or START when lowering a net or the start of the voyage or a segment of the voyage. This will result in the time and the geographical position being fixed and displayed. The position will also be marked at the chart with a symbol. On completion of the voyage or a segment of the voyage or on completion of a particular haul, click HAUL or FINISH. Again time and position will be fixed and displayed and the position marked with a symbol on the displayed chart. To quickly centre the chart around the start position click on Go to Other available information from this menu: - Track file Name of the track file if tracking has been activated - Water depth (only if an echo sounder has been interfaced to the Quodfish and has been activated). - Water temperature (only when a sensor has been interfaced to the Quodfish computer) - Duration Total elapsed time between SET or START and HAUL or FINISH - Distance Distance between SET or START and HAUL or FINISH ) Free entry fields : - Log number - 7 column fields - Free text field for user information - Trip number - Week number More than one log registration may be filed under one single file. To browse use First, Previous, Next and Last. Log entries may be deleted by using Delete. The columns may be annotated by the user to fill in recurring information like wave height, wind direction etc. The words columns can be overwritten for this purpose. The actual observations may then be entered in the columns under the headings. For further processing, the information may be transferred into a spreadsheet program or similar. The information can be imported into this program as an ASCII delimited file. Filing onto the floppy disk or hard disk can be realised by clicking the appropriate buttons Drive A or Chart Log Directory (LDB) Versie
68 11 ARCS or Maptech raster charts: 11. Raster Charts Apart from using C-Map vector databases the system also supports raster charts either produced by the United Kingdom Hydrographic Office (ARCS) or the US company Maptech (BSB and PCX) Raster charts are copies of the paper charts. As such it is not possible to switch on or off layers as with vector charts. Also the scaling of the raster charts is limited (maximum zoom is twice the scale of the original paper chart. Information about coverage, prices etc. can be obtained from Chartworx through Raster charts are also protected against illegal use. In order to be able to use ARCS charts the user must be supplied with a pin code. In order to copy a particular ARCS chart from an ARCS master disk the user must also be provided with a so called permit number. When ARCS charts are delivered by an ARCS distributor, this distributor will use specially, by Chartworx developed software, to add the ARCS charts to the system. Maptech/BSB raster (encrypted-version 4) charts These charts are to be loaded into your system as follows: 1 Insert your Maptech Chart book Companion CD into your PC. 2 Choose Install Chart book Companion CD 3 Follow the on-screen instructions. When prompted for a Product ID number (only applicable for BSB version 4 charts), enter the one provided to you with the Chart book Companion CD. 4 Start up your Quodfish system, click on File followed by Install BSB Charts. Your Maptech charts can now be opened under File, Open Chart File. Maptech/BSB raster (un-encrypted) charts (Charts not delivered with a Product ID number) Insert Maptech CD into your system and go directly to step 4 above. Versie

69 This screen is displayed when opening the Open Chart File submenu under File. If no ARCS charts have been purchased the system will skip this message. The operator can now enter the pin number as provided by the ARCS supplier. A correct entered pin number will result in the selected chart being displayed. The entire chart ( overview mode) will be shown. Double clicking with the cursor moved to the desired area of the chart, will result in that particular part of the chart being shown in a one to one copy of the paper chart. In the example shown below a part of BA chart 107 is displayed in its original scale 1:75,000. Versie


70 The Pin Code may be entered by clicking with the mouse on the figures as shown in the above displayed menu or by keying in the numbers using the keyboard. Note that the presentation is identical to the paper chart. Versie


71 Information about Raster charts (ARCS) may be found under the submenu (under Files ) Chart info & NtM s BaZ. By highlighting chart 107 on the list with available ARCS charts the information as shown below will be displayed. The example shows a dated version of this chart. A new purchased chart will always be up to date to the latest published correction of that chart. Versie
72 Modules This section informs you about the extra modules which can be bought for your Chartworx system. - 3-D 12a - Proudman 12b Versie
73 12a 12a. 3-D Description of 3-D menu icons (for users who purchased an additional depth module) 1. Select camera view: It is possible to switch between 3 different camera s (by clicking on the icon), the first camera shows a view from the horizontal plane, the next one a view from an angle of 45 degrees and the last directly from above the bottom (2-D). 2. Decrease difference in height: Can be used to reduce differences in height of bottom topography (makes it more flat) 3. Increase difference in height: can be used to increase differences in height of bottom topography (makes it more undulating) 4. Chart Transparent: Can be used to change the transparency of the C-Map chart overlay 5. Colour pallet: Can be used to activate the use of the colour selected via the menu under button Select colour: Can be used to select bottom topography colours, per decimetre or meter over a range of several meters, or with smoothly changing colours over a range of 10 meters. 7. Chart: Can be used to wrap the chart over the 3-D model. 8. Delete depth: Can be used to delete own observed echo sounder depths that do not match with surrounding depths and spikes. 9. Overlaying chart selection Can be used to switch on or off the (transparent) overlaying chart. 10. Depth values and contour lines: Makes it possible to switch on or off all depth values and contour lines for the viewed area. 11. Menu Transparent: Makes the 3-D menu transparent for night time viewing 12. Follow Ship Mode 3D model: Switches between follow ship mode (on/off) Versie

74 Ways to improve the 3D view (only for users with an additional 3-D depth module). It is possible to improve the 3-D image by adding own depth information obtained by the echo sounder. Special attention must be paid to avoid any gross errors like not correcting for the draught of the vessel, observations under adverse weather condition etc. Quodfish systems offer the option to automatically add the depths to the 3-D database by using the option under Tracking, 3-D On. The sampled depths are automatically corrected for predicted vertical tidal movement Versie

75 12b 12b. Proudman tidal module The Proudman Tidal Module has been developed by the well-known Proudman Oceanographic Laboratory based in the United Kingdom. The module shows the direction and rate of horizontal tidal movement for every 12 kilometres on the Continental Shelf and 30 kilometres outside the Continental Shelf. The predictions are based on about 40 years of observations. The Proudman tidal databases can only be used with the Proudman modules of Chartworx Electronic Chart Systems. Updates are not necessary. The data can be used for an unlimited period of time. The attention is drawn to the fact that the constituents used for the predictions are astronomical constituents so no corrections for meteorological influences or shallow water effects have been applied. Proudman tidal databases are an option and have to be ordered separately. They are only available for European waters. Versie
76 When installed they can be activated by clicking on the icon of the icon bar. See also section 4. It is also possible to show the tidal stream for another day and / or another time using the facility offered under Tools. Versie
77 Miscellaneous Subjects This section provides some background information about the source material used for the C-MAP data bases, some practical hints for passage planning, the use of short cut keys, application of chart corrections by the user and the facility to apply automatic scale adjustment. - Chart sources 13a - Make a normal route 13b - Use of short cut keys. 13c - Automatic scaling. 13d Versie
78 13a 13a. Sources of digital charts Chartworx electronic chart systems use C-Map by Jeppesen digital charts. C-Map uses official paper charts or digital information provided by Governmental Hydrographic Offices. Paper charts are digitised and converted to C-Map s unique digital data format. This also happens with the digital information received from the Hydrographic Offices. The official data is supplemented with value added data like detailed information of Ports and Marinas based on C-Marina database, roads and Points of Interest (POI s), land elevation models, 2 and 3-D satellite / Aerial overlay. The digitised data is compiled into a seamless database. The whole process is subject to quality control procedures as laid down in QC procedures for official Electronic Navigational Charts (ENC) C-Map by Jeppesen offers worldwide coverage. The quality of the database is depending on the quality of the information as provided by the Hydrographic Offices. Charts are subject to frequent changes, depending on the area. Charts of the North Sea change almost on a daily basis particularly in shallow areas where frequent surveys (in some areas on a weekly basis!) result in regular change of navigation buoys. Also continuous offshore oil exploration activities do result in frequent chart changes. The quality of databases is therefore much dependent on the frequency of updating of the digital charts. Jeppesen keeps its digital chart constantly updated based on the corrections as published by the Hydrographic Offices Jeppesen produces the latest version of all available databases monthly. Subscribers to C- MAP by Jeppesen data receive a new CD every 4 months and have access to the unique Real Time Updating (RTU) service from Jeppesen which enables round the clock update facilities. Versie
79 13 b 13b. Making a Way Point File Dropping of Way Points: The example below shows a route from Den Helder in The Netherlands to the port of Peterhead in Scotland. The user has allocated the name DH-PH.WDB to the file. The file consists of a series of Way Points interconnected with lines. From the first point, just outside the harbour, we move our cursor in a north westerly direction to the entrance of the Molengat. Remember that the layers important for the safe navigation of your vessel should be on. Otherwise you may plan your route outside the buoys of fairways etc. Note that the number of Way Points per file may be limited depending on the version of Quodfish purchased. It is however possible to create an unlimited number of files. Also note that the screen shots used in this section are based on an earlier version of Quodfish but the description of the use of the functions is still applicable to your version of the program. Increase if necessary the scale of the area near the harbour entrance of Den Helder and open File for Update under the menu Way Points and enter the name. Press Done and select via the right hand mouse button Add. Drop the first Way Point by clicking with the left hand mouse button. Versie
 you may not see all the detail that is available in your database.")
80 From the first point, just outside the harbour, we move our cursor in a north westerly direction to the entrance of the Molengat. The scale used in this example is 1:25,000. Also remember that 1:50,000 is a scale breaking point and if you plan on a smaller scale (e.g. 1:60,000) you may not see all the detail that is available in your database. Versie


81 We follow the route in between the buoys and move the chart by pressing the Home key. Versie

82 The above display shows that we have reached the end of the Molengat passage. As we now can safely expect that no large scale data is available we change scale to 1:60,000 in order to cover a larger area on our display so that we can plan the next way point sufficiently clear of the fairway buoy. Now we have to aim for Peterhead. Therefore we need to cover a very large area on our display, so the scale is set to 1 : 3,000,000. We now drop a Way Point somewhere off Peterhead so that we get an idea of the general direction of our route. Note that almost all layers have been switched off. Otherwise we would have a much cluttered picture. Versie

83 On the above shown display it can be seen that the scale has been enlarged to 1 : 25,000. The initial Way Point has been moved closer to the actual position of the port of Peterhead. Versie

84 For the moment we neglect the fact that Peterhead harbour looks a bit cluttered with text (as we have all layers on). We notice that our Way Point is a considerable distance off the leading lights line into the port. We leave the point where it is for the moment and drop another point closer to the harbour and on the line of the leading lights. Notice that this was achieved by clicking the right hand mouse button, select Edit Update Way Point File with the left hand mouse button and there after again clicking on the right hand mouse button and selecting Add. Although the nearest Way Point to the South West was not visible on the display the line automatically connects the new way point on the leading lights to the previous one. Done is clicked to terminate this operation. There after the next point is dropped in the harbour entrance (scale 1 : 10,000). The planning of the route is terminated by clicking Done with the right hand mouse button. The route has still to be optimised by moving the Way Point which was established using a small scale and appeared to be too far off the leading lights. Versie


85 Activate Edit Update File under the Way Point menu or click on Edit Update Way Point File under the right hand mouse button. Versie
86 Choose the option (under the right hand mouse button) Move Versie
 mouse click.")
87 Move the cursor to the way point to be moved and bring it in the correct position. During the dragging of the way point the previous connection lines will stay in place until the new position is confirmed with a (left hand) mouse click. To view the co-ordinates of the route file click on Active files under Way Points and thereafter Info. Also are shown the bearing and cumulative distances along the route. The total distance between Den Helder and Peterhead is 355 NM. It is advised to check the route again on a practical scale to check that the route does not cross any obstacles or other features dangerous to navigation. As can be seen the above described route crosses the Placid Field platform too close. It is therefore advisable to insert some more way points to guarantee a safe passage through the offshore exploration fields. The function Insert can be found under the same menu as Move Versie

88 Planned route The planned route (in red) appears to be too close to platform L10-C Versie


89 To insert a way point, press the right hand mouse button and click on edit waypoint update file. After this the above menu will be shown and now choose insert. Move the cursor (now in the shape of a triangle) to the line connecting the way points and drag the route to a position that it is clear of any dangerous objects and click with the left hand mouse button. Versie

90 The new (safe) route only differs by a couple of miles from the initial one. The length of the adjusted route comes now to 356 Nautical miles. Versie
91 12c 12c Short Cut Keys Vessel Marks Short Cut Keys : Short cut keys generate the same symbols as filled in by the operator by clicking with the right hand mouse to choose a particular symbol and displayed on the right hand top bar on the display. The can be activated by clicking with the cursor on the symbol or by pressing one of the number keys 1 to Example: Press the number 4 key and the flag symbol will be dropped in the present ships position (only if a User Data Base (UDB) file is open for editing. Other Short Cut Keys. *(asterisk) F1 F9 F10 F12 Home End Page Up Page Up Esc Man overboard marks in ships position (Num. Pad, not Shift 8!). See also page 47 Quodfish help function Saves a screen dump as bmp in the map screens Saves a screen dump as bmp in the map screens and prints Instant Fix Chart being centred on cursor position. Chart being centred on ships position. Arrow keys move chart in chosen direction. Decrease the scale, shown area increases. Increase the scale, shown area decreases. Cancels present operation when updating a User Data Base. Alt-Letter Pressing Alt together with a key corresponding with an underlined letter of one of the menus in the menu bar, gives same result as clicking on the Menu. Versie
92 13 d Automatic Scale Change: 13d Automatic Scale Change This section describes a method to change scale automatically when passing a predetermined co-ordinate. This function proves particularly handy when approaching a harbour at high speed where the operator is too occupied to change scale manually. It is required to make an ASCII file with the limits of the area and the scale to be used in that area. When one of the limits of this area is being passed and the automatic scale function is switched on the system will automatically switch to that scale. In the example below automatic scale change is shown approaching the port of Den Helder (The Netherlands). The user should have some knowledge about making an ASCII file. Assuming we intend to approach Den Helder through the Schulpengat entrance we note some co-ordinates where we want to automatically change scale. Coming from sea we use a scale of 1 : 75,000. From the fairway buoy to a point in-between the lighthouse and the ferry port of Den Helder we want to use a scale of 1 : 30,000 For the last leg into the actual harbour we will use 1 : 10,000. For each scale area we note the co-ordinates of the lower left corner and the upper right corner of the area The sequence is on each line the scale, the latitude and the longitude, all separated by commas. Supplementary comments can be typed into the file but must be preceded by #. De filename must always be NAVSCALE.BOX. De file NAVSCALE.BOX should be placed in the chart directory. (often C:\TM \CHART) For the above described example the file NAVSCALE.BOX should look as follows: # Lines starting with # are ignored, # Format of each line is "<scale>,<lower left corner>,<upper right corner>", # where each corner is of the format "lat,long" # Thus, each valid line must have exactly 4 commas in it # In case of overlapping areas, the first box found around ship will be used 10000,N ,E4 45.5,N ,E ,N52 53,E4 37,N ,E ,N52 49,E4 34,n53,e5 Versie

93 To activate the box Auto scale should be ticked in the scale menu. Versie
! Is your Windows system up to date?")
94 ANNEX A Installation Chartworx software and digital (MAX Pro) charts. For installation of C-MAP by Jeppesen Professional+ data see page 96 Make sure to load the CD with the software first and thereafter the chart(s)! Is your Windows system up to date? Before you start installing the Chartworx software and the digital chart data, please make sure that your version of Windows has been updated with the most recent updates provided by Microsoft. The same applies for the software drivers of the Mother board, BIOS, CD / DVD driver s video board and PCI / USB COM ports. To update your Windows system: Go to Start, click on Help and Support and select under Select a task, download Windows Updates. 1. Insert the CD with the Chartworx program in the CD / DVD reader. 2. The installation will start automatically. Click on: 3. After installation of the program you will see the following message Please press start to install the C-MAP charts Versie

95 Versie

96 ANNEX B Installation of the database (FOR CM93/3 PROFESSIONAL (+) ONLY!) Do not attach the e-token until the program asks for it! First install your Chartworx Quodfish program as described above. If you already have a Quodfish program with data please install the new DVD / CD in the same directory as your previously installed database. NB: Some parts of the program may take longer to load than others. As long as you do not get an error (very improbable), you do not need to do anything. After successfully loading an Icon will be installed on your desktop. Double click on the icon. Insert the C-MAP CD with the digital charts in your CD drive. Go to File and open the C-MAP DB Manager. Versie

 map CM93/3 on the hard disk (standard c:\world\cm93/3).")
97 Choose in the right hand column the CD ROM drive and click on CM93/3 map. The C-MAP DB Manager offers you the possibility to copy the entire CD with C-MAP charts to the hard disk drive. It s strongly advised to do so, because it speeds up the operation of the system. The space required is about 650 MB. To do this first click on Copy database to HD. After this click on the (copied) map CM93/3 on the hard disk (standard c:\world\cm93/3). Click on register database Under Default a green appears. Close the window and open File and click on C-MAP DB License Versie

98 license window. This will open the Make sure that Add License manually is highlighted. Choose on the right column the wanted area for example Zone 1 / Area 13. Also if you ordered a Cell you first choose the zone and under Area the Cell number. Zone 0 is being used for the entire world. Add the license number (may be requested from Chartworx) in the middle column and click on Add License Versie
Quodfish Operators Manual
 Quodfish Operators Manual Copyright Chartworx B.V., 1993-2010 X:\5000 Chartworx B.V\Manual\Engels\Quodfish manual eng 10293.doc CONTENTS 1. Before you start sailing with Quodfish ---------------------------------------------------
GeoTide Predictor User Guide
 GeoTide Predictor GeoTide Predictor User Guide The software described in this document is provided under licence and may only be used in accordance with the terms of the agreement. Whilst every attempt
Boating Tip #45: Chartplotters
 Boating Tip #45: Chartplotters As navigation technology has advanced, hand held GPS receivers have further evolved into chartplotters. Chartplotters graphically display a vessel s position, heading and
Upgrading to v4.1. Passage Planner User Guide V4.1
 User guide V1.0 Upgrading to v4.1 Users of 3.4 or older versions of e- Navigator Planning Station or 1.3 or older versions of the e-np Reader will need to follow these instructions to begin using the v4.1
Operator's Guide FMD-3200/FMD-3200-BB/FMD-3300
 Electronic Chart Display and Information System (ECDIS) English Model Operator's Guide FMD-3200/FMD-3200-BB/FMD-3300 The purpose of this guide is to provide the basic operation for this equipment. For
IHO Report on the results of the ECDIS survey conducted by BIMCO and Denmark. 18 February 2014
 Introduction IHO Report on the results of the ECDIS survey conducted by BIMCO and Denmark 18 February 2014 1. In early 2013, BIMCO and Denmark conducted a survey to obtain information on the operational
Vulcan. Getting Started ENGLISH. bandg.com
 Vulcan Getting Started ENGLISH bandg.com Vulcan Getting Started 3 4 Vulcan Getting Started Contents 9 Introduction 9 The Home page 10 Application pages 11 Integration of 3 rd party devices 12 GoFree wireless
Simply point and choose
 Simply point and choose Examples of menu buttons: Center on Boat - The chart updates itself around the boat automatically. Quick Route - Quick and easy, make and activate a route from the boat s position.
PacTracs 2.0 Quick Start Guide
 PacTracs 2.0 Quick Start Guide If this Quick Start Guide or the Help menu does not provide the information needed, call the Marine Exchange s 24 hour Operations Center and our watchstander will provide
MULTI FUNCTION DISPLAY MFD8/MFD12
 MULTI FUNCTION DISPLAY MFD8/MFD12 User's Handbook The purpose of this guide is to provide the basic operation for this equipment. For more detailed information, see the Operator's manual. All brand and
SSN-VMS synergies pilot project. Tutorial on the web-based graphical interface for the FMC users (SSN GI)
") SSN-VMS synergies pilot project Tutorial on the web-based graphical interface for the FMC users (SSN GI) Lisbon, 30/03/2012 Contents 1. Log-in... 2 1.1. Introduction... 2 1.2. Authentication... 2 2. Basic
SSN-VMS synergies pilot project Tutorial on the web-based graphical interface for the FMC users (SSN GI) Lisbon, 30/03/2012 Contents 1. Log-in... 2 1.1. Introduction... 2 1.2. Authentication... 2 2. Basic
User Manual Version 1.0
 User Manual Version 1.0 INTRODUCTION... 2 SYSTEM REQUIREMENTS... 2 MINIMUM SPECIFICATIONS:... 2 RECOMMENDED SPECIFICATIONS:... 2 WINDOWS INSTALLATION... 2 FROM THE WEB... 2 FROM A CD... 2 EXECUTABLE...
Chart Plotter USER MANUAL
 Chart Plotter USER MANUAL 1. Disclaimer and warnings 5 2. Introduction 6 2.1 Keyboard 6 2.2 Connections scheme 7 3. Getting started 10 3.1 Switching ON 10 3.2 Switching OFF 10 3.3 First Setup page 10
Welcome To Autotrak Alert + Help Menu
 Welcome To Autotrak Alert + Help Menu Dear Valued Customer welcome to Alert+. In this document you will find an easy to follow break down of the Alert+ website and examples to help you along the way. Please
OPERATOR MANUAL. SIMRAD CS68 ECDIS Chart System
 OPERATOR MANUAL SIMRAD CS68 ECDIS Chart System 20221925E English About this document Rev Date Written by Checked by Approved by A B C D E 070205 First issue. Applies to software version 1.1.xx. 301105
Full Search Map Tab Overview
 FlexMLS Map Server Full Search Map Tab Overview The Full Search Map tab is a need to know module. It is accessible when you use Full Search under Search in the Main Menu tree of FlexMLS. This map can
Screen Designer. The Power of Ultimate Design. 43-TV GLO Issue 2 01/01 UK
 Screen Designer The Power of Ultimate Design 43-TV-25-13 GLO Issue 2 01/01 UK 43-TV-25-13 GLO Issue 2 01/01 UK Table of Contents Table of Contents Honeywell Screen Designer - The Power of Ultimate Design
Important information for AVCS users
 Important information for AVCS users Version issued 6 July 2017 This document provides important information for users of AVCS, including general cautions about the use of ENCs within ECDIS. This document
Ctrack Online User Guide
 Fleetstar Online A Guide to Winter Maintenance Reporting v1.1 Ctrack Online User Guide Title: Ctrack Online Quickstart Guide Date: 18/07/2013 Version: 1.0 Table of Contents 1. Ctrack Online Introduction...
Teledyne PDS. Trailing Suction Hopper. Version April Teledyne RESON B.V. Stuttgartstraat AS Rotterdam The Netherlands
 Trailing Suction Hopper Teledyne PDS Version 1.1.0 April 2017 Teledyne RESON B.V. Stuttgartstraat 42-44 3047 AS Rotterdam The Netherlands Tel.: +31 (0)10 245 15 00 www.teledyne-reson.com Teledyne RESON
Welcome To Autotrak Monitor +
 Welcome To Autotrak Monitor + Dear Valued Customer welcome to the Monitor+. Here you will find an easy to follow break down of the Monitor+ website and examples to help you along the way. Please do not
RESOLUTION MSC.191(79) (adopted on 6 December 2004) PERFORMANCE STANDARDS FOR THE PRESENTATION OF NAVIGATION-RELATED INFORMATION ON SHIPBORNE
 (adopted on 6 December 2004) PERFORMANCE STANDARDS FOR THE PRESENTATION OF NAVIGATION-RELATED INFORMATION ON SHIPBORNE") MSC 79/23/Add.2 RESOLUTION MSC.191(79) THE MARITIME SAFETY COMMITTEE, RECALLING Article 28(b) of the Convention on the International Maritime Organization concerning the functions of the Committee, RECALLING
MSC 79/23/Add.2 RESOLUTION MSC.191(79) THE MARITIME SAFETY COMMITTEE, RECALLING Article 28(b) of the Convention on the International Maritime Organization concerning the functions of the Committee, RECALLING
Reference For version 2.0
 Rose Point Navigation Systems COASTAL EXPLORER Reference For version 2.0 The information in this manual is subject to change without notice. Copyright 2008 Rose Point Navigation Systems. All rights reserved.
CS68 ECDIS Operator Manual ENGLISH
 CS68 ECDIS Operator Manual ENGLISH OPERATOR MANUAL SIMRAD CS68 ECDIS Chart System 988-10707-001 English About this document Copyright 2014 Navico Holding AS. All rights reserved. No part of this work covered
FMD-3200/FMD-3200-BB/FMD-3300
 Operator's Guide The purpose of this guide is to provide the basic operation for this equipment. For more detailed information, see the Operator's Manual. FMD-3200/FMD-3200-BB/FMD-3300 All brand and product
GN70/MX610/MX612 QuickStart Guide
 GN70/MX610/MX612 QuickStart Guide EN The front panel 1 2 3 PAGE MENU 8 10 POS NAV 9 HDG AIS 11 4 5 6 ESC MOB 7 ENT USB 12 13 USB No. Description 1 PAGE key: Brings up different screen page every time this
Manual SmartGraph for Humlog 10
 Manual SmartGraph for Humlog 10 State: 10.12.2001 Version: V1.0 1 1 INTRODUCTION TO SMARTGRAPH... 4 1.1 Manage, Configure... 4 1.2 The Programme Interface... 4 1.2.1 Graphs... 5 1.2.2 Table... 6 1.2.3
TZ Professional v3. The biggest TIMEZERO release ever!
 TZ Professional v3 The biggest TIMEZERO release ever! New PBG Module New PBG Module Resolution has been doubled (now 1.5m x 1.5m) Automatic and real time extrapolation (no delay when customizing brush
GO XSE. Getting Started. simrad-yachting.com ENGLISH
 GO XSE Getting Started ENGLISH simrad-yachting.com Contents 7 Introduction 7 The Home page 8 Application pages 10 Basic operation 10 System Controls dialog 10 Turning the system on and off 11 Selecting
4: Yamaha Page 4.1 Quarter Screen
 New Software v6.21 Including compatibility with BBWX4 SiriusXM Weather Receiver, FLIR Model M132/232 Cameras, FAR2xx7, FAR15x3 and FAR15x8 Radars, and Fusion Audio Models 755 and Apollo 1: Key Brand New
Computer Basics. Hardware. This class is designed to cover the following basics:
 Computer Basics This class is designed to cover the following basics: computer hardware software computer s operating system different kinds of storage devices you can use to save files using a mouse what
Feature Guide: TECDIS 4.7.x.30
 Feature Guide: TECDIS 4.7.x.30 With the release of TECDIS 4.7.x.30 we are providing you with over 40 new features and bug fixes. The most noticeable changes in this release are the design changes to make
Table of contents 1. INTRODUCTION INSTALLATION GENERAL INTRODUCTION NAVIGATE TO... 7
 Table of contents 1. INTRODUCTION... 1 2. INSTALLATION... 3 2.1. INSTALLING THE HARDWARE...3 2.2. INSTALLING THE SOFTWARE...3 2.3. ACTIVATING THE GPS...4 3 GENERAL INTRODUCTION... 5 3.1. LEFT-HAND BUTTONS...5
WorldTracker RF Real-Time Tracker
 WorldTracker RF Real-Time Tracker Long-Range Radio-Controlled Tracking Quick-Start User s Manual Security Concepts 110 Palm Ave Millbrae, California 650-692-8100 www.trackingtheworld.com WorldTracker RF
Hook2 Series. Operator Manual. 5 HDI, 5 TS, 7X GPS TS, 7 HDI, 7 TS, 9 TS, 9 HDI, and 12 TS ENGLISH
 Hook2 Series Operator Manual 5 HDI, 5 TS, 7X GPS TS, 7 HDI, 7 TS, 9 TS, 9 HDI, and 12 TS ENGLISH www.lowrance.com Preface Disclaimer As Navico is continuously improving this product, we retain the right
COPYRIGHTED MATERIAL. Making Excel More Efficient
 Making Excel More Efficient If you find yourself spending a major part of your day working with Excel, you can make those chores go faster and so make your overall work life more productive by making Excel
MEDALLION INSTRUMENTATION SYSTEMS MasterCraft Viper system
 MEDALLION INSTRUMENTATION SYSTEMS 2010 MasterCraft Viper system MEDALLION INSTRUMENTATION SYSTEMS VIPER CHART PLOTTING OPERATORS MANUAL MAP SCREEN This manual will attempt to familiarize the
Upgrading to v4.1. e-navigator User Guide V4.1
 User guide V1.0 Upgrading to v4.1 Users of 3.4 or older versions of e- Navigator Planning Station or 1.3 or older versions of the e-np Reader will need to follow these instructions to begin using the v4.1
Fo r. A Guide. October 21, 2009 Created by: Duane Miller, TCGSAR
 Fo r Searches A Guide October 21, 2009 Created by: Duane Miller, TCGSAR This material was made possible through funding from the SAR NEW INIATIVES FUND 2009 Table of Contents 1 Objectives... 3 2 Setup...
Operator Manual. MS1000 Software. Trencher Monitoring System
 Operator Manual MS1000 Software Trencher Monitoring System MS1000 Software Trencher Monitoring System Operator Manual Release 1.2 This manual provides you with the basic information required to operate
Full Search Map Tab. This map is the result of selecting the Map tab within Full Search.
 Full Search Map Tab This map is the result of selecting the Map tab within Full Search. This map can be used when defining your parameters starting from a Full Search. Once you have entered your desired
Your guide to switching to Voyager. Change management plan
 Your guide to switching to Voyager Change management plan Welcome to GNS GNS is the world s leading supplier of navigational information. We supply more than 20% of all British Admiralty products and services
SPRECON-E Display Editor
 SPRECON-E Display Editor Version 2.0b USERS MANUAL 94.2.912.60en 09/2004 ISSUE A page 2 / 61 Business Sector Enery Station Automation (ENA) [Power systems automation] Sprecher Automation GmbH Franckstrasse
A Step-by-step guide to creating a Professional PowerPoint Presentation
 Quick introduction to Microsoft PowerPoint A Step-by-step guide to creating a Professional PowerPoint Presentation Created by Cruse Control creative services Tel +44 (0) 1923 842 295 training@crusecontrol.com
Introducing the Revolution in New Zealand Paper Chart Production
 Introducing the Revolution in New Zealand Paper Chart Production Gareth HODKINSON, New Zealand Key words: Paper Charts, Electronic Navigational Charts (ENCs), S-57, Single Source Database, Cartography
GO XSE. Getting Started. ENGLISH
 GO XSE Getting Started ENGLISH www.simrad-yachting.com Contents 6 Introduction 6 The Home page 7 Application pages 9 Basic operation 9 System Controls dialog 9 Turning the system on and off 10 Selecting
DigiSoft GmbH & Co. KG Waldstrasse 7 * D Berg USER MANUAL
 DigiSoft GmbH & Co. KG Waldstrasse 7 * D - 76768 Berg USER MANUAL The professional Navigation system Version 4.0 Update: 20.07.2006 TABLE OF CONTENTS 1. GENERAL INFORMATION...1 1.1 Description of the
1 General Principles. General Principles. In this chapter 1-1
 1 General Principles In this chapter 1 General Principles 1.1 User Interface 1.2 Title bar 1.3 Menu bar 1.4 Standard Toolbar 1.5 The drawing area 1.6 Component tabs 1.7 Status Bar 1.8 Manipulating Components
HYDROGRAPHIC DICTIONARY
 INTERNATIONAL HYDROGRAPHIC ORGANIZATION HYDROGRAPHIC DICTIONARY Volume 1 English Special Publication No. 32 Appendix 1 Glossary of ECDIS Related Terms September 2007 Published by the International Hydrographic
Maris ECDIS900 System. Operator Manual ENGLISH.
 Maris ECDIS900 System Operator Manual ENGLISH http://www.navico-commercial.com/ Preface Disclaimer As Navico is continuously improving this product, we retain the right to make changes to the product
JAN-7201S/9201S ECDIS
 ECDIS RMS * The photograph includes options. - Provide a smooth operating environment ensured by high-speed chart drawing. Conforming to the latest IMO performance standards with Marine Equipment Directive
Lesson 1 Parametric Modeling Fundamentals
 1-1 Lesson 1 Parametric Modeling Fundamentals Create Simple Parametric Models. Understand the Basic Parametric Modeling Process. Create and Profile Rough Sketches. Understand the "Shape before size" approach.
NAVTOR NavTracker User Guide
 NAVTOR NavTracker User Guide This guide is based on NavTracker desktop version 7.4.0.0 NAVTOR AS Strandgaten 18 4370 Egersund, Norway +47 51 49 22 00 support@navtor.com TABLE OF CONTENTS System Requirements...
B. HDS-5m & HDS-7m. GPS Mapping Receiver. Operations Guide
 988-0176-02B HDS-5m & HDS-7m GPS Mapping Receiver Operations Guide Software updates for your unit. Occassionally check the Lowrance website for free software upgrades for your unit. Go to www.lowrance.com
Performance Measurement Accountability System
 USDA Forest Service State & Private Forestry COOPERATIVE FORESTRY Performance Measurement Accountability System Technical User Manual Revised October 2001 USING THIS MANUAL To fully understand the PMAS
Podium Plus Data Analysis Software. User Manual. SWIS10 Version
 SWIS10 Version Issue 1.10 February 2005 Contents 1 Introduction 6 1.1 What is Podium Plus? 6 1.2 About This Manual 6 1.3 Typographical Conventions 7 1.4 Getting Technical Support 7 2 Getting Started 8
TZTL12F/TZTL15F/TZT2BB Operator s Guide
 Operational Overview Home icon, power switch operations TZTL12F/TZTL15F Model MULTI FUNCTI DISPLAY TZTL12F/TZTL15F/TZT2BB Operator s Guide This guide provides the basic operating procedures for this equipment.
LinkMotion and CorelDraw 9, 10, 11, 12, X3, X4, X5, X6, X7 and X8:
 LinkMotion and CorelDraw 9, 10, 11, 12, X3, X4, X5, X6, X7 and X8: After you install LinkMotion software and set up all settings launch CorelDraw software. Important notes: Solustan s LinkMotion driver
SolidWorks 2½D Parts
 SolidWorks 2½D Parts IDeATe Laser Micro Part 1b Dave Touretzky and Susan Finger 1. Create a new part In this lab, you ll create a CAD model of the 2 ½ D key fob below to make on the laser cutter. Select
3. Map Overlay and Digitizing
 3. Map Overlay and Digitizing 3.1 Opening Map Files NavviewW/SprayView supports digital map files in ShapeFile format from ArcView, DXF format from AutoCAD, MRK format from AG-NAV, Bitmap and JPEG formats
QUICK START USER MANUAL
 QUICK START USER MANUAL 1 Quick Start User Manual Our powerful yet easy-to-use software simplifies and expedites your design and delivery of customized cabinets, doors, and closets. From concept through
OCEAN 7T. Technical presentation (ENGLISH) FURUNO ELECTRIC CO., LTD. All Rights Reserved.
 FURUNO ELECTRIC CO., LTD. All Rights Reserved.") OCEAN 7T Technical presentation (ENGLISH) Software technology Navigation software has been designed to make the most of Radio Ocean marine plotters. Works in Multi-Touch Screen Jeppesen charting technology
OCEAN 7T Technical presentation (ENGLISH) Software technology Navigation software has been designed to make the most of Radio Ocean marine plotters. Works in Multi-Touch Screen Jeppesen charting technology
DCN Synoptic Microphone Control. Software User Manual en LBB 3571
 DCN en LBB 3571 GENERAL CONTENTS Chapter 1-1.1 About 1.2 What is a synoptic layout? 1.3 Controlling microphones Chapter 2 - Getting Started 2.1 Starting 2.2 Using Help Chapter 3 - Preparing for a Conference
Tutorial 1 Engraved Brass Plate R
 Getting Started With Tutorial 1 Engraved Brass Plate R4-090123 Table of Contents What is V-Carving?... 2 What the software allows you to do... 3 What file formats can be used?... 3 Getting Help... 3 Overview
SolidWorks Intro Part 1b
 SolidWorks Intro Part 1b Dave Touretzky and Susan Finger 1. Create a new part We ll create a CAD model of the 2 ½ D key fob below to make on the laser cutter. Select File New Templates IPSpart If the SolidWorks
European Computer Driving Licence. Advanced Spreadsheet Software BCS ITQ Level 3. Syllabus Version 2.0
 ECDL Advanced European Computer Driving Licence Advanced Spreadsheet Software BCS ITQ Level 3 Using Microsoft Excel 2010 Syllabus Version 2.0 This training, which has been approved by BCS, The Chartered
Insight: Measurement Tool. User Guide
 OMERO Beta v2.2: Measurement Tool User Guide - 1 - October 2007 Insight: Measurement Tool User Guide Open Microscopy Environment: http://www.openmicroscopy.org OMERO Beta v2.2: Measurement Tool User Guide
Pagoda/Hypar 3. Manual
 Pagoda/Hypar 3 Manual Armstrong-White Automation (NZ) Ltd Armstrong-White Automation (NZ) Ltd 22 Kereru Grove, Greenhithe, North Shore City 0632 (Auckland), New Zealand. ph +64 9 413-7642 fax +64 9 413-7643
Insert Background Image For DriveTest Release 22 and above
 UPDATE Insert Background Image For DriveTest Release 22 and above Starting with Release 22 of DriveTest a new toolbar button has been added to the Plot Tab that allows the user to insert a background Image.
Anatomy of a Depth Survey Part II An Example Survey. Tom O Donnell, AP Miles River Squadron
 1 Anatomy of a Depth Survey Part II An Example Survey Tom O Donnell, AP Miles River Squadron 2 Example Survey Using tracklog technique with Garmin 178C GPS Sounder Select area to be surveyed using Maptech
Generating Vectors Overview
 Generating Vectors Overview Vectors are mathematically defined shapes consisting of a series of points (nodes), which are connected by lines, arcs or curves (spans) to form the overall shape. Vectors can
Computer Basics. Page 1 of 10. We optimize South Carolina's investment in library and information services.
 Computer Basics Page 1 of 10 We optimize South Carolina's investment in library and information services. Rev. Oct 2010 PCs & their parts What is a PC? PC stands for personal computer. A PC is meant to
EXCEL SPREADSHEET TUTORIAL
 EXCEL SPREADSHEET TUTORIAL Note to all 200 level physics students: You will be expected to properly format data tables and graphs in all lab reports, as described in this tutorial. Therefore, you are responsible
IT'S YOUR TIME. BlueChart g2 HD
 IT'S YOUR TIME BlueChart g2 HD Scanning the highlights of BlueChart g2 HD: Offering detailed marine cartography at a down-to-earth price, BlueChart g2 HD is ideal for handheld navigation devices (such
Press the Plus + key to zoom in. Press the Minus - key to zoom out. Scroll the mouse wheel away from you to zoom in; towards you to zoom out.
 Navigate Around the Map Interactive maps provide many choices for displaying information, searching for more details, and moving around the map. Most navigation uses the mouse, but at times you may also
GEBCO Digital Atlas Software Interface Users Guide
 GEBCO Digital Atlas Software Interface Users Guide Introduction Using the GDA Software Interface GDA Software Interface Menu Bar GDA Software Interface Toolbar Red text in this document indicates active
Tutorial 3: Constructive Editing (2D-CAD)
") (2D-CAD) The editing done up to now is not much different from the normal drawing board techniques. This section deals with commands to copy items we have already drawn, to move them and to make multiple
(2D-CAD) The editing done up to now is not much different from the normal drawing board techniques. This section deals with commands to copy items we have already drawn, to move them and to make multiple
Introduction to the workbook and spreadsheet
 Excel Tutorial To make the most of this tutorial I suggest you follow through it while sitting in front of a computer with Microsoft Excel running. This will allow you to try things out as you follow along.
Documentation Updates for Version 4.3.2
 Documentation Updates for Version 4.3.2 A-Track Version 4.3.2 is a minor update to Version 4.3 which was released in November 2013. The Reference Manual, User Guide, and Installation Notes have been amended
The Number Plane THE NUMBER PLANE PASSPORT.
 THE NUMBER PLANE PASSPORT www.mathletics.co.nz Fill in the mind-map below with what you already know about number planes. A start has been made for you! Uses a coordinate system developed by the French
Pre-release User Guide. Version 2.0 August 2015
 Pre-release User Guide Version 2.0 August 2015 Copyright 2015 EagleView Technologies. Copyright 2015 Pictometry International Corp. All rights reserved. No part of this publication may be reproduced, stored
Manual -HP EDITION- TomTom Navigator -HP Edition- User Guide
 Manual -HP EDITION- TomTom Navigator -HP Edition- User Guide Copyright 1996-2004 TomTom B.V., The Netherlands. TomTom is a trademark of TomTom BV. Data copyright 2004 Tele Atlas N.V., The Netherlands.
1. NJDEP Landscape 3.3 Viewer Interface
 Using the Landscape Project through NJDEP Landscape 3.3 Viewer Google Chrome or Mozilla Firefox are recommended for the use of this app. Navigate to the NJDEP-DFW s Landscape Project web page at www.njfishandwildlife.com/ensp/landscape/
QTrail, 6 Glamis Close Hemel Hempstead, Hertfordshire HP2 7QB Tel: 00 (44) Fax: 00 (44)
 Fax: 00 (44)") GPRS QTRAIL Vehicle Tracking System User Manual QTrail, 6 Glamis Close Hemel Hempstead, Hertfordshire HP2 7QB Tel: 00 (44) 1442 232434 Fax: 00 (44) 1442 232366 Email: enquiries@qtrail.com QTrail 2005 Every
GPRS QTRAIL Vehicle Tracking System User Manual QTrail, 6 Glamis Close Hemel Hempstead, Hertfordshire HP2 7QB Tel: 00 (44) 1442 232434 Fax: 00 (44) 1442 232366 Email: enquiries@qtrail.com QTrail 2005 Every
Overview: The Map Window
 Overview: The Map Window The Map Menu Map Window Tools and Controls Map Drawing Tools Clipboard Commands Undoing Edits Overview: The Map Window The MFworks Map window is a powerful facility for the visualization
ATNS. USING Google EARTH. Version 1
 ATNS USING Google EARTH Version 1 ATNS/HO/Using Google Earth Page 1 25/04/2013 CONTENTS 1. BASIC SETUP 2. NAVIGATING IN GOOGLE EARTH 3. ADDING OBJECTS TO GOOGLE EARTH 4. USER HELP REFERENCES ATNS/HO/Using
MANUAL NO. OPS647-UM-151 USER S MANUAL
 MANUAL NO. OPS647-UM-151 USER S MANUAL Software Usage Agreement Graphtec Corporation ( Graphtec ) hereby grants the purchaser and authorized User (the User ) the right to use the software (the Software
Market Insight Geo Mapping User Guide v1.0
 Market Insight Geo Mapping v1.0 D&B Market Insight Geo Mapping Manual Version: 1.0 Software Version: System: 2017 Q3 Training (UK) Contents Introduction... 1 Data Structure... 2 How to Login... 3 Map Options...
Explorer 3 w/o GPS antenna Multifunction chartplotter
 Explorer 3 w/o GPS antenna Multifunction chartplotter Multifunction chartplotter. The Explorer 3 is yet another improvement of the most reliable and affordable controller in the world. Product Description
Quick Start: GeoDAS-LT with Single Beam Echo Sounder
 Quick Start: GeoDAS-LT with Single Beam Echo Sounder I. Setting up GeoDAS-LT for Single Beam Echo Sounder Survey 1. Connect your single beam echo sounder, GPS receiver and other sensors (e.g. gyro and
MEDALLION INSTRUMENTATION SYSTEMS VIPER CHART PLOTTING OPERATORS MANUAL
 MEDALLION INSTRUMENTATION SYSTEMS VIPER CHART PLOTTING OPERATORS MANUAL TABLE OF CONTENTS Map Screen... 3 Squash Pad... 4 Navigation Menu Map View... 5 Orient View... 6 Select Course... 7 Creating a New
Dolphin PartMaster Wire EDM
 Dolphin PartMaster Wire EDM Copyright 2000-2017 Dolphin CADCAM Systems Ltd. This document is copyrighted and all rights are reserved. This document may not, in whole or in part, be copied or reproduced
Radar Image Processing and AIS Target Fusion
 http://www.transnav.eu the International Journal on Marine Navigation and Safety of Sea Transportation Volume 9 Number 3 September 2015 DOI: 10.12716/1001.09.03.18 Radar Image Processing and AIS Target
Õppeainete loend, maht ja ainekava
 Page Page 2 of 21 Õppeainete loend, maht ja ainekava Käesolev koolitus viiakse läbi STCW Konventsiooni Reegel I/14 paragrahv 1.5, ISM Koodeksi paragrahv 6.3 ja 6.5, ning STCW.7/Circ.18 (22 mai 2012) alusel.
HDS Gen2 RTM 2.0, 2.5 & 3.0 addendum
 HDS Gen2 RTM 2.0, 2.5 & 3.0 addendum This addendum documents new features included in the HDS Gen2 2.0, 2.5 and 3.0 software updates. These features are not described in the HDS Gen2 Operation manual.
Doc #: IDI06-11F Rev: 1.3 Issued: 22/02/18. Well Seeker PRO How To Guide Rev 1.3. Page 1 of 26
 Well Seeker PRO How To Guide Rev 1.3 Page 1 of 26 Contents 1.0 - Getting Started... 4 1.1 - Display... 4 2.0 - Creating a new Well... 5 2.1 - Unit Selection... 5 2.2 - New Instant Plan / Survey... 6 2.3
Lowrance, Simrad and B&G AT5 Contour Charts User Manual
 Lowrance, Simrad and B&G AT5 Contour Charts User Manual Contains detailed instructions on how to use your custom AT5 Charts with Lowrance, Simrad or B&G Chartploters Copyright 2006 CSSI 2017 CSS Inc. Page
Part II: Creating Visio Drawings
 128 Part II: Creating Visio Drawings Figure 5-3: Use any of five alignment styles where appropriate. Figure 5-4: Vertical alignment places your text at the top, bottom, or middle of a text block. You could
Vulcan. Operator Manual ENGLISH. bandg.com
 Vulcan Operator Manual ENGLISH bandg.com Preface Disclaimer As Navico is continuously improving this product, we retain the right to make changes to the product at any time which may not be reflected
PIVOT CMS CLIENT SOFTWARE USER MANUAL
 PIVOT CMS CLIENT SOFTWARE USER MANUAL 1 CMS USER GUIDE 1.1 PC REQUIREMENT Recommended PC Requirement OS CPU VGA RAM HDD Graphics Card OS CPU VGA RAM HDD Windows Vista, 7 or higher Intel Core2Quad Q9400