Multizoom Activity Recognition Using Machine Learning
|
|
|
- Virgil Price
- 5 years ago
- Views:
Transcription

.")
1 University of Central Florida Electronic Theses and Dissertations Doctoral Dissertation (Open Access) Multizoom Activity Recognition Using Machine Learning 2005 Raymond Smith University of Central Florida Find similar works at: University of Central Florida Libraries Part of the Computer Sciences Commons, and the Engineering Commons STARS Citation Smith, Raymond, "Multizoom Activity Recognition Using Machine Learning" (2005). Electronic Theses and Dissertations This Doctoral Dissertation (Open Access) is brought to you for free and open access by STARS. It has been accepted for inclusion in Electronic Theses and Dissertations by an authorized administrator of STARS. For more information, please contact
2 MULTIZOOM ACTIVITY RECOGNITION USING MACHINE LEARNING by PAUL SMITH B.S. University of Central Florida, 2000 M.Sc. University of Central Florida 2002 A dissertation submitted in partial fulfillment of the requirements for the degree of Doctor of Philosophy in the School of Electrical Engineering and Computer Science in the College of Engineering and Computer Science at the University of Central Florida Orlando, Florida Fall Term 2005 Major Professors: Mubarak Shah and Niels da Vitoria Lobo
3 c 2005 Paul Smith
4 ABSTRACT In this thesis we present a system for detection of events in video. First we propose a multiview approach to automatically detect, track, and consistently label heads, hands, and other objects across cameras (zooms). Next a number of features are developed which are used by the machine learning process for event detection. Finally, we demonstrate a new machine learning paradigm, TemporalBoost, that can recognize events in video. One aspect of any machine learning algorithm is in the feature set used. The approach taken here is to build a large set of activity features, though TemporalBoost itself can work with all feature spaces used by other boosting algorithms. We also show how multiple levels of zoom can cooperate and complement each other to help solve problems related to activity recognition. Tracking and Labeling Head and Hands: To perform activity recognition the system must be able to detect and recognize heads and hands in the scene. Our method relies on a standard face detector to find the head. A color model of the found head region is built online. We can find the hands using the color model, since they are similarly colored. There can be spurious regions marked as hand regions, so a multiview constraint is introduced to reduce false positives. We track these regions using mean shift. Detecting and tracking objects in time and consistently labeling these objects across zoom levels are two necessary tasks for such activity recognition. Thus, we iii
5 provide a novel method that is able to determine the consistent labeling of arbitrary tracks across multiple zoom levels. Features for Adaboost: We provide a rich set of features (weak classifiers) that are able to distinguish between various actions. The type of features we create fall into three categories: Multizoom features, temporal features, and frame-wise features. We go over all the features in more detail in the relevant chapters, and here we summarize a small subset of them. Three features that we present use multiple zooms simultaneously in cases in which a single zoom might not have been sufficient. The features developed are: 1) segmenting an object in the hand 2) determining number of hands in head region 3) localizing the hand in facial region. These features have in common the use of the epipolar geometry and use of multiple observations coming from different sources to improve results. Another temporal/framewise feature that we develop has the ability to segment the hand against complex or cluttered backgrounds. Solving the problem of segmenting the hand over cluttered backgrounds such as the face is essential for many problems in the domain of computer vision such as, Human Computer Interaction (HCI), surveillance, and virtual reality (i.e., augmented desks). The similar colors and texture of the hand and face make the problem particularly challenging. Our method is based on the underlying concept of an image force field. In this representation each individual image location consists of a vector value which is a nonlinear combination of the remaining pixels in the image. We introduce and develop a novel physicsbased feature that is able to measure regional structure in the image thus avoiding the problem of local pixel-based analysis, which breaks down under our conditions. The regional image structure iv
6 changes in the occluded region during occlusion, while elsewhere the regional structure remains relatively constant. We model the regional image structure at all image locations over time using a Mixture of Gaussians (MoG) to detect the occluded region in the image. We have tested the method on a number of sequences demonstrating the versatility of the proposed approach. Machine Learning for Activity Recognition: We also propose a new boosting paradigm to achieve detection of events in video. Previous boosting paradigms in vision focus on single frame detection and do not scale to video events. Thus new concepts need to be introduced to address questions such as determining if an event has occurred, localizing the event, handling the same action performed at different speeds, incorporating previous classifier responses into the current decision, using temporal consistency of data to aid detection and recognition. The proposed method has the capability to improve weak classifiers by allowing them to use previous history in evaluating the current frame. A learning mechanism built into the boosting paradigm is also given which allows event level decisions to be made. These two contributions make extensive use of temporal continuity of video at both the weak classifier and detector levels, respectively. This is contrasted with previous work in boosting which uses limited higher level temporal reasoning and essentially makes object detection decisions at the frame level. We also introduce a relevant set of activity features. Features are evaluated at multiple zoom levels to improve detection. We show results for a system that is able to recognize 11 actions. Our system is the first that we know of which uses a boosting methodology to perform activity recognition, achieving temporal invariance. v
7 To my wife, baby, and family for the support and encouragement they have given me. Dedicated on the Memorial of Saint Catherine Laboure. vi
8 ACKNOWLEDGMENTS I would like to first thank my advisors, Prof. Niels da Vitoria Lobo and Prof. Mubarak Shah. They were the ones to initially introduce me to the field of computer vision. Their excitement has been a motivation for me. They have given of their time generously to me during the course of my research here at UCF. It was largely through their efforts that I am here today presenting this dissertation. I would also like to thank Prof. Mark Heinrich and Prof. Michael Georgiopoulos for giving of their precious time to serve on my thesis committee. Their availability and insightful comments and questions are greatly appreciated. My PhD studies have been a great learning experience, and I have enjoyed the many interactions, both technical and nontechnical, with other members of the Computer Vision Lab at UCF. My wife has played a pivotal role in my dissertation. Her help and encouragement have been a constant source of motivation for me, and she deserves a large part of the credit in the completion of my dissertation. My parents and family have also been very supportive of me, and I would not be here today without their dedication in raising and caring for me from my conception. I would finally like to acknowledge my deep debt and thank the Holy Trinity, for the great friendships and environment of these past years of research, without whom nothing is possible. vii
9 TABLE OF CONTENTS LIST OF TABLES xii LIST OF FIGURES xv CHAPTER 1 INTRODUCTION Section 1.1 Overview of the Thesis Section 1.2 Detection, Tracking, and Consistent Labeling Across Cameras Section Previous Work Section 1.3 Development of Features for TemporalBoost Section Previous Work Section 1.4 Temporalboost Learning Section Previous Work CHAPTER 2 DETECTION, TRACKING, AND CONSISTENT LABELING ACROSS CAMERAS 18 Section 2.1 Definitions and Conventions viii
10 Section 2.2 Detection and Tracking of Heads and Hands Section 2.3 Establishing Consistent Set of Labels Across Cameras Section Spatial Constraints Section Trajectory Constraints Section Appearance Constraints Section 2.4 Quantitative Results Section 2.5 Conclusion CHAPTER 3 DEVELOPMENT OF FEATURES FOR TEMPORALBOOST Section 3.1 Combining Multiple Zooms for Improved Action Recognition Section Object Segmentation Section Determining Number of Hands In Head Region Section Localizing Hand on Face Section 3.2 Quantitative Results Section Other Directions for Integrating Multiple Levels of Zoom Section 3.3 Temporal Features Section 3.4 Potential Images Section Force Fields ix
11 Section Finding Potential Wells Section 3.5 Developing New Image Feature Section Combining Multiple Zooms to Refine Update Rules Section Extracting the Hand Section 3.6 Results Section 3.7 Application to Other Domains Section 3.8 Conclusions CHAPTER 4 TEMPORALBOOST LEARNING Section 4.1 TemporalBoost Learning Section 4.2 Guide to Building Features Section 4.3 EM Trajectory Fitting Section 4.4 Artifact Features Section 4.5 Motion Features Section 4.6 Single Frame Features Section 4.7 Visual Inspection of Feature Responses Section 4.8 Results & Discussion x
12 CHAPTER 5 CONCLUSIONS AND FUTURE DIRECTIONS LIST OF REFERENCES xi
13 LIST OF TABLES 2.1 Only Epipolar Minimization using Equation Only Epipolar Minimization using Equation Epipolar and Spatial Constraints Epipolar and Trajectory Constraints Epipolar and Appearance Constraints All Constraints Summary For All Algorithmic Setups Overall Algorithm This table shows the true positive and true negative segmentation rates for the specified sequences Subset of Hand to Face Actions. This table makes use of the terminology presented in Figure Actions recognized by system xii
14 4.2 TemporalBoost Learning Algorithm TemporalBoost Learning Algorithm TemporalBoost Learning Algorithm Description of all features and how to compute them. Col. 1 is the Feature ID. Col. 2 is the purpose of this feature. The purpose values are described in the first paragraph of Section 4.2. Col. 3 gives a short description of what the feature is computing. Col. 4 gives details on how to compute the feature.[x] is a 1/0 binary predicate Preliminary results showing the features selected in a cascade for the drinking event classifier. The feature name is shown in Column 1. The true positives and true negatives (on a frame by frame basis) are shown in Columns 2-3 respectively Detailed results showing the features selected in a cascade for the using phone event classifier. The feature name is shown in Column 1. The true positives and true negatives (on a frame by frame basis) are shown in Columns 2-3 respectively Detailed results showing the features selected in a cascade for the using phone event classifier. The feature name is shown in Column 1. The true positives and true negatives (on a frame by frame basis) are shown in Columns 2-3 respectively xiii
15 4.9 Detailed results for the testing sequences. Column 1 shows the specific event for which results are reported. Column 2 shows the best feature name. Column 3 shows numerically how well this feature did. Column 4 shows how well the best classifier did on the detection rates Results on training data. Col. 1 gives the action id. 2 gives the # actions and total # frames for each action. 3-4 give a head to head comparison between the best feature and the strong classifier. 5-6 (relevant only for TemporalBoost) give the true positive and false positive action detection rate. 7 gives TemporalBoost localization percentages Results on testing data. Col 1 gives the action name. 2 gives the # actions and total # frames for each action. 3-4 give a head to head comparison between the best feature and the strong classifier. 5-6 are relevant only for TemporalBoost and give the true positive, false positive action detection and rate. 7 gives localization percentages This table shows some of the features from the strong classifiers selected by the TemporalBoost algorithm during training. Action index is from Table xiv
16 LIST OF FIGURES 1.1 Example of scene showing zoom 1, zoom 2, and zoom 3 views Output from the head detector and color segmentation. Found head regions are marked by rectangular boxes, and color pixels belonging to the head color model are marked as white. The first row is frame 3 in zoom 1. The second row shows frame 162 in zoom 1. Though no explicit color model has been generated for the hands, they show up reliably even for multiple people. In row 1 both heads are found, but later in the sequence (row 2) the head detector misses one head, though the color segmentation still finds both head regions as skin regions xv
17 2.2 Unambiguous Hand Labeling. Three blobs are shown in (a). Blob t is the head and has already been identified in the first stage. It is shown (along with its epipolar line projections in both views for completeness). Blobs u and v are hand candidates. Blob v in (a) has its centroid projected to its epipolar line in (b). This line in (b) is searched for a matching, unambiguous hand candidate. It can be seen that there is a single hand candidate (blob y) on this epipolar line. This is an unambiguous match. Since the match is unambiguous, a mean shift tracker would be initialized around blob v in (a) and blob y in (b). This process starts the tracking for the matching hand candidates in both views. Similarly the hand candidate blob u in (a) has its centroid projected to its epipolar line in (b). This line is then searched and since a single hand candidate, blob x, is on this epipolar line, mean shift trackers would be initialized around each of these blobs in both views Ambiguous Hand Labeling. Three blobs are shown in (a). Blob t is the head and has already been identified in the first stage. Blob v in (a) has its centroid projected to its epipolar line in (b). This line is searched and it is found that there are two hand candidates, blobs y and z on this epipolar line, thus a mean shift tracker would not be initialized around any of these regions. This is so because there is an ambiguity as to which hand candidate in (b) corresponds to the hand candidate in (a) xvi
18 2.4 In (c) Labels A and B indicate the found two hand candidates. Each hand candidate has a box around it. Since no matching hand candidates have been found in (a), these hand candidates are not tracked in subsequent frames. For frame 31 in (d) two hand candidates, Labels C and D, are found. In (b) a single hand candidate Label E is also found. Labels C and E are not ambiguous (according to the detection method), so mean shift tracks are initialized around both of these corresponding regions. Since Label D in (d) has no corresponding hand candidate in (b) no mean shift tracker is initialized around Label D In frame 10 there are no hand candidates in either (a) or (c). In frame 101 in (d) the hand candidate labeled A is found. In (b) a hand candidate, Label B, is also found. These hand candidates are not ambiguous so mean shift tracks are initialized around both of these hand candidates in both zooms In (c) Labels A and B indicate the found hand candidates. Since no hand candidates that match have been found in zoom 1 (a), these hand candidates are not tracked in subsequent frames. For frame 364 in (d) Labels C and D indicate the found hand candidates. In (b) a single hand candidate, Label E, is also found. Since Labels D and E are unambiguous, mean shift tracks are initialized around both of these corresponding regions in (b) and (d). Since hand candidate Label C in (d) has no corresponding hand candidate in (b) no mean shift tracker is initialized around Label C in (d) xvii
19 2.7 In frame 10 there are no hand candidates in either (a) or (c). For frame 52 in (d) hand candidate, Label A, is found. In (b) Label B is also found. These hand candidates are not ambiguous so mean shift tracks are initialized around both of these hand candidates in both zooms In (c) the Label A is found as a hand candidate, though this hand candidate cannot be seen in (a). Since there is a partial overlap occurring with the head and other hand, this hand is not considered a hand candidate in either (a) or (c). Since no matching hand candidates have been found in (a), the hand candidates are not tracked in subsequent frames. Frame 226 occurs after the occlusion. In (d) hand candidates Labeled B and C are found. In (b) a single hand candidate, Label D, is also found. Since Labels B and D are unambiguous, mean shift tracks are initialized around both of these corresponding regions. Label C in (d) has no corresponding hand candidate in (b) so no mean shift tracker is initialized around it One type of spatial inconsistency. The head and hand bounding boxes intersect in both views. The first spatial constraint tests for intersecting bounding boxes. If the boxes intersect in one view, then intersecting boxes in other views are checked for consistency and penalized if necessary xviii
20 2.10 A second type of spatial inconsistency. In this case the bounding boxes of the skateboard and book do not intersect but the epipolar lines are almost coincident. This could result in incorrect labeling. The second spatial constraint penalizes label matches that overturn the order of the centroids Output of consistent labeling. Each row is a particular time unit in the sequence. For each row zoom 1, zoom 2, and zoom 3 are shown respectively. The previous object trajectories are superimposed on the current frame in the sequence. The matched trajectories across views are shown in similar colors. All objects were labeled across views correctly. Row 3 shows a frame after the head has moved. Notice that this generates a white line, similarly the white line appears in the other zooms indicating it is the same trajectory Output of consistent labeling. See Figure 2.11 for more information. The matched trajectories across views are shown in similar colors. It can be seen that all objects were labeled across views correctly. In Row 1 only the head has moved, and so no other trajectories can be seen. In Row 2 the hand is scratching the head (trajectory is marked in red across zooms). Row 3 shows the other hand approaching the head with a mobile phone Output of consistent labeling. This figures shows the same sequence as that shown in Figure The difference is that every 30 th frame is shown to get a better flow of the video sequence. The frames go from left to right and top to bottom xix
21 2.14 Other Camera Configurations that we tested the labeling algorithm on (Section 2.3). There were two cameras in this setup. One input image from each camera is shown HAFIS Space and Face Graph Flowchart for Section (top row) and (bottom row) Zoom 2 images are in column one and zoom 3 images are in column two. Row one is the input images. Row two is the I t,l,f images, and the third row is the color segmentation images. In zoom 2, a poor color model does not correctly segment all of the hand(column one, row three). Thus zoom 2 incorrectly concludes that an object is present in the hand. However, in zoom 3, the color segmentation is correct, it can override zoom 2 s decision In this case zoom 2 correctly detects an object, and zoom 3 confirms that an object is present in the hand. See Figure 3.3 for more explanation on the details of each row of images xx
22 3.5 This figure shows how an incorrect result in one zoom can be used to correct future bad segmentations. Column 1 shows the input image. Column 2 shows the segmentation using the incomplete color model. This figure is the same as Figure 3.3 (column one, row three). Column 3 shows the segmentation of the same image after the notification and update process. This update of the color model allows for much better segmentation of the hand. This is an interesting consequence of the multizoom cooperation among cameras Flowchart for Section Computing distance between the hand and head Probability of hand in head region Automatic results of determining the number of hands in head region Flowchart for Section Automatic results of hand localization Multizoom Segmentation. The first row shows the input images in zoom 2. The second row shows the input images in zoom 3. Rows three and four show the Ît,l,f images in zoom 2 and zoom 3 respectively. Though there is significant non-skin motion, the system is able to infer from the context of zoom 2 that the hand is not near the head Multizoom Segmentation. Continued on next page; xxi
23 3.14 Activity Feature Space and Face Map Potential Image for Various Input Frames. Input images are shown in column a: the left most column. Potential images are shown in column b. Notice that the potential image is quite smooth, due to the large convolutions. Column c shows the quantized potential images so that the equipotential curves can be more easily seen Force Vector Fields for various input frames. Input images are shown in column a. Column b contains the magnitude of the force field and column c contains the direction (quantized) of the force field These images show the test pixel locations after 50, 100, 150, 250 and 500 iterations (of Equation 3.10). The black lines are the paths that the test pixels take through the force field. The black circles indicate where the test pixels currently are located. As the number of iterations increases notice how fewer circles appear. This occurs because more of the test pixels reach the final well locations as the number of iterations increases Input frame demonstrating concepts of image representation. (a) is original image, (b) is the potential image, (c) is the potential image with well points overlaid, (d) is potential image with channels overlaid, (e), (f), and (g) correspond similarly to the force magnitude image. (h) is the direction of the force field, while (i) is the original image overlaid with the channels and wells xxii
24 3.19 Input frame demonstrating concepts of image representation. (a) is original image, (b) is the potential image, (c) is the potential image with well points overlaid, (d) is potential image with channels overlaid, (e), (f), and (g) correspond similarly to the force magnitude image. (h) is the direction of the force field, while (i) is the original image overlaid with the channels and wells This is a synthetic image used to give some intuition of the force field representation. (a) is the original image. (b) is the original image with the initial configuration of test pixels overlaid on it. (c)-(f) show the movement of the test pixels through the force field after 50, 100, 150, and 200 iterations. (g) shows the magnitude of the force field This is a synthetic image used to give some intuition of the force field representation. (a) is the original image. (b) is the original image with the initial configuration of test pixels overlaid on it. (c)-(f) show the movement of the test pixels through the force field after 50, 100, 150, and 200 iterations. (g) shows the magnitude of the force field This is a synthetic image used to give some intuition of the force field representation. (a) is the original image. (b) is the original image with the initial configuration of test pixels overlaid on it. (c)-(f) show the movement of the test pixels through the force field after 50, 100, 150, and 200 iterations. (g) shows the magnitude of the force field xxiii
25 3.23 This is a synthetic image used to give some intuition of the force field representation. (a) is the original image. (b) is the original image with the initial configuration of test pixels overlaid on it. (c)-(f) show the movement of the test pixels through the force field after 50, 100, 150, and 200 iterations. (g) shows the magnitude of the force field This is a synthetic image used to give some intuition of the force field representation. (a) is the original image. (b) is the original image with the initial configuration of test pixels overlaid on it. (c)-(f) show the movement of the test pixels through the force field after 50, 100, 150, and 200 iterations. (g) shows the magnitude of the force field Synthetic example demonstrating concepts of image representation. (a) is original image, (b) is the potential image, (c) is the potential image with well points overlaid, (d) is potential image with channels overlaid, (e), (f), and (g) correspond similarly to the force magnitude image. (h) is the direction of the force field, while (i) is the original image overlaid with the channels and wells. The different colors of the channel lines is for display purposes only xxiv
26 3.26 Synthetic example demonstrating concepts of image representation. (a) is original image, (b) is the potential image, (c) is the potential image with well points overlaid, (d) is potential image with channels overlaid, (e), (f), and (g) correspond similarly to the force magnitude image. (h) is the direction of the force field, while (i) is the original image overlaid with the channels and wells. The different colors of the channel lines is for display purposes only Synthetic example demonstrating concepts of image representation. (a) is original image, (b) is the potential image, (c) is the potential image with well points overlaid, (d) is potential image with channels overlaid, (e), (f), and (g) correspond similarly to the force magnitude image. (h) is the direction of the force field, while (i) is the original image overlaid with the channels and wells. The different colors of the channel lines is for display purposes only Synthetic example demonstrating concepts of image representation. (a) is original image, (b) is the potential image, (c) is the potential image with well points overlaid, (d) is potential image with channels overlaid, (e), (f), and (g) correspond similarly to the force magnitude image. (h) is the direction of the force field, while (i) is the original image overlaid with the channels and wells. The different colors of the channel lines is for display purposes only xxv
27 3.29 Synthetic example demonstrating concepts of image representation. (a) is original image, (b) is the potential image, (c) is the potential image with well points overlaid, (d) is potential image with channels overlaid, (e), (f), and (g) correspond similarly to the force magnitude image. (h) is the direction of the force field, while (i) is the original image overlaid with the channels and wells. The different colors of the channel lines is for display purposes only Channels before and during occlusion for images in the same input sequence as that shown in Figure Notice that a disturbance in the channels can be seen in the lower left corner of the image, whereas the rest of the channels in the the image are relatively stable Channels of test pixels for another image sequence. 250 iterations were used. Notice the large variation in the channels again in the lower left corner, where the hand enters The hand region is shown with the channel lines superimposed on it. These channel lines are the ones that varied most from the previous location s model. A convex hull algorithm could be used to fill in this hand region Hand Segmentation Results. This was a challenging sequence due to the large rotation of the face Results of hand segmentation algorithm xxvi
28 3.35 Example images used for the comparison between our proposed hand segmentation algorithm, background subtraction, and mean shift segmentation. These figures are some of the input frames from the output sequence shown in Figure Hand Segmentation Algorithm results for the input images in Figure The hand region is shown with the channel lines superimposed on it. These channel lines are the ones that varied most from the previous location s model. This case was particularly interesting because of the eyeglasses on the face Background subtraction results for the sequence in Figure The first row shows background subtraction of the whole image, and the second row shows background subtraction of only the extracted head region (found using [VJ01]). It would be very difficult to extract the hand from these foreground regions Mean shift segmentation results on the sequence in Figure Here over-segmentation occurs and region merging in order to correctly segment the hand would prove difficult Mean shift tracking results on the sequence in Figure Here the main difficulty is in manual initialization and after prolonged hand/face occlusion the tracker starts to drift Hand segmentation with channel lines superimposed Results of hand segmentation algorithm Results of hand segmentation algorithm xxvii
29 3.43 Hand Segmentation results on prolonged occlusion. Frames 55, 70, 120, 140, 250, and 340 are shown. The hand is leaving face in final frame Occlusion involving two hands. In this sequence the algorithm correctly finds the boundary for one of the hands. However because our algorithm looks for only the one well that changes most, it misses the second hand Occlusion involving two hands. In this sequence the algorithm correctly finds the boundary in the initial frames of the occlusion. Though there are some segmentation problems later in the sequence Results from our method for occlusion involving other types of similarly colored objects Results from background subtraction for occlusion involving other types of similarly colored objects Results from mean shift segmentation for occlusion involving other types of similarly colored objects Results from mean shift tracking for occlusion involving other types of similarly colored objects Visual Sample of Target Actions. They are shown in the same order as they are listed in Table 4.1. From left to right and top to bottom. The five figures in the lower row right corner show some non-action events xxviii
30 4.2 Overview of the entire machine learning and recognition process This figure presents a visual overview of the TemporalBoost learning paradigm for event class A This figure presents a visual overview of the TemporalBoost learning paradigm for event class B This figure presents a visual overview of the TemporalBoost learning paradigm for event class C Examples of the usual Haar features and variations Sequence showing user grabbing pen in zoom 1. Note that in zoom 3 there is no way to determine if the hand is reaching for an object Plot of the angle between the two line segments with parameters computed using the EM algorithm EM Trajectory Line Fitting. In this case the person picks something up with his hand before bringing it to the face. Notice the substantial angle between the two lines EM Trajectory Line Fitting. In this case the hand is brought to the face without picking up an object. In this case the angle between the lines is seen to be small xxix
31 4.11 Artifact feature. This figure shows two example frames with one particular method of background subtraction [EHD00]. Other methods are also used as explained in this section. The artifacts used in the computations are all connected components Motion Features. (a) The foreground pixels are assumed to be the moving pixels and they are counted on a frame by frame basis in various spatial regions. (b) The moving pixels are those above a certain threshold. This threshold could be learned by having different variation of the feature with different thresholds SSD based motion feature Affine based motion feature First row: Sequence showing person drinking from a mug. Second row: Mean shift segmentation performed on the above three frames. The idea of this feature is to count the number of segments in each given region. Here the region is the whole image Plot of the number of mean shift segments in the images of Figure The jump in mean shift segments occurs around frame 2897, when the object is near the face. 135 xxx
32 4.17 Geometric Statistical Features. (a) shows multiple features which measure the distance between the each hand and different parts of the face. (b) shows how to compute the spatial overlap between the hand and face. This is computed as the ratio of overlap area to the area of the smaller object. (c) shows the edge features. The number of edges is counted in various spatial regions, such as the head, full image, etc Global Features. (a) shows the mean shift segmentation. The number of segments is counted in various spatial regions. (b) shows the dark pixels in the image. The number of dark pixels is counted in every frame. (c) Skin color is learned online from the head detection. The skin color pixels are then counted in various spatial regions Number segments feature with arrows corresponding to the frames in video. This shows what the feature computation step consists in Example of images from the training sequence. The frames go from left to right and top to bottom. The whole sequence is over 3000 frames long Plot of the number of mean shift segments for the whole sequence shown in Figure Plot of the number of edges for the whole sequence shown in Figure Plot of the number of moving nonskin pixels for the whole sequence shown in Figure xxxi
33 4.24 Plot of the number of moving pixels for the whole sequence shown in Figure Plot of the number of skin colored pixels for the whole sequence shown in Figure Example output frames from testing sequences showing images labeled automatically by TemporalBoost. They go from left to right xxxii
34 CHAPTER 1 INTRODUCTION Activity recognition is an active research area in computer vision, and there has been an increasing amount of research done in this field in recent years [AC99] [Gav99] [SHe04]. The task of detecting and localizing events in video is a challenging problem. There are many different contexts where activity recognition would play a major role. Applications ranging from gesture recognition to Homeland Security to multimedia retrieval rely on a robust method to detect actions in video. Other applications being studied are those related to surveillance. Indeed a growing number of surveillance applications are utilizing forests of sensors for increased monitoring over large areas. These cameras generally have a low zoom to cover as much area as possible, yielding valuable tracking information and overall scene context. Other work in activity recognition has focused on facial expression analysis and gesture recognition using highly zoomed cameras of the face and hands. By sacrificing overall scene context the higher zooms gain valuable detailed, subtle cues about specific events in the scene. There is currently a gap between the surveillance class of applications, where the cameras generally have a low zoom and subjects are tracked simply as blobs, and the gesture analysis applications which analyze highly detailed images of faces, hands, and eyes. Several researchers have hinted at the possibility of com- 1
35 bining multiple cameras with different levels of zoom for improved activity recognition [Pen00] [GLS03]. Therefore, this thesis proposes an approach for activity recognition to capitalize on the complementary strengths in coarse views, mid level views, and fine views. In many problem domains there are certain regions in the scene where detailed (highly zoomed) monitoring is needed. In other areas only a coarser view of the scene is needed. Consider an office environment where someone is working at a desk. Many actions one would perform in this environment involve the head, such as talking, using the phone, looking at something, eating, coughing, putting on eye glasses, etc. A coarse view of the scene can give information about the origin and destination of hand-held objects and about such matters as how fast the hands are approaching the face. A finer view around the facial region would be able to provide more detailed information such as where on the face the action occurred, where the person is looking, whether the person is talking or not, what kind of object is being brought to the face and so on. In this context it would be helpful to have multiple cameras employing varying degrees of zoom to accomplish activity analysis. We focus our attention on the problem of action recognition in an office environment as this gives us a rich set of actions to recognize. Section 1.1 Overview of the Thesis The thesis is presented in the following form. The introduction and related work is discussed in the remaining part of Chapter 1. Chapter 2 presents a method of detecting, tracking, and consistently labeling the heads and hands after introducing preliminary mathematical notation. Chapter 3 dis- 2


36 Figure 1.1: Example of scene showing zoom 1, zoom 2, and zoom 3 views. cusses a subset of features designed for TemporalBoost. Chapter 4 gives the details of the current training methodology along with details on more features used in the machine learning process. Conclusions and directions for future research are presented in Chapter 5. We now give a brief introduction and background work into the main problems that were solved in our work. Section 1.2 Detection, Tracking, and Consistent Labeling Across Cameras In Chapter 2 we lay the necessary foundation for multizoom activity recognition in the context of an office environment. To achieve this goal the following problems need to be solved. 1: The head and hands need to be automatically detected and tracked in each view. 2: Objects need to be consistently labeled across views. 3: The cameras need to cooperate to perform activity recognition. We have experimented with a camera configuration in which there is a hierarchy of N 3 zooms which give various degrees of detail in the scene, as shown in Figure 1.1. The nonplanarity of the environment requires the above problems to be solved using the epipolar geometry. We assume that the epipolar geometry of the scene is known, but it could be learned as in [WFZ03]. We first present a method which is able to automatically find people s head and hands in video sequences. Our approach utilizes dynamic color models and multi camera cooperation to achieve 3
37 better recognition than was possible with independent cameras. Then a method for consistently labeling objects across multiple cameras (each camera having a different zoom) is presented. Innovations of our algorithm include incorporating not only epipolar, spatial, and appearance information, but also integrating trajectory matching. Finally, we show results on a number of sequences to demonstrate the versatility of the proposed approach. Section Previous Work A key element of any multi camera activity analysis system is the consistent labeling of objects across cameras. An obvious option would be to compute the full 3D alignment using stereo. Basic stereo methods will fail because the assumption of the standard stereo setup is violated [SK01]. Even after applying polar rectification [PKG99] to our image pairs and then attempting the methods in [KZ01] and [BVZ98], these direct methods fail because polar rectification cannot resolve the ambiguities in occlusion and illumination changes across the cameras. In [Ste98a], a feature based method is used, in which the feature point matches are picked randomly. Then a homography is estimated and an error function is minimized which allows the best guesses to help contribute to a better estimate in the next round. In our case however, we do not have a ground plane to work with, which they require, and we have a full 3D scene. As noted in [AT01] the approach is also sensitive to noise and match ambiguities. Work presented in [CSI02] attempts to find the fundamental matrix and establish trajectory correspondences in 3D scenes. However, their method does not take full advantage of appearance, trajectory, and spatial 4
38 properties, which we have found adds more robustness to finding the consistent labeling across cameras. In [RYS02], the rank constraint is used to find linearly dependent trajectories. In this way similar trajectories can be grouped together for classification. While they achieve good results, if multiple trajectories in multiple views move similarly then there is ambiguity between which trajectories are most similar. Further, the method could not be extended to our trajectory matching because it cannot handle matching degenerate trajectories, like stationary objects. A method is presented in [CG01] to track across wide field of views. They use epipolar, homography, landmark, apparent height, and apparent color to resolve ambiguities. However the system assumes common illumination across the cameras. We use a better appearance comparison using energy minimization. They neglect to use trajectories themselves, which also provide us a valuable cue to alignment. Further, their approach would have problems without ground plane calibration. Work done by [KHM00] show how depth and color information are combined to track multiple people in a scene using a pair of stereo rigs. Appearance and spatial information are both used to acquire matching trajectories across views. In [DDC01] range data is acquired from stereo pairs to match trajectories across views. Pixel data from multiple views is integrated in a late-segmentation strategy. Each pixel is checked against all trajectories estimated over time. In [MD03], correspondences are acquired using segmentation and epipolar geometry with information combined from multiple cameras. Their method relies on ground plane calibration and 5
39 will not work as we have no ground plane. Multiple views with widely different zooms are not considered. While there has been much work done in multicamera surveillance integrating multiple zooms simultaneously has not been well studied. Our work provides an algorithm for making high level inferences about activities using multiple zooms. Further, because no consistent labeling (i.e., correspondence) algorithms were successful in our test cases a new method needed to be developed. Section 1.3 Development of Features for TemporalBoost One of the main tasks when using a boosting methodology is the development of a meaningful set of features (weak classifiers). Until now it has been unclear what types of features should be used for activity recognition in a boosting framework. It is hoped that our development of activity features will serve as a basis for others. The features we present have widely different levels of complexity. The type of features we create fall into three categories: Multizoom features, temporal features, and frame-wise features. In Chapter 3 we explore some of these features. In Chapter 4 we give details on the remaining features. The reason we split the features into two chapters is that features in Chapter 3 are computationally involved and are significant contributions in their own right. The features in Chapter 4 are simpler though nonetheless useful. The idea behind the multizoom features is that certain events require multiple levels of scene detail. We might wish to track someone coming into an airport, maintain his identity to the ticket counter, and to the destination 6
40 airport. To do so requires multiple levels of zoom that must cooperate to achieve the needed recognition. We outline types of features that can be used in a multizoom setup and show that these features can help in cases where using only a single level of zoom would be prone to error. It is also shown how the individual zoom levels can be combined to create a basic activity recognition system. The final feature we develop in Chapter 3 resolves occlusion of the hand over complex backgrounds such as the face. The difficulty lies in the fact that the hand and head are similarly colored/textured regions. A necessary step for many HCI applications such as gesture recognition, pointing interfaces, hand pose recognition, and event detection is a reliable hand segmentation. Sign language recognition methods also need to first segment the hand over complex boundaries, such as the face. Some events like coughing, eating, and taking medication could be more easily recognized by segmenting the hand from the face. In short there are many applications that could benefit from having a robust segmentation of the hand over complex backgrounds. In light of these considerations, we develop a new feature based on the force field image [HNC02]. The force field image is a physics based image representation. Each image location is represented by a vector value which is a nonlinear combination of all other pixels in the image. The approach in [HNC02] focused on a possible feature space for recognition of faces and uses single frames. The feature we develop is the distance traveled by test pixels placed in the force field. Our novel feature is able to model regional structural changes in the image over time. Local methods (pixel based) cannot resolve the occlusion because there is little change in local color when similarly colored objects occlude each other. Regional structure in the image does change when 7
41 the hand occludes the face, although local pixel colors in the occluding region remain largely the same before and during the occlusion. By quantifying the regional structural change in an image over time we can resolve this kind of occlusion. We also present a method that is able to model our newly developed feature response over time and capture where and when occlusion is happening using a Mixture of Gaussians (MoG) modeling paradigm. We also clarify several concepts from [HNC02] and give more details regarding the use of this image representation. An extension of the force field computation to video data is also given. Section Previous Work We first cover previous work in features related to multiple camera activity recognition systems. Then we present previous work done in the area of resolving occlusion involving the hand and face. Activity recognition is an important problem in computer vision, and there has been an increasing amount of research done in this field in recent years [AC99] [Gav99]. The problem of integrating multiple levels of detail (MLOD) to improve activity recognition is not as well studied. Chapter 2 provides a formulation for studying MLOD in the context of activity analysis. In [NBV03] multiple cameras are used to cover non overlapping regions to recognize activities. They introduce the Abstract Hidden Markov memory Model to analyze activities, which allows them to utilize the inherent hierarchical structure of activities. Their approach is used to cover large spatial environments, however they do not attempt to use multiple levels of detail to perform finer 8
42 action recognition. In [CLF01] a large scene is monitored and people and vehicles are tracked automatically. Three dimensional world coordinates are determined for all objects. Though the system does not make any inferences as to what kinds of activities are occurring. All information is passed to an operator for evaluation. An active vision system is presented in [STE98b] using one static and one Pan-Tilt-Zoom (PTZ) camera to identify and track multiple people. This approach makes a number of restrictive assumptions on the color of people s clothes and number of people present. No activity analysis capabilities are demonstrated. By combining multiple cameras in an active vision system with stereo vision, [HOY00] is able to perform head and hand tracking and limited gesture recognition. Their correspondence only considers horizontal epipole line information and object size. A multiple camera approach is given in [MHT00] to detect events for an intelligent meeting room, however they do not use the high zoomed cameras for activity analysis. In both these systems the camera positions are known beforehand. We have tried to avoid active vision systems (i.e., PTZ and foveating cameras) in our approach to focus on integrating multiple zooms levels simultaneously. Much of the work in finding the hand in a complex background relies on colored markers [DS94] on the hands or requires the hand to be the only skin object in view [CW95]. Contour based approaches [ATL97] [HSS04] [JKS02] and other edge based methods [STT04] rely on good edges separating the hand and head, which are often not present in such difficult occlusion. There are edges in the occluded region but they are usually weak. Our approach seeks to take a regional approach and not get confused by local edge inconsistencies. Active contour approaches 9
43 [ATL97] [JKS02] require the hand shape change to be small. Our method has no such constraint. In [HSS04], hand shape is estimated over a complex background by using a shape transition network with the attributes of contour, position, and velocity. They use a simple template based approach and skin color segmentation to find the hand during hand face occlusion. Their approach is sensitive to small changes in lighting, different skin colors, and requires small differences in the 2D hand shapes. Other color based approaches [BML04] [SG00a] [STT04] would have similar difficulties with lighting, etc. in segmenting the hand over face. Our method makes no use of skin color. In [SG00a] body parts are tracked using Bayesian Networks but skin color is used to find the body parts. Further, the conditional probabilities are specified manually. In [FR04] examples are given handling a few frames of occlusion using shape and color in a Bayesian framework, but it is unclear if this method can withstand occlusion involving hundreds of frames (as our approach does). In [ZH03] hand tracking is performed using eigen dynamics analysis, but the hand tracking system uses pretrained hand models. It is unclear how person-independent these models would be. A method presented in [BLL02] uses multiscale features to find the hand. Color priors are used, requiring retraining for new people. This method will not work when the face is present because of the stronger blobs and ridges on the face. Work in [ZYW00] performs well on segmenting hands from complex backgrounds. They have an interesting approach that does not use a predefined color model. Rather it builds skin and background color models for the current image using the Expectation Maximization algorithm. It assumes that the hand is the only skin colored region in the image. It would not be able to differentiate between the hand and face. Further the method 10
44 requires that the hand cover a large portion of the image. Our image sequences frequently have only part of the hand in the image. An Elastic Graph Matching approach is given in [TM01]. This approach also uses color models to find skin regions and has problems when the illumination changes, as the skin color model fails. Training is extensive as each image in the training set requires manual labeling of at least 15 node points. Their approach has limitations with regard to geometric distortions of the hand as does [TM02]. Our approach is not hand model based, so we do not have this limitation. In [SGH05] an approach is given to track hand posture and recognize gestures in real-time. The approach makes use of a Markov Model combined with simulated annealing to continuously update the hand posture. The tracking works well but the method is tested on uncluttered backgrounds where the hand is usually easily discernible from the background. An approach that combines particle filtering and mean shift to incorporate the strengths of both is proposed in [SWT04]. The method can update its color model over time. However it appears that the motion model would fail in cases of long occlusion sequences. No testing is done on complex backgrounds involving the hand and face or other such cases. In [AL04] an approach is presented to detect and track hands through occlusion. It relies on a bootstrapping skin color training procedure to first detect the hands and suffers from the same limitations already specified. One additional problem is that it assumes that the hands and head are all detected before occlusion occurs. In our setup the hand comes into view and is already occluding the face. This approach would not work in this kind of scenario. Other methods already reviewed, [SG00a], also suffer from this limitation. Work done in [WC05] uses Markov Random Fields to more accurately model a tracked object. Particle 11
45 filtering is used as the underlying tracking mechanism. This setup is able to track though occlusion of differently colored objects and somewhat cluttered backgrounds, but the main limitation is that similarly colored regions will not track well through occlusion. In [CW96] an approach is given that segments the hand from a complex background. They localize the hand using motion information and map this region to a fovea vector. No method is given to extend it to work with other people. There is significant change in hand size which our method can cope with. Most model based approaches presented above fail in the case where the hand is only partially visible in the image or for gestures not in the database. Many training approaches do not generalize well because they usually aim to recognize specific gestures. This is not to say these approaches are inappropriate. Work such as [KT04] reports excellent results on a limited set of possible detection postures. Whereas in our environment it is not required that the hand make a specific gesture. Other approaches such as [AS03] are not directly related as they aim to only recognize the hand posture. Hands are detected using a skin model. Because of the similar colors of the hand and face, segmentation algorithms such as [CM02] will generally either under or over segment the hand/face occlusion. In principle, one can do tracking but then the question becomes how to initialize the tracking. Further, tracking methods generally fail when tracking across similarly colored regions. Background subtraction [SG00b] will not work in segmenting the hand over the face because even a slight movement of the head will trigger a large change of foreground pixels. Further, supposing the head was relatively fixed, the underlying problem with the RGB (and other color spaces) input domain is in the similarity of the head and hands. These methods cannot distinguish 12
46 between the head and hand colors. Most background subtraction methodologies operate on RGB or some other color space (i.e. the input space is color information). When similarly colored objects, occlude each other the individual pixel values in the region of occlusion give little information considered individually because the objects are similarly colored. This causes individual pixel based methods to have difficulty in our context. Methods trying to circumvent these problems such as [STW02] often require fine tuning of parameters. Our method is fully automated. Section 1.4 Temporalboost Learning There are many different learning mechanisms proposed ranging from HMM s to trajectory matching. Often however it is not known precisely which features will solve a particular task. When using a large number of features many machine learning methods, such as HMM s, require large amounts of training data or else they will overfit. It is often not feasible to have and label the necessary amounts of training data in these approaches. One way to circumvent the problem is to use a boosting approach where only a subset of the original features are selected. Boosting paradigms have been gaining popularity though they are not well studied for recognition of video events. A number of difficulties arise when using a boosted learning framework to recognize video events. How do we determine that an event has occurred? How do we localize the event in time? Is there a way to deal with temporal variation of the same action performed multiple times. How should the jump from single frame object recognition to video data event detection occur. Is there any way to use the temporal continuity properties of video, so as to be able to use previous 13
47 feature responses in evaluating the current frame? Another problem stems from the fact that in object detection the objects can be sized and normalized so that they are essentially aligned with one another; this makes feature design easier as the features all operate on data at the same scale. In the context of activities, it is not clear how one would normalize the activity to facilitate comparison. Would this normalization occur in time, space, illumination or all of the above? More fundamentally, in an approach such as AdaBoost, during training and testing each image is independent of the others. However in video data, if a face was viewed in one frame, it is likely it would be in the next if it was a true positive. AdaBoost should be able to decide which weak classifiers can increase their detection rate when allowed to use their own individual histories. Though a few boosting methods do operate on video data to conduct tasks such as classification, they do not use the temporal continuity of video at the weak and strong classifier levels. A new machine learning paradigm, TemporalBoost, is introduced and we show how this method can be applied to recognition of video events. When using TemporalBoost for events, a number of new features needed to be developed to handle temporal variance and other issues relating to activities. Preliminary results of this method appeared in [SSV04] and [SVS05]. The usual Haar features, with necessary modifications, could also be used in our context. Our contributions are in extending the boosting paradigm of machine learning to address the above limitations with respect to detection of video events. First we present TemporalBoost which allows features to rely on previous frames to make a decision in the current frame. Further TemporalBoost automatically learns the optimal number of frames needed to recognize each event while detecting as few false positives as possible. Second, to detect and localize events in video one 14
48 must either build specific classifiers that detect beginning and endings of events or group frame wise decisions after individual classifiers have been built. We use the latter approach which results in an additional layer of learning once the strong classifiers are built. Our extension allows both for detection and localization of actions in video. The third contribution is in designing a set of features which is useful for activity recognition in an office environment. In the context of object detection, comparison of feature responses was simple after image normalization. It is unclear how to normalize events, thus we have chosen the alternate path of more complex feature design. The features are evaluated simultaneously at multiple zooms taken from more or less the same viewpoint. Interestingly, many events rely on features evaluated at multiple zooms. An example of a single image from each zoom is shown in Figure 1.1. Section Previous Work This research touches on many aspects of activity recognition, so we review previous work in the following areas: AdaBoost Learning, Activity recognition and event representation. AdaBoost was developed first in [FS97]. Work in [VJ01] generated much interest in the computer vision community, and there have been many improvements to AdaBoost, such as FloatBoost [LZ04]. Recently many interesting applications have also emerged, among those [OAF04]. These systems all make a decision in an object detection context. There has been some recent work in using AdaBoost for speech recognition: In [DB04], a unique training approach using AdaBoost and HMMs 15
49 to sequence learning is proposed; Research in [KL03] also develops an AdaBoost framework to improve recognition of sequence data. In [YER04] AdaBoost is used for automatic visual feature formation to boost HMMs for speech recognition. However in most of these speech based methods the features are taken to be averages over some N frame window. This is not good for localization. In [BLL04] a method is presented for facial expression analysis using Adaboost. However the method specifically trains on only two frames for each facial expression (a neutral expression and a frame during the facial expression). That work essentially does not use video data for training as our approach does. Temporal features were introduced in [VJS03]. The features were designed to operate on two frames, though temporal information is not used after feature design. The above methods do not discover inherent temporal dependencies (if they exist) both between the classifier responses and between the feature level responses. In order to recognize activities much previous work has utilized point trajectories or contours of the objects in question [RYS02]. Work in [HNB04] and [NZH03] focuses on large-scale activities and makes use of both object and trajectory properties of objects in question. In [EBM03] a motion descriptor based on optical flow measurements is used to classify activities at low resolution. HMM s have also been widely used to recognize activities [BOP97] [NH02], though the large number of features in our context might not be suitable to such an approach. Related work can also be seen in the context of video summarization [ZC04]. Other work in activity recognition focuses on detailed views of persons and faces[iee04]. A variety of facial expression analysis methods are explored in [DBH99]. We seek to employ features at both the coarse and fine level to recognize a broader class of activities. 16
50 The work in [SHM04] relies on a representational framework for actions using various logical and temporal constraints. Results are shown on detailed views of hands to analyze actions. Other approaches in representational models for activities include [PA04], [HNB04], [MTB04], and [ATK02]. We do not focus on event representations in our work in this thesis. [SSV04] gave a method to automatically track the head and hands across cameras with different zoom. We employ [SSV04] to acquire hands and head tracks in all views, which we require in the development of the activity recognition features. Now that we have presented an overview of our research and the current state of the art, we proceed to the main contributions of the current research. The remaining chapters will consider each of our contributions in greater detail, beginning with detection and tracking across multiple cameras. 17
51 CHAPTER 2 DETECTION, TRACKING, AND CONSISTENT LABELING ACROSS CAMERAS In many problem domains there is a need to have both highly zoomed cameras looking at certain regions and lower zoomed cameras acquiring overall contextual information of the scene. Consider an office environment where someone is working at a desk. Many actions one would perform in this environment revolve around the head, such as talking, using the phone, looking at something, eating, coughing, putting on eye glasses, etc. A coarse view of the scene can give information about the origin and destination of hand-held objects and about such matters as how fast the hands are approaching the face. A finer view around the facial region would be able to provide more detailed information such as where on the face the action occurred, where the person is looking, whether the person is talking or not, what kind of object is being brought to the face and so on. In this context it would be helpful to have multiple cameras employing varying degrees of zoom to accomplish activity recognition. 18
52 Section 2.1 Definitions and Conventions There are many good references on the details of 3D multiview geometry. [HZ00] and [Zha98] provide good introductory knowledge. Only the minimum foundations needed for our purposes are presented here. A pair of cameras are related by the fundamental matrix, so all points in image I can then be transferred to their corresponding epipolar line in I by l = p F, where l = [ α β γ ] are the coefficients of the line equation α r + β c + γ = 0, (2.1) p is any point in I, F is the fundamental matrix and r,c are the row and column indices of point p. All epipolar lines will pass through the epipole, found directly from F by taking its singular value decomposition, F = U W V T. The epipoles are obtained immediately by normalizing the last columns of V and U respectively. To transfer an epipolar line to image coordinates normalize l, then, for lines with slope m > 1 apply equation 2.2: p 1 = l [ ] T and p 2 = l [ 0 1/Y 1 ] T, (2.2) where Y is the height of the image and p 1, p 2 are the intersection points of the image with the epipolar line l. The slope m is the ratio of the coefficients α. A slightly modified operation gives β the intersection points for lines with slope m 1: p 1 = l [ ] T and p 2 = l [ 1/X 0 1 ] T, (2.3) where X is the width of the image and p 1, p 2 are the intersection points of the image with the epipolar line l. 19
53 Now consider N cameras (we show 3) zoom 1 through zoom N (for us, zoom 1 through zoom 3). Let C i be the camera number with zoom i. Define I i,f to be a color image at frame, f, taken from camera C i. Define the set of objects in a particular image frame as X i,f = {x 1 i,f,...,xm i,f }, where i is the camera number and f, 1 f Z, is the frame number. m represents the number of objects in a particular frame. An object is defined by its bounding box (top left, bottom right corners). The centroid of x k i,f can be represented as the vector: [ˆxk i,f ŷ k i,f ]T. We would like to determine the consistent labeling between all objects in the various sequences. For a given frame f we have the set T = {X 1,f,..., X N,f } expanded as T = {{x 1 1,f,..., xm 1 1,f },{x1 2,f,...,xm 2 2,f },..., {x 1 N,f,..., xm N N,f }}, which is the set of all objects for frame f. We would like to find the mapping w(x k n,f) = {x a 1 b 1,f,xa 2 b 2,f,...,xap b p,f } which takes a particular object k in frame f viewed from camera n, and finds the corresponding object a k with 1 a k m bi for all cameras b i, 1 b i N,b i n, if the object is visible. m is subscripted to stress that the number of objects can vary between frames and/or cameras. Section 2.2 Detection and Tracking of Heads and Hands For activity analysis the heads and hands first need to be detected, tracked, and labeled across cameras. This section deals with detection and tracking of heads and hands. Our approach first finds the head regions and then builds color models of these regions which are used to find the hands. The head regions are detected independently for each camera, C a, employing the object detector described in [VJ01]. 20
54 Using the RGB pixel values of the head region, a color model, h a, is built for each, C a, as in [KK96]. However in [KK96] the remaining color pixel values are treated as negative samples. This will not produce a good color model in our case because the hand regions will count as negative samples. To overcome this limitation, after building an initial color model using the positive sampled regions, the final color model is only negatively weighted by those samples which did not show up positively in the initial color model. This prevents the hand regions from contributing adversely to the final color model and provides better segmentation. An appropriate threshold can be chosen to make a binary decision, 1 h a (r,g,b) > a H a (r,g,b) = 0 otherwise (2.4) which can then be used to segment the images. Since the head detector is for frontal head regions only, the color model will be helpful for detecting hands and heads with small variations in viewpoints. Figure 2.1 shows the input images in column one. Color segmentation output and head detection is in column two. Detected heads were drawn with rectangles around them. Once a detected head given by the head detector has been present for more than four frames, a mean shift [CRM00] tracker is initialized around this head region, which will provide tracking information in subsequent frames. There is no limitation to how many heads can be in the scene at one time. An alternative approach would be to initialize mean shift trackers around head regions whose centroids project to epipolar lines that intersect found head regions in all other views. 21

55 Figure 2.1: Output from the head detector and color segmentation. Found head regions are marked by rectangular boxes, and color pixels belonging to the head color model are marked as white. The first row is frame 3 in zoom 1. The second row shows frame 162 in zoom 1. Though no explicit color model has been generated for the hands, they show up reliably even for multiple people. In row 1 both heads are found, but later in the sequence (row 2) the head detector misses one head, though the color segmentation still finds both head regions as skin regions. 22
56 Next the hands must be found and tracked in each view. We could simply track all skin colored regions that were found from the head color model, but this has problems as there are many spurious skin regions marked. Better detection is possible using multiple cameras. First for frame f, all possible hand candidates are independently labeled in each camera, C a, using H a. Hand candidates are those connected components that have size H a (I a,f (x i,y i )) δ Φ 1 i where Φ 1 is the average head size in this camera, δ =.05, and i occurs over the connected component. The computation is performed at all levels of detail. Once all candidate hand regions are labeled, the epipolar geometry is used to confirm or reject the presence of a hand on an epipolar line in another view. Figure 2.2(a) represents a lower zoomed image, and Figure 2.2(b) represents a higher zoomed image. Three objects (one head and two hands) and the corresponding epipolar lines of the objects from the other view are shown in each image. For each hand candidate in C a its centroid is projected to an epipolar line in C b. The epipolar line is searched for a region with size ǫ Φ 2, where Φ 2 is the average head size in this camera and ǫ is a small positive constant. If only one region is found on the corresponding epipolar line in C b then a mean shift tracker is initialized around these regions in both views, and the regions are tracked. If there are multiple hand candidates along this line, the search is deemed ambiguous, and no mean shift trackers are introduced. This can be seen in Figure 2.3. This method is able to successfully detect and track the head and hands. Figures show automatic initialization of the hands. In all cases subfigures (a) and (c) are the same frame, f, taken from zoom 1 and 2, respectively. Subfigures (b) and (d) are the same frame, f, taken from zoom 1 and 2, respectively. 23
57 blob t centroid in (a) to epipolar line in (b) blob w blob u blob v blob x blob y centroid in (a) to epipolar line in (b) (a) (b) Figure 2.2: Unambiguous Hand Labeling. Three blobs are shown in (a). Blob t is the head and has already been identified in the first stage. It is shown (along with its epipolar line projections in both views for completeness). Blobs u and v are hand candidates. Blob v in (a) has its centroid projected to its epipolar line in (b). This line in (b) is searched for a matching, unambiguous hand candidate. It can be seen that there is a single hand candidate (blob y) on this epipolar line. This is an unambiguous match. Since the match is unambiguous, a mean shift tracker would be initialized around blob v in (a) and blob y in (b). This process starts the tracking for the matching hand candidates in both views. Similarly the hand candidate blob u in (a) has its centroid projected to its epipolar line in (b). This line is then searched and since a single hand candidate, blob x, is on this epipolar line, mean shift trackers would be initialized around each of these blobs in both views. 24
58 blob t centroid in (a) to epipolar line in (b) blob w blob z blob u blob v blob x blob y centroid in (a) to epipolar line in (b) (a) (b) Figure 2.3: Ambiguous Hand Labeling. Three blobs are shown in (a). Blob t is the head and has already been identified in the first stage. Blob v in (a) has its centroid projected to its epipolar line in (b). This line is searched and it is found that there are two hand candidates, blobs y and z on this epipolar line, thus a mean shift tracker would not be initialized around any of these regions. This is so because there is an ambiguity as to which hand candidate in (b) corresponds to the hand candidate in (a). 25
59 It often happens that the hand partially overlaps or occludes the face. When one or both hands overlap with the face the mean shift tracks will find the same candidate region (Shown in Figure 2.8). In this case the algorithm will use one of the tracks for all the overlapping regions. Once the regions separate, the proposed initialization procedure will find and reinitialize the regions. The algorithm then can continue tracking these regions using geometrical domain knowledge based on which side of the face the hand was on. When there are multiple head and hand regions and when there are other objects that need to be tracked, a consistent set of labels across cameras for all objects will be necessary. A method to establish these consistent labels across cameras is presented next. Section 2.3 Establishing Consistent Set of Labels Across Cameras In order to allow the cameras to communicate object information to one another, a method to determine the consistent set of labels across cameras needs to be found. For simplicity we will describe our method using two cameras. The ideas can easily be extended to work with additional cameras. Given two cameras, C a and C b we want to determine the consistent set of labels for objects between cameras for frame j (see Section 2.1 for a precise definition). Our approach uses the following constraints: epipolar line projections for each object spatial constraints 26
 Labels A and B indicate the found two hand candidates. Each hand candidate has a box around it.")
60 Label E (a) Frame 1 at zoom 1 (b) Frame 31 at zoom 1 Label A Label B Label C Label D (c) Frame 1 at zoom 2 (d) Frame 31 at zoom 2 Figure 2.4: In (c) Labels A and B indicate the found two hand candidates. Each hand candidate has a box around it. Since no matching hand candidates have been found in (a), these hand candidates are not tracked in subsequent frames. For frame 31 in (d) two hand candidates, Labels C and D, are found. In (b) a single hand candidate Label E is also found. Labels C and E are not ambiguous (according to the detection method), so mean shift tracks are initialized around both of these corresponding regions. Since Label D in (d) has no corresponding hand candidate in (b) no mean shift tracker is initialized around Label D. 27
61 Label B (a) Frame 10 at zoom 1 (b) Frame 101 at zoom 1 Label A (c) Frame 10 at zoom 2 (d) Frame 101 at zoom 2 Figure 2.5: In frame 10 there are no hand candidates in either (a) or (c). In frame 101 in (d) the hand candidate labeled A is found. In (b) a hand candidate, Label B, is also found. These hand candidates are not ambiguous so mean shift tracks are initialized around both of these hand candidates in both zooms. 28
 Labels A and B indicate the found hand candidates. Since no hand candidates that match have been found in zoom 1 (a), these hand candidates are not tracked in subsequent frames.")
62 Label E (a) Frame 360 at zoom 1 (b) Frame 364 at zoom 1 Label A Label B Label C Label D (c) Frame 360 at zoom 2 (d) Frame 364 at zoom 2 Figure 2.6: In (c) Labels A and B indicate the found hand candidates. Since no hand candidates that match have been found in zoom 1 (a), these hand candidates are not tracked in subsequent frames. For frame 364 in (d) Labels C and D indicate the found hand candidates. In (b) a single hand candidate, Label E, is also found. Since Labels D and E are unambiguous, mean shift tracks are initialized around both of these corresponding regions in (b) and (d). Since hand candidate Label C in (d) has no corresponding hand candidate in (b) no mean shift tracker is initialized around Label C in (d). 29
63 Label B (a) Frame 10 at zoom 1 (b) Frame 52 at zoom 1 Label A (c) Frame 10 at zoom 2 (d) Frame 52 at zoom 2 Figure 2.7: In frame 10 there are no hand candidates in either (a) or (c). For frame 52 in (d) hand candidate, Label A, is found. In (b) Label B is also found. These hand candidates are not ambiguous so mean shift tracks are initialized around both of these hand candidates in both zooms. 30
64 Label D (a) Frame 190 at zoom 1 (b) Frame 226 at zoom 1 Label B Label A Label C (c) Frame 190 at zoom 2 (d) Frame 226 at zoom 2 Figure 2.8: In (c) the Label A is found as a hand candidate, though this hand candidate cannot be seen in (a). Since there is a partial overlap occurring with the head and other hand, this hand is not considered a hand candidate in either (a) or (c). Since no matching hand candidates have been found in (a), the hand candidates are not tracked in subsequent frames. Frame 226 occurs after the occlusion. In (d) hand candidates Labeled B and C are found. In (b) a single hand candidate, Label D, is also found. Since Labels B and D are unambiguous, mean shift tracks are initialized around both of these corresponding regions. Label C in (d) has no corresponding hand candidate in (b) so no mean shift tracker is initialized around it. 31
65 trajectory constraints appearance constraints for each object The algorithm starts by transferring the object centroids in C a to their corresponding epipolar lines in C b. The distance between each epipolar line and each centroid in C b can be accumulated and thought of as a matching error between the object in C a that generated the epipolar line and the object in C b. A distance of zero indicates a good match. This is done for every frame in the sequence. The best match can be selected as the epipolar line/centroid pair with the lowest error. This leads to the following algorithm. 1. For the f th frame m objects: X a,f = {x 1 a,f,...,xm a,f } make a set of all centroids, P a = {[ˆx 1 a,f ŷ 1 a,f ]T,..., [ˆx m a,f ŷ m a,f ]T } in camera C a. Transfer these centroids using the fundamental matrix to get the set, A, of corresponding epipolar lines {l 1,...,l m } = {{[ˆx 1 a,f ŷ 1 a,f 1]F a,b },...,{[ˆx m a,f ŷ m a,f 1]F a,b }} in camera C b that correspond to the centroids P a from C a. 2. Make a set of centroids P b = {[ˆx 1 b,f ŷ 1 b,f ]T,..., [ˆx n b,f ŷ n b,f ]T } in camera C b n objects: X b,f = {x 1 b,f,..., xn b,f }. There is no requirement for n=m. If the ith object of C a,x i a,f is visible in C b it will lie on some epipolar line l k. So [ˆx j b,f ŷ j b,f ]T P b and l A the error for this match is the Euclidean distance between the centroid and the epipolar line d(l, [ˆx j b,f ŷ j b,f 1]) = l α ˆx j b,f + l β ŷ j b,f + l γ lα 2 + lβ 2 (2.5) 32
66 This distance is the error to match the object, x i a,f, in C a (whose epipolar line is l) with the object, x j b,f, in C b. l α,l β,l γ are the coefficients of l, the epipolar line with parameters described in Equation 2.1. We can compute the accumulated distance error for every centroid p P b in C b with every epipolar line for every frame and match the objects that had the lowest error. More formally given an object x i a in C a, to find the corresponding object in all other cameras C b compute: b a obtain argmin j 1 N i,j N i,j a,b d([ˆx i a,f ŷa,f i 1]F a,b, [ˆx j b,f ŷ j b,f 1]), (2.6) a,b f=1 where b is the index of the b th camera. N i,j a,b is the number of frames for which objects i,j had valid tracks in cameras a,b respectively. F a,b is the fundamental matrix between cameras a and b. The function d is given in Equation 2.5. We have verified that slightly better results can be achieved by modeling the error measure as a gaussian zero mean random variable d (l, [ˆx j b,f ŷ j b,f 1]) = ( 1 2πσ 2 e ) q 2 2σ 2 (2.7) where q is the value of Equation 2.5. We used Equation 2.7 in our experiments. In the above algorithm a method was presented that finds the labeling going from C a to C b. It is desirable for the matching to be commutative (If the number of objects differ across cameras, i.e. n m, then the matching occurs only in the direction with less objects ), so that (x i in C a matches x j in C b ) (x j in C b matches x i in C a ) Unfortunately, if the algorithm is computed from C b to C a the labeling might not be the same. Equation 2.6 can give different minimums going in different directions. This can happen, for 33
67 example, when multiple centroids in C a lie on nearly coincident epipolar lines in C b. The next three constraints provide additional restrictions on matched objects to help reduce the incorrect labelings due to these ambiguities. Section Spatial Constraints When two object centroids in one view project to nearly coincident epipolar lines in another view, it is difficult to determine which line belongs to which object using solely a Euclidean based distance criteria. In the case of coincident epipolar lines, the distance metric described in the previous section might not match the correct objects. In our camera setup the spatial ordering of objects across cameras must be preserved. We can use this fact to make a better determination as to which match is correct. The difficulty is in determining which object matches are to be penalized. Consider Figure 2.9(b) to illustrate the difficulty. The red box indicates the hand track. The white box indicates the head track. The small blue circles indicate the centroids of each of these bounding boxes (the lower centroid corresponds to the hand). The red and white lines correspond to the similarly colored bounding boxes in 2.9(a). Using the distance criteria both blue centroids are closest to the white epipolar line (corresponding to the head in 2.9(a)). Which match is the correct one and which should be penalized? To aid in resolving this ambiguity, we consider the two cases: in the first case, the bounding boxes of the objects intersect each other in both views, shown in Figure 2.9. In this case the object matches to be penalized can be easily identified. 34


68 (a) (b) Figure 2.9: One type of spatial inconsistency. The head and hand bounding boxes intersect in both views. The first spatial constraint tests for intersecting bounding boxes. If the boxes intersect in one view, then intersecting boxes in other views are checked for consistency and penalized if necessary. Figure 2.10: A second type of spatial inconsistency. In this case the bounding boxes of the skateboard and book do not intersect but the epipolar lines are almost coincident. This could result in incorrect labeling. The second spatial constraint penalizes label matches that overturn the order of the centroids. 35
69 Concretely, we proceed in the following manner. Given two objects in C a : x d a,f, xe a,f and two objects in C b : x g b,f, xh b,f, check the following condition x d a,f x e a,f and x g b,f x h b,f with x d a,fψ px e a,f implies x g b,f Ψ pxh b,f where represents intersection between bounding boxes. Ψ represents an operator that compares the ordering of the bounding boxes along the axis (x or y) that the bounding boxes are furthest apart on, and p is the parity indicating the direction of the comparison operator Ψ. If this condition is not met, the spatial constraint has been violated and the match between x d b,f and xg b,f is penalized by the Euclidean distance between the centroids: [ˆx g b,f ŷg b,f ][ˆxh b,f ŷh b,f ]T. It will be shown later in this section how to integrate this penalty into the original error minimization. In the second case, shown in Figure 2.10, the bounding boxes of the skateboard and book do not intersect but the epipolar lines are almost coincident, which will result in the epipolar distance minimization possibly selecting the incorrect labels. To resolve this, recall that every epipolar line was generated by a known object in C a. The two objects in C b nearest the coincident epipolar lines and the original centroids in C a that generated the coincident epipolar lines are checked for spatial consistency. The object matches to be penalized can, thus, be easily identified. Concretely, the minimum distance between the two epipolar lines [ˆx d a,f ŷ d a,f 1]F a,b and [ˆx e a,f ŷ e a,f 1]F a,b is computed. The minimum distance between points on the line will occur at one of the end points of the image, which can be found from Equations 2.2 and 2.3. If min < ε, then the lines are nearly coincident and the respective centroids in C b that are closest to either of the epipolar lines 36
70 [ˆx d a,f ŷd a,f 1]F a,b or [ˆx e a,f ŷe a,f 1]F a,b are identified. Only the situation where two centroids in C b have as their closest epipolar line either [ˆx d a,f ŷd a,f 1]F a,b or [ˆx e a,f ŷe a,f 1]F a,b is considered because it allows us to unambiguously identify which objects to compare (x g b,f and xh b,f ) and penalize. If the condition x d a,fψ px e a,f x g b,f Ψ pxh b,f does not hold then the match between x d b,f and xg b,f is penalized by the Euclidean distance between the centroids: [ˆx g b,f ŷg b,f ][ˆxh b,f ŷh b,f ]T. Again, it will be shown later in this section how to integrate this penalty into the original error minimization. Section Trajectory Constraints The spatial constraints may not resolve all ambiguities due to inaccuracies in the tracking or fundamental matrix. The spatial constraints work well, but stringent requirements must be satisfied to make use of them. Therefore a more broadly applicable trajectory constraint is introduced. From a high level, the trajectory constraint looks at all possible pairs of objects across views and penalizes them according to how dissimilar their motion is (based on the previous 30 frames). We address the following three cases: 1. If the motion of both objects is negligible, no penalty is assessed as the motion vectors cannot be reliably obtained. 2. If the motion of both objects is large, then a penalty is assessed based on the relative direction of the motion vectors. 3. If the motion of one is negligible and the other is large, a penalty is assessed based on the current match score (as one of the motion vectors cannot be reliably obtained). 37
71 The correct correspondences across cameras will be penalized least since their motion is most similar. This constraint ensures that moving objects in one view match with similarly moving objects in another view. Formally, the trajectory constraint penalizes object x i af in C a matching object x j bf in C b by adding to S(i,j) the amount T i,j,f = 0 for Ma,f i < 1 and Mj b,f < 1 θ i,j,f S(i,j) (.00001) for M i a,f > 1 and Mj b,f > 1 (2.8) S(i, j) otherwise where S(i,j) = f ( d ([ˆx i a,s ŷa,s i 1]F a,b, [ˆx j b,s ŷ j b,s 1])+ s=1 Γ A (s) [ˆx j b,s ŷ j b,s ][ˆxh s,l b,s ŷ h s,l b,s ]T + T i,j,s ) (2.9) is the current cumulated un-normalized match score between objects x i a and x j b. Γ A(s) is an indicator function, A is the set of frames in which the spatial constraint is met, and h s,l is the index of the centroid that violated the spatial constraint. It is subscripted by l to emphasize that it is possible for a single object pair to be involved in multiple spatial constraint violations. M i a,f = [ˆx i a,f ŷi a,f ][ˆxi a,f+j ŷi a,f+j ]T represents the maximum motion in a 30 frame sliding window for any single object i in a particular camera C a for a particular frame f. M i a,f = when, there is no bounding box information for xi a 38
72 in this 30 frame window. To find j compute j = argmax j [ˆx i a,f ŷi a,f ][ˆxi a,f+j ŷi a,f+j ]T θ i,j,f represents the difference between the angle of the maximum motion vectors for each object θ i,j,f = arccos M i a,f Mj b,f M i a,f Mj b,f M i a,f is the maximum motion vector computed from Mi a,f : M i a,f = [ˆx i a,f ˆx i a,f+j ŷ i a,f ŷ i a,f+j] T Since 0 arccos( θ i,j,f ) π θ i,j,f, there is no issue of angles becoming imaginary or wrapping around 2π. Section Appearance Constraints Previous methods have considered color similarity of objects between views to increase the accuracy of the label assignments. This is important when there are small errors in the track data or epipolar geometry which cause the objects to be matched incorrectly. Directly comparing the appearance of objects can present difficulties especially when the cameras are not color calibrated. Relative color similarity between objects still can give useful information. At an abstract level we can consider all permutations of object matches from one camera to another. Suppose there are two objects, A,B in Camera 1 and two objects A,B in Camera 2. One permutation would be A matches to A and B matches to B. Another permutation would be A matches to B and B 39
73 matches to A. Given a permutation we can find the appearance score of this match by computing the average intensity difference between the corresponding objects in the permutation. Concretely, after applying the previous constraints to all frames, if there are still ambiguous matches (i.e., those objects for which there is not a 1-1 mapping), then collect these ambiguous objects into two lists. The ambiguous objects in C a are A = {x 1 a,...,x q a} and those in C b are B = {x 1 b,...,xq b }, where q is the number of ambiguous objects. To get the correct matches, find the permutation of superscript indices in B to minimize the relative error: p = argmin P A i=1 ( 1 M Ī a (x) 1 M N x x i a N x x p i b Ī b (x) ) 2 (2.10) where P is the set of all permutations of the indices of ambiguous objects in B. Each p is a set of indices of objects in B. Ī(x) represents the image intensity at x. Figures Figure 2.13 show some results of the labeling algorithm. The tracks that are colored the same were matched across views. In Section 2.2 the method automatically finds the heads and hands. To test the accuracy of the labeling algorithm, we have manually introduced additional bounding boxes around other objects. The algorithm correctly labels all objects across all views. More results are presented in Section 4.8. We show the final function that needs to be minimized to satisfy all constraints. Given an object x i a in C a, to find the corresponding object in all other cameras C b compute: b a obtain argmin j 1 N i,j N i,j a,b ( d ([ˆx i a,f ŷa,f i 1]F a,b, [ˆx j b,f ŷ j b,f 1])+ a,b f=1 Γ A (f) [ˆx j b,f ŷ j b,f ][ˆxh f,l b,f ŷ h ) f,l b,f ]T + T i,j,f + ΓC (x i a,x j b )Ω(P) (2.11) where b is the index of the b th camera. Γ A (f) and Γ C are indicator functions, A is the set of frames in which the spatial constraint is met and C is the set of objects for which the appearance constraint 40
74 is met. h f,l is the index of the centroid that violated the spatial constraint. It is subscripted by l to emphasize that it is possible for a single object pair to be involved in multiple spatial constraint violations. Ω(P) is the penalty amount found from Equation Section 2.4 Quantitative Results The proposed overall method has been formulated in the context of activity analysis for cameras with multiple levels of zoom. The guidelines for experimental design and evaluation are discussed next. The cameras were placed so that all were facing the same scene with different levels of zoom. The successively higher zoom levels each viewed a subset of the scene taken at lower zoom levels. There were no strict camera placement protocols. Datasets taken at different times did not have to have identical zooms/placement as the initial experiments. The zoom and camera placement were different for most of the tests. Because our method uses the fundamental matrix, we did not need strict camera placement protocols. We wanted this flexibility to make the system less restrictive and more useful to others. To compute the fundamental matrix 14 point correspondences were used. This was sufficient calibration for our purposes. The experiments were all in a normal office environment and no special illumination calibration across cameras was performed. We first present results of the correspondence algorithm (Section 2.3) and then show results for activity analysis (Section 3.1). In evaluating our consistent labeling algorithm the main task to evaluate was how many objects were correctly labeled across the video sequences. A number of constraints were used (see Sec- 41


75 Figure 2.11: Output of consistent labeling. Each row is a particular time unit in the sequence. For each row zoom 1, zoom 2, and zoom 3 are shown respectively. The previous object trajectories are superimposed on the current frame in the sequence. The matched trajectories across views are shown in similar colors. All objects were labeled across views correctly. Row 3 shows a frame after the head has moved. Notice that this generates a white line, similarly the white line appears in the other zooms indicating it is the same trajectory. 42

76 Figure 2.12: Output of consistent labeling. See Figure 2.11 for more information. The matched trajectories across views are shown in similar colors. It can be seen that all objects were labeled across views correctly. In Row 1 only the head has moved, and so no other trajectories can be seen. In Row 2 the hand is scratching the head (trajectory is marked in red across zooms). Row 3 shows the other hand approaching the head with a mobile phone. 43

77 Figure 2.13: Output of consistent labeling. This figures shows the same sequence as that shown in Figure The difference is that every 30 th frame is shown to get a better flow of the video sequence. The frames go from left to right and top to bottom. 44


78 Figure 2.14: Other Camera Configurations that we tested the labeling algorithm on (Section 2.3). There were two cameras in this setup. One input image from each camera is shown. tions ) to make the matching more robust. A valid question arises: is there any benefit of the constraints. We show in the following tables how the correspondence matching performed with various combinations of constraints. Results using only the epipolar distance minimization (Equation 2.6) are presented in Table 2.1. Table 2.2 shows the effect of using Equation 2.7 for the error instead of Equation 2.5. Results using only the epipolar distance minimization and spatial constraints are presented in Table 2.3. Results using only the epipolar distance minimization and trajectory constraints are presented in Table 2.4. Next results are presented, in Table 2.5, using only the epipolar distance minimization and appearance constraints. When we combine all four constraints together we achieve 100% accuracy as presented in Table 2.6. Table 2.7 lists a summary of the average score for each algorithmic setup. This average was obtained by summing the individual percentage scores for each sequence and dividing by the total number of sequences. The appearance constraints did well overall. However in sequence 2, the appearance constraints failed, and this was a sequence that the spatial constraints performed well on. Though in sequence 2, it was only in combining all the constraints that the algorithm achieved 100%. Thus we can see how the various constraints work together to achieve better results. Data Sets 1-7 are multiple level of zoom sequences. Data Set 8, shown in Figure 2.14, is a sequence with partially overlapping 45
79 Table 2.1: Only Epipolar Minimization using Equation 2.5 Sequence # Objects in Objects in Objects in % Matched # Matched Camera 1 Camera 2 Camera 3 Sequence /20 Sequence /18 Sequence /22 Sequence /16 Sequence /20 Sequence /24 Sequence /12 Sequence /12 Sequence /18 FOVs as found in many surveillance papers [CA99]. Data Set 9 is a three camera sequence with partially overlapping FOVs. This labeling algorithm was tested on a number of different camera configurations to show the robustness of the proposed approach. The proposed labeling algorithm has been tested on eight such three camera sequences, and one two camera sequence for a total of over 18,500 video frames with over 160 objects corresponded correctly with 100% accuracy. 46
80 Table 2.2: Only Epipolar Minimization using Equation 2.7 Sequence # Objects in Objects in Objects in % Matched # Matched Camera 1 Camera 2 Camera 3 Sequence /20 Sequence /18 Sequence /22 Sequence /16 Sequence /20 Sequence /24 Sequence /12 Sequence /12 Sequence /18 47
81 Table 2.3: Epipolar and Spatial Constraints Sequence # Objects in Objects in Objects in % Matched # Matched Camera 1 Camera 2 Camera 3 Sequence /20 Sequence /18 Sequence /22 Sequence /16 Sequence /20 Sequence /24 Sequence /12 Sequence /12 Sequence /18 48
82 Table 2.4: Epipolar and Trajectory Constraints Sequence # Objects in Objects in Objects in % Matched # Matched Camera 1 Camera 2 Camera 3 Sequence /20 Sequence /18 Sequence /22 Sequence /16 Sequence /20 Sequence /24 Sequence /12 Sequence /12 Sequence /18 49
83 Table 2.5: Epipolar and Appearance Constraints Sequence # Objects in Objects in Objects in % Matched # Matched Camera 1 Camera 2 Camera 3 Sequence /20 Sequence /18 Sequence /22 Sequence /16 Sequence /20 Sequence /24 Sequence /12 Sequence /12 Sequence /18 50
84 Table 2.6: All Constraints Sequence # Objects in Objects in Objects in % Matched # Matched Camera 1 Camera 2 Camera 3 Sequence /20 Sequence /18 Sequence /22 Sequence /16 Sequence /20 Sequence /24 Sequence /12 Sequence /12 Sequence /18 Table 2.7: Summary For All Algorithmic Setups Algorithm Setup Average Sequence Score Only equation Only equation Epipolar and Spatial Constraints 90.2 Epipolar and Trajectory Constraints 91.5 Epipolar and Appearance Constraints 98.1 All Constraints
85 Section 2.5 Conclusion In this chapter we have developed a robust multizoom framework to enable activity recognition. The presented framework is able to combine information from cameras in multiple ways to increase overall system performance. Heads and hands are automatically found and tracked using multiple levels of detail. We have presented a method which is able to incorporate epipolar, spatial, trajectory, and appearance together into a unified framework to achieve consistent object labeling across multiple cameras. In the next chapter we build on this foundation and design features using these primitives. The features, in turn, will lay the foundation for using TemporalBoost. 52
86 CHAPTER 3 DEVELOPMENT OF FEATURES FOR TEMPORALBOOST In order to motivate the kinds of features we designed we start by giving a high level view of what we want to compute. In Figure 3.1(a) we introduce a novel representation of the Hand And Face Interactivity Space (HAFIS). It is a four-dimensional feature space. The first feature is based on how many hands are needed for the given action. Sneezing or talking require no hands, while putting on eye glasses can require two hands. Eating, drinking, scratching one s face, using a phone, are head and hand interactions requiring one hand. Of course there is some overlap between the classifications. The second feature, is based on how long the head and hand(s) interacted (temporal extent). Swatting a fly off one s face takes considerably less time than putting a phone to one s ear and talking to someone. The third feature is the spatial location of the hand relative to the head. The face can be broken down spatially to aid activity recognition as in Figure 3.1(b). For instance, when using a phone the hand stays next to the ear and the phone rests by the ear. Drinking requires one to bring a cup (or straw) to the mouth region and open the mouth. Scratching the ear actually looks very similar to talking on the phone. To resolve this ambiguity, we can differentiate the activities based on whether there is an object in the hand, which is the fourth feature. Other object information, such as where in space an object came from and where it 53
87 s a ial i f j i f a i ha s i l (a) See Text for Description of the Axes (b) Figure 3.1: HAFIS Space and Face Graph was placed after it was used, could be acquired as well. The above partitioning represents a natural way to classify actions and lends itself to a probabilistic framework. This representation gives us much generality to express a broad class of activities involving the face and hands. From the above high level description of feature types we derived the following three categories of features: Multizoom Features Temporal Features Single Frame Features Multizoom features are those that simultaneously require multiple levels of zoom. They generally rely on using feature responses in one zoom to conditionally evaluate features in another zoom. Temporal features are those that require some kind of frame history. They are usually computed at lower zoom levels as they keep track of scene context that cannot be inferred from a high zoomed image of the face. An example of this kind of feature would be artifact detection in zoom 1. Single 54
88 frame features are those that do not need information at multiple zooms or time scales. They can be evaluated frame wise. All of the features in [VJ01] rely on simple frame wise (or region wise) computations. They expand their feature set to include rudimentary temporal features in [VJS03]. However, their features do not have the temporal complexity of our features. In our work we include many kinds of temporal features and show how to incorporate them into an Adaboost frame work. In the next three sections we explain the features in each category and give some idea of their individual performance. The design of the features themselves was motivated by determining at a high level what needed to be computed to determine the actions. Section 3.1 Combining Multiple Zooms for Improved Action Recognition After performing tracking and labeling across cameras as described in Chapter 2, the next step is to use the multiple levels of detail for improved activity analysis. We demonstrate with three features the capability of our system to use multiple levels of scene detail to improve activity analysis. Section Object Segmentation The first scenario we consider is determining whether there is an object in the hand as it comes to the face. Using only a view such as zoom 1 will present several challenges because there is not enough detail to determine whether the hand had an object in it, and whether it went to the mouth or the ear. In a higher zoomed view such as zoom 3, there is no way to know where the object originally came from in the scene or where and when to look for the object, but zoom 1 and 55
89 zoom 2 both can provide this information to zoom 3. Thus, multiple zooms need to be combined in a manner such that each zoom level answers the questions that it is best able to answer. We show how to combine multiple levels of detail to detect and analyze these objects that are difficult to detect with a single level of zoom. In previous sections C a and C b were denoted as arbitrary cameras. Here the strengths of each zoom are used, so C l and C h denote the lower and higher zoomed cameras respectively. This notation will be used throughout this section. To identify if there is an object in either hand, the hands in C l are analyzed for motion by computing I t,l,f. I t indicates temporal derivative for camera, C l and frame f. Significant motion of non-skin colored pixels indicates that a potential object is found. p is denoted as the centroid of this potential object in the lower zoom, C l. If a significant amount of motion generated by nonskin colored pixels is found in C h near the intersection of the epipolar line, p F l,h, with the image plane, then an object is assumed to be in the hand. The flowchart (including the auto-correct step in Section ) is shown in Figure 3.2. Concretely, for each hand region B i = x i a, in C l found using the method in Section 2.2 compute: H l (I l,f (p))ît,l,f(p) > α 0 (3.1) p B i Where p is an image point, H l is the negated color model of the head and hands for C l, presented in Section 2.2. I l,f is the image from camera C l for this frame f. Î t,l,f is a binary valued motion segmentation produced from I t,l,f in the following way: p, Ît,l,f(p) = I t,l,f (p) > α 1 (3.2) 56
90 Inputs: All Hand Regions In Zoom C l Eq. 3.1 Count # Object Pixels In Hand Region # > α 0 Eq. 3.3 Compute centroid and transfer to C h using epipolar geometry Eq. 3.4 Count # Object Pixels along epipolar line in C h # > α 2 Object in hand No Object In Hand according to C l No Object In Hand according to C h C l and C h contradict re- in Inputs: Hand gion C l Eq. 3.2 Find moving pixels in hand region Add all moving pixels to color model Color model is now updated Figure 3.2: Flowchart for Section (top row) and (bottom row). If equation 3.1 holds then C h can be notified as to where an object may be present by finding the corresponding epipolar line c F l,h, where c is the centroid in C l c = p B i p H l (I l,f (p))ît,l,f(p). (3.3) p B i Î t,l,f (p) While it is true that the epipolar geometry maps points to lines (for orthogonal, perspective cameras), the search for the object can be reduced to two regions. This reduction in the search space is possible since we know the hand and object are not yet in C h. Since we have an object position in C l, we can find its epipolar line l in C h. Then intersect this line with the image plane, and only look at these intersection points, P i, for entering objects. There will be at most two points because the images are planar. With the predicted intersection points P i, regions around these points, R i are searched using a modification of equation 3.1: H h (I h,f (p))ît,h,f(p) + H l(i h,f (p))ît,h,f(p) > α 2 (3.4) p R i 57
91 The main differences here are that 1) we have a predicted region R i which gives the probable location of where to look in C h and 2) we can use H l which is the object color model from C l, transferred to C h, to find additional moving non skin pixels. H l is built (using [KK96]) from the lower zoomed camera, C l, using the pixels p B i such that H l (I l,f (p))ît,l,f(p) > 0. Since the cameras are not color calibrated the quality of the transferred color model H l could be increased by performing a color space transform such as [RAG01]. H l and H h are the color models for the head and hands in C l and C h respectively (presented in Section 2.2). The object color model of C l could be updated based on the object color model in C h. If inequality 3.4 does not hold then it means no objects appeared in C h at location P i, with the predicted color H l and C h assumes a false positive was observed. This allows for a bad segmentation in C l to be auto corrected in C h. The bad segmentation in C l will not yet be eliminated but the propagation of the error is halted. Section details how C l can then be notified of its error to correct the bad segmentation. If the object is confirmed in C h, then segmentation in C h can proceed. By passing location and color information between cameras, we can achieve better object segmentation. This allows early identification of objects in C h. By passing this updated color and spatial information back to C l we can update its color and spatial parameters for the object in question, which will allow for better segmentation in the lower zooms. Results from our multi camera segmentation have demonstrated that we are able to correctly determine when an object is in the hand and further, when C l gives an incorrect result the method is able to determine this in C h and notify C l. Results are shown in Figures 3.3 and 3.4. In Figure 3.3 C l triggers that an object is present in the hand because the segmentation is not perfectly correct. This can be seen by observing the hole in the segmented skin 58
92 image. The C h segmentation is correct and it does not observe any significant motion of non-skin colored objects, thus it overrides C l s decision and notifies C l of the incorrect segmentation. In Figure 3.4, there is a mobile phone being brought to the head. Here C l identifies an object and alerts C h to its possible location and color. C h then correctly verifies that an object is present. Section Automatically Correcting Incomplete Segmentations As stated in Section 2.2 the color model is built using the RGB values of the head pixels. This gives a good color model for the hands, but it is not always complete. In Figure 3.3 the reason that zoom 2 incorrectly determines that an object is in the hand is because of the incomplete color model that is built using the head s color information. It was already shown in Section 3.1 how the color models of the object can be transferred across cameras to allow for improved object segmentation. Here we show how the color model of the head and hands in C l can be auto-corrected. This is a consequence of the multicamera detection scheme. When C l incorrectly determines that an object is in the hand, C l can go back to this particular frame (which can be done once C h notifies C l of the error) and put these hand pixels that were detected as an object in the color model for the head and hands. Concretely, the following steps must be taken: 1. C h notifies C l of the incorrect segmentation. 2. C l then goes back to the frames that it (incorrectly) determined an object was in the hand. 3. Any moving pixels in this region are then treated as hand pixels and they are added to the color model for the head and hands. This process greatly increases the accuracy of the color model and Figure 3.5 shows the segmentation using the corrected color model. 59


93 Figure 3.3: Zoom 2 images are in column one and zoom 3 images are in column two. Row one is the input images. Row two is the I t,l,f images, and the third row is the color segmentation images. In zoom 2, a poor color model does not correctly segment all of the hand(column one, row three). Thus zoom 2 incorrectly concludes that an object is present in the hand. However, in zoom 3, the color segmentation is correct, it can override zoom 2 s decision. 60


94 Figure 3.4: In this case zoom 2 correctly detects an object, and zoom 3 confirms that an object is present in the hand. See Figure 3.3 for more explanation on the details of each row of images. 61
95 Figure 3.5: This figure shows how an incorrect result in one zoom can be used to correct future bad segmentations. Column 1 shows the input image. Column 2 shows the segmentation using the incomplete color model. This figure is the same as Figure 3.3 (column one, row three). Column 3 shows the segmentation of the same image after the notification and update process. This update of the color model allows for much better segmentation of the hand. This is an interesting consequence of the multizoom cooperation among cameras. Section Determining Number of Hands In Head Region For action analysis another important subtask is determining how many hands are at the face. Certain actions require a certain number of hands to be present. Putting on eyeglasses requires two hands whereas drinking a beverage involves one hand coming to the face. Utilizing multiple zoom levels aids in the task of determining the number of hands in the head region. Zooms one and two cooperate in this task. The flowchart for this scenario is shown in Figure 3.6. The first step is to compute the distance between the head and hand for each zoom as shown in Figure 3.7. This results in d 1,d 2,d 3,d 4. Then the likelihood of the hand being near the face is computed as ( 1 2πσ e d 2 i 2σ ). 2 Because the hand tracks are noisy we add the distance between the hand and head ( 1 for zooms one and two: 2πσ e (di +d j ) 2 2σ ). 2 The plot of this measure over time is shown in Figure 62
 2 2σ )(for 2 1 hand 1 and hand 3).")
96 Inputs: All Corresponding Hand Regions In Zoom C 1 and C 2 Compute d 1,d 2,d 3,d 4 Compute ( 1 2πσ e (di +d j ) 2 ( 1 2πσ e (di +d j ) 2 2σ 2 ) > α 3 ) Hand in 2σ 2 head region Figure 3.6: Flowchart for Section Figure 3.7: Computing distance between the hand and head. ( The red plot is 2πσ e (d1 ( +d 3 ) 2 2σ )(for 2 1 hand 1 and hand 3). The green plot is 2πσ e (d2 ) +d 4 ) 2 2σ 2 ( 1 (for hand 2 and hand 4). When 2πσ e (di +d j ) 2 method are shown in Figure σ 2 ) > α 3 the hand is near the face. Results of the Figure 3.8: Probability of hand in head region. 63

97 Figure 3.9: Automatic results of determining the number of hands in head region. Inputs: All Hand Regions In Zoom C l Eq. 3.5 Count # Moving Pixels In Hand Region Eq. 3.6 Compute centroid and transfer to C h using epipolar geometry Count # Moving Pixels along epipolar line in C h Hand in region with max pixel count Figure 3.10: Flowchart for Section Section Localizing Hand on Face The final scenario we present is determining where on the face the hand is. Many actions can be distinguished based on where the hand is on the face, such as using the phone and drinking. We split the head into six regions shown in Figure 3.11a. The computation is similar to that in Section with the difference being all moving pixels are used. Thus Equation 3.1 becomes Î t,l,f (p) > α 4 (3.5) p B i Equation 3.3 becomes c = p B i p Ît,l,f(p) p B i Î t,l,f (p). (3.6) 64

98 Equation 3.4 is similarly modified. The region with the maximum number of hand pixels is taken to be the location of the hand. Results of hand localization are shown in Figures 3.11b and 3.11c. The flowchart for this scenario is presented in Figure a b c Figure 3.11: Automatic results of hand localization. Section 3.2 Quantitative Results Results from the multiple levels of detail activity analysis module are now presented. Multiple camera configurations were tested with various camera placements. The object segmentation module was tested on 15 video clips. The method was required to automatically determine whether there was an object in the hand for each sequence. In all cases the hand came to the face either with an object in the hand (eight times) or without an object in the hand (seven times). In all the trials there were only two bad decisions (one in each category). Some of the clips were challenging. For instance the method was successful in determining that there was an object in the hands when eye glasses were being brought to the head. With one low zoom it would be hard to see the eyeglasses. Further, unconstrained search in zoom 3 would have too many false positives. The 65
99 system was able to successfully recognize when only the hands were coming to the head. Figure 3.12 shows a case in which the user enters the scene, though his hand is not put to his head. In this case, there was significant skin (face) and non-skin(hair, eyes, etc...) in zoom 3, which would have given a false alarm if the system only looked at zoom 3 or used some other naive method. The Determining Number of Hands In Head Region module was tested on 10 video clips. The method was required to determine how many hands were at the face (if any). Five clips had one hand coming to the face and five clips had two hands coming to the face. The method correctly determined the number of hands coming to the face in 9 of the clips. The system never said there were hands at the face when there were none. The Localizing Hand on Face module was tested on 10 video clips. In all clips the hand came to one of the six regions shown in Figure 3.11a. The method was required to determine which region the hand was in. The method had only two incorrect decision. That is we made the correct determination as to which region the hand was in in eight clips. In all these scenarios the multicamera formulation is able to discern the context of the scene. The term refers to the low level tracking information available and coarse object information in the lower zooms combined with the object detail present in the high zooms. Also present in the high zooms is more detailed (but spatially limited) tracking information. Because there is no hand near the head when the user is entering, which is known from the context of zoom 2, the method is able to disregard the significant non-skin motion which would have otherwise signaled a false positive that the hand was near the head. 66


100 Figure 3.12: Multizoom Segmentation. The first row shows the input images in zoom 2. The second row shows the input images in zoom 3. Rows three and four show the Ît,l,f images in zoom 2 and zoom 3 respectively. Though there is significant non-skin motion, the system is able to infer from the context of zoom 2 that the hand is not near the head. 67


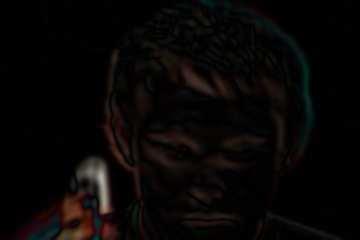


101 Figure 3.13: Multizoom Segmentation. Continued on next page; 68
102 Figure 3.13: Column one contains zoom 2 images. Column two contains zoom 3 images. Row one contains the input images. Row two contains I t,l,f images. Row three shows segmentation using the object color model. In row four segmentation fusing motion and object color is shown. The final image on the fifth row shows the zoom 3 view of the object segmented using object color, skin color, and motion information. Color information from both zoom 2 and 3 was used. Section Other Directions for Integrating Multiple Levels of Zoom We have given details on three techniques to combine multiple levels of zoom with applications for action analysis. There are many other possible ways to use multiple levels of zoom. For instance one technique would be to measure the temporal duration the hand was in the head region. Another technique would be to determine what object a person was looking at using the detailed head position in zoom 3 combined with the scene details (possible objects) in zooms 1 and 2. We are exploring these and other methods to combine zoom levels. Section 3.3 Temporal Features In order to perform activity recognition of actions involving the hand and head strong features that determine exactly where the hand is over the face needed to be developed. It is intuitive that having features which determine precisely where the hand is over the face is necessary for action recognition. Determining the boundary of the face and hand is a well known occlusion problem that is difficult to solve. The difficulty lies in the fact that the hand and head are similarly colored/textured regions. One feature in particular has proven to be reliable in resolving this occlusion problem, 69
103 s a ial i f j i f a i ha s i l (a) See Text for Description of the Axes (b) Figure 3.14: Activity Feature Space and Face Map and we devote particular attention to it because of its broad application to other areas of computer vision research. The goal of this section is to provide a feature that finds where the hand is at all times during hand/face occlusion. By reliably tracking the hand across the face at all times, a number of applications ranging from HCI to video indexing and retrieval to performing action recognition can be performed. To see why such precise localization of the hand in the region of the face is necessary consider Figure 3.1, reproduced here as Figure 3.14 for convenience. At the most basic level this information needs to be captured in some way by any activity recognition system. The third feature is the spatial location of the hand relative to the head. The face can be broken down spatially to aid activity recognition as in Figure 3.14(b). For instance, when using a phone the hand stays next to the ear and the phone rests by the ear. Drinking requires one to bring a cup (or straw) to the mouth region and open the mouth. The primary focus of this section is in measuring accurately this third feature. Once solved it will allow other aspects of activity recognition and HCI to be solved. 70
104 In algorithmic form, a video is input and the segmentation of the hand over the face is output. First we compute the potential and force field image representations. Then we place unit test pixels uniformly throughout the image. Next, we compute the distance traveled of each test pixel in the force field. Each pixel location has its own mixture of Gaussian model which is updated every frame when the new distance traveled observation comes in. When the hand enters the image these distance traveled observations for each test pixel location will change substantially. We compute (for each test pixel location) the current observation s distance from its distribution. Hand regions are those that had the largest distance from their distributions. First details on the underlying image representation are provided. Next it is shown how formulating the problem using MoG can aid the task of segmenting the hand/face. Finally results are presented and then we conclude. Section 3.4 Potential Images The potential energy at a given position, r j, with respect to position r i, in image I is given by E i (r j ) = I(r i) r i r j (3.7) where r j is the image location in question and I(r i ) is the image intensity at position r i. Notice that this computation says nothing about the intensity of the pixel at location r j. E i (r j ) is a function of other image intensities. This quantity is accumulated for every pixel in the image 71

105 (a) (b) (c) Figure 3.15: Potential Image for Various Input Frames. Input images are shown in column a: the left most column. Potential images are shown in column b. Notice that the potential image is quite smooth, due to the large convolutions. Column c shows the quantized potential images so that the equipotential curves can be more easily seen. to compute the total potential energy at location r j : E(r j ) = I(r i ) r i r j r i r j (3.8) Equation 3.8 gives the potential energy for a particular image location. This computation is then performed for every location in the image. This gives the potential energy image. Two potential images are shown in Figure Section Force Fields The force field (which can be derived from the image potential) indicates the force exerted at each location r j by all the other pixels in the image. The force vector at position, r j, with respect to 72
106 position r i, in image I is given by F i (r j ) = E i (r j ) r i r j r i r j 2 = I(r i) r i r j r i r j 3 The force, F i (r j ), is a vector with two components. These vector fields will be very important in the image representation. The units of pixel intensity, direction, and force are arbitrary as is the origin of the coordinate system. To find the force exerted by all pixels at a particular image location r j simply compute F(r j ) = I(r i ) r i r j (3.9) r i r j 3 r i r j F(r j ) is the normalized vector at r j computed as F(x) = F(x). Examples of the force fields F(x) are shown in Figure Since the force fields are two dimensional the magnitude and direction are shown as separate images. The direction was quantized (for display purposes only) into 10 regions. Section Finding Potential Wells Once the potential and force field images have been computed the well points(local extrema) are computed. This is done in an iterative fashion. Unit test pixels are placed uniformly (resulting in a rectangular grid of test pixels) throughout the image. They can be placed at every pixel, every other pixel etc. They are placed in the field and serve to capture the flow of the field. Suppose there are m test pixels t 1,...,t m. Since the position of each test pixel will change as it traverses the force field, we denote the initial location of t i as t i,0. To find any t i,j apply the recursive equations: t i,0 = (x i,y i ) 73
107 (a) (b) (c) Figure 3.16: Force Vector Fields for various input frames. Input images are shown in column a. Column b contains the magnitude of the force field and column c contains the direction (quantized) of the force field. t i,j = t i,j 1 + F(t i,j 1 ) (3.10) Where F(x) is the normalized vector at x, which is computed as F(x) = F(x). Given a unit test F(x) pixel starting point, t i,0, it goes through the force field until it stabilizes at a well point, denoted as t i,n. Unit test pixels eventually reach stable points. In our examples convergence was always reached well before N =500 for the 1000 s of image we tested. Iterations needed for convergence depends on image size and the number of wells. Larger images or ones with fewer wells will need more iterations. In order to make the method more robust we define the following stopping criteria for convergence: t i,j t i,j δ δ 1 2 (3.11) 74
. The black lines are the paths that the test pixels take through the force field.")


108 (a) 50 iterations (b) 100 iterations (c) 150 iterations (d) 250 iterations (e) 500 iterations Figure 3.17: These images show the test pixel locations after 50, 100, 150, 250 and 500 iterations (of Equation 3.10). The black lines are the paths that the test pixels take through the force field. The black circles indicate where the test pixels currently are located. As the number of iterations increases notice how fewer circles appear. This occurs because more of the test pixels reach the final well locations as the number of iterations increases. where δ can be in the range of The convergence test essentially makes sure that the algorithm does not stop until the test pixel stops moving. Since movement is determined by normalizing the vector at t i,j there will always be at least some minimal movement, which is why we consider some finite, small window. This allows the computation to be ended whenever convergence is reached. Not all t i end up at the same wells. The path that a test pixel takes is called a channel. It is easy to see that once two test pixels reach a common point, they both travel the same path from them on. 75

 is original image, (b) is the potential")
 is potential image with")

 is the direction of the force field,")
109 (a) (b) (c) (d) (e) (f) (g) (h) (i) Figure 3.18: Input frame demonstrating concepts of image representation. (a) is original image, (b) is the potential image, (c) is the potential image with well points overlaid, (d) is potential image with channels overlaid, (e), (f), and (g) correspond similarly to the force magnitude image. (h) is the direction of the force field, while (i) is the original image overlaid with the channels and wells. 76

 is original image, (b) is the potential")
 is potential image with")

 is the direction of the force field,")
110 (a) (b) (c) (d) (e) (f) (g) (h) (i) Figure 3.19: Input frame demonstrating concepts of image representation. (a) is original image, (b) is the potential image, (c) is the potential image with well points overlaid, (d) is potential image with channels overlaid, (e), (f), and (g) correspond similarly to the force magnitude image. (h) is the direction of the force field, while (i) is the original image overlaid with the channels and wells. 77
111 In practice our representation is similar to a low-pass filter. We develop the relationship to force and potential to give more intuition into the physical meaning of how test pixels travel through the force field to potential wells. This design choice will also become more clear in Section 3.5. Moreover with a physical interpretation, it is clear that F(r) = E(r). Some examples of the channels are shown in Figure To get these images, test pixels were placed uniformly throughout the image. For every t i the wells are found using Equation As said previously 500 iterations are used. We show the intermediate results after various numbers of iterations. Before deriving the distance traveled feature we would like to give some intuition as to what information in the image the force field is capturing and why it is useful in our problem domain. Equation 3.9 shows that the force field captures global structure. However since the effect on the field is proportional to 1 pixels far away will have very small contribution. The net effect is that regional structure is d 2 captured. The potential image is a scalar at each pixel and it is a measure of the brightness of that region. The force field is a vector at each pixel location. In this representation the potential and force values consist of nonlinear combinations of the remaining pixels in the image. Concretely, the wells are the local maxima of the potential image. The direction of the force field indicates the paths the wells take. The magnitude of the force field shows that the wells end up at locations of low force. The channels themselves follow paths perpendicular to the equipotential surfaces. It measures properties related to regional edge strength. It is not an edge detector, but it is related. The force field measures regional edge like structure in the image. The potential wells are those points in the force field where the net force is zero. 78
112 In order to clarify these concepts we show real images used in our data sets. Figures 3.18 and 3.19 show two real images with well positions overlaid on the potential, force, and real image. We further show channel lines superimposed and the direction field. One can verify that the wells are at the local maxima in the potential image traversing along paths according to the force field. Similarly in the force magnitude representation the wells settle in places of low force (i.e. zero force). This too makes sense as only when the test pixels reach locations of low force will they stop moving. To the extent that a potential image is affected, the local regions will also be affected. Further, the well movement is directly related to the potential and force. Some synthetic images will also help to clarify these concepts. Here we demonstrate the iterative process of traversing to the well points. Figure 3.20(a) shows the initial image. Figure 3.20(b) shows the initial configuration of the test pixels overlaid on the image. Figures 3.20(c)- 3.20(f)show the movement of the test pixels through the field after various numbers of iterations. The black lines indicate the path taken by the test pixels. Figure 3.20(g) shows the magnitude of the force field. Figures follow similarly. This gives good intuition into the force field representation. Finally we show the synthetic examples overlaid at various stages with the wells and channels in Figures The force field captures regional structure and we can model this regional structure over time to detect structural changes in the image. Though the hand and head have similar color and texture, by analyzing regional image structure we are able to capture structural changes that are introduced when the hand enters the scene. We can see that other methods monitoring pixel wise information are not enough because of the similar texture of the hand and head. When the hand enters, the 79
 is the original image.")
-(f) show the movement of the test pixels through the force field after 50, 100, 150, and 200 iterations. (g) shows the magnitude of the force field. local structure would not change (i.e. the pixel values remain largely the same), but there is useful regional structure variation (we will show examples of this change in subsequent sections).")
113 (a) Original Image (b) 0 iterations (c) 50 iterations (d) 100 iterations (e) 150 iterations (f) 200 iterations (g) Force Magnitude Figure 3.20: This is a synthetic image used to give some intuition of the force field representation. (a) is the original image. (b) is the original image with the initial configuration of test pixels overlaid on it. (c)-(f) show the movement of the test pixels through the force field after 50, 100, 150, and 200 iterations. (g) shows the magnitude of the force field. local structure would not change (i.e. the pixel values remain largely the same), but there is useful regional structure variation (we will show examples of this change in subsequent sections). We now detail how we model this changing force field over time. 80
 is the original image.")
 shows the magnitude of the force field. Section 3.")
114 (a) Original Image (b) 0 iterations (c) 50 iterations (d) 100 iterations (e) 150 iterations (f) 200 iterations (g) Force Magnitude Figure 3.21: This is a synthetic image used to give some intuition of the force field representation. (a) is the original image. (b) is the original image with the initial configuration of test pixels overlaid on it. (c)-(f) show the movement of the test pixels through the force field after 50, 100, 150, and 200 iterations. (g) shows the magnitude of the force field. Section 3.5 Developing New Image Feature The structure of these field lines for a particular image sequence are relatively constant until the hand (or anything else) enters the image. Once the hand enters a clear disturbance in the channels occurs in the region of occlusion. This hypothesis has been borne out in experiments on thousands 81

-(f) show the movement of the test pixels through the force field after 50, 100, 150, and 200 iterations.")
115 (a) Original Image (b) 0 iterations (c) 50 iterations (d) 100 iterations (e) 150 iterations (f) 200 iterations (g) Force Magnitude Figure 3.22: This is a synthetic image used to give some intuition of the force field representation. (a) is the original image. (b) is the original image with the initial configuration of test pixels overlaid on it. (c)-(f) show the movement of the test pixels through the force field after 50, 100, 150, and 200 iterations. (g) shows the magnitude of the force field. 82
116 (a) Original Image (b) 0 iterations (c) 50 iterations (d) 100 iterations (e) 150 iterations (f) 200 iterations (g) Force Magnitude Figure 3.23: This is a synthetic image used to give some intuition of the force field representation. (a) is the original image. (b) is the original image with the initial configuration of test pixels overlaid on it. (c)-(f) show the movement of the test pixels through the force field after 50, 100, 150, and 200 iterations. (g) shows the magnitude of the force field. 83
 is the original image.")
117 (a) Original Image (b) 0 iterations (c) 50 iterations (d) 100 iterations (e) 150 iterations (f) 200 iterations (g) Force Magnitude Figure 3.24: This is a synthetic image used to give some intuition of the force field representation. (a) is the original image. (b) is the original image with the initial configuration of test pixels overlaid on it. (c)-(f) show the movement of the test pixels through the force field after 50, 100, 150, and 200 iterations. (g) shows the magnitude of the force field. 84

 is original image, (b) is the potential image,")
 is potential image with channels")


118 (a) (b) (c) (d) (e) (f) (g) (h) (i) Figure 3.25: Synthetic example demonstrating concepts of image representation. (a) is original image, (b) is the potential image, (c) is the potential image with well points overlaid, (d) is potential image with channels overlaid, (e), (f), and (g) correspond similarly to the force magnitude image. (h) is the direction of the force field, while (i) is the original image overlaid with the channels and wells. The different colors of the channel lines is for display purposes only 85

 is original image, (b) is the potential image, (c) is the")
, (f), and (g) correspond")
 is the direction of the force field, while (i) is the")
119 (a) (b) (c) (d) (e) (f) (g) (h) (i) Figure 3.26: Synthetic example demonstrating concepts of image representation. (a) is original image, (b) is the potential image, (c) is the potential image with well points overlaid, (d) is potential image with channels overlaid, (e), (f), and (g) correspond similarly to the force magnitude image. (h) is the direction of the force field, while (i) is the original image overlaid with the channels and wells. The different colors of the channel lines is for display purposes only 86

 is original image, (b) is the potential image, (c) is the")
, (f), and (g) correspond")
 is the direction of the force field, while (i) is the")
120 (a) (b) (c) (d) (e) (f) (g) (h) (i) Figure 3.27: Synthetic example demonstrating concepts of image representation. (a) is original image, (b) is the potential image, (c) is the potential image with well points overlaid, (d) is potential image with channels overlaid, (e), (f), and (g) correspond similarly to the force magnitude image. (h) is the direction of the force field, while (i) is the original image overlaid with the channels and wells. The different colors of the channel lines is for display purposes only 87

 is original image, (b) is the potential image,")
 is potential image with channels")


121 (a) (b) (c) (d) (e) (f) (g) (h) (i) Figure 3.28: Synthetic example demonstrating concepts of image representation. (a) is original image, (b) is the potential image, (c) is the potential image with well points overlaid, (d) is potential image with channels overlaid, (e), (f), and (g) correspond similarly to the force magnitude image. (h) is the direction of the force field, while (i) is the original image overlaid with the channels and wells. The different colors of the channel lines is for display purposes only 88
 is original image, (b) is the potential image, (c) is the potential image with well points overlaid, (d) is potential image")
 is the direction of the force field, while (i) is the original image overlaid with the channels and wells.")
122 (a) (b) (c) (d) (e) (f) (g) (h) (i) Figure 3.29: Synthetic example demonstrating concepts of image representation. (a) is original image, (b) is the potential image, (c) is the potential image with well points overlaid, (d) is potential image with channels overlaid, (e), (f), and (g) correspond similarly to the force magnitude image. (h) is the direction of the force field, while (i) is the original image overlaid with the channels and wells. The different colors of the channel lines is for display purposes only 89

123 Figure 3.30: Channels before and during occlusion for images in the same input sequence as that shown in Figure Notice that a disturbance in the channels can be seen in the lower left corner of the image, whereas the rest of the channels in the the image are relatively stable. of video frames. It is consistent with the fact that the force field is a measure of regional image structure. Figure 3.30 shows an example of this phenomenon. It can be seen that most of the channels are stable before and during the occlusion. We could show many more examples of this phenomenon, but due to space limitations, we will show only one more instance in Figure We next demonstrate how to measure and quantify this changing force field. If test pixels are placed uniformly in each image we can measure the variation a certain test pixel exhibits in the distance it travels to a potential well. Since these distances remain relatively constant when there is no disturbance in the image (i.e. no hand/face occlusion), the distance that each test pixel travels can be modeled as a random variable with Gaussian distribution. When the hand enters, the wells and the distances that the test pixels travel will vary significantly. These will be the foreground channels, and they are somewhat analogous to foreground pixels in background subtraction. The reason this occurs is that when another object is introduced, it has its own set of channels and wells, however, when the two objects merge, the channels and wells of both objects interact 90

 This is the new distance traveled in a force field feature.")
124 Figure 3.31: Channels of test pixels for another image sequence. 250 iterations were used. Notice the large variation in the channels again in the lower left corner, where the hand enters. with one another. Although the hand and face are similar in color, the potential and force structure present in the image changes when another object enters the scene. Using the Mixture of Gaussian modeling technique we are able to measure and localize this change, which allows us to find the boundary between the face and the hand. The distance from a test pixel start location to its final well position can be measured by computing d = t j,0 t j,n (3.12) This is the new distance traveled in a force field feature. There are other choices for this distance measure such as computing the arc length. In any case, the distances these test pixels travel are relatively constant until the hand enters the facial region. We model the face before occlusion in terms of the distance traveled at each test pixel start location using a mixture of Gaussian. Let us assume that in the first video frame for a particular test pixel t j : t j,0 t j,n = X 0. In the next video frame for the same test pixel location we can compute t j,0 t j,n = X 1. Given the distance traveled history of a particular test pixel at location t j : X 0,X 1,...,X τ, we want to model 91
125 this density as a mixture of K Gaussians. The current distance traveled by t j, X τ, at time τ, has probability P(X τ ) = K i=1 (Xτ µ 1 i,τ ) 2σ w i,τ e i,τ 2 (3.13) 2πσi,τ of belonging to the current model. w i,τ is the weight of the i th Gaussian, and µ i,τ and σ i,τ are the mean and variance of the distribution all at time τ. If none of the Gaussian distributions match for this particular location t j, the least likely distribution is replaced by the new distance. The distribution s mean is the distance traveled by t j, t j,0 t j,n, with the weight of this distribution set low. At each time instant the weights of the K distributions are updated as w i,τ = (1 α)w i,τ 1 + α(m i,τ ) (3.14) with α set to a constant (learning rate) and M i,τ being an indicator function which is 1 for the distribution that matched and 0 otherwise. The distribution i that matched the current distance observation has its mean and variance updated as µ i,τ = (1 ρ)µ i,τ 1 + ρx τ (3.15) σ i,τ = (1 ρ)σ 2 i,τ 1 + ρ(x τ µ i,τ ) 2 (3.16) In our case ρ is set to a constant. For notational convenience we denote t ju as the mean of the distribution that matched for test pixel t j. Using this approach we are able to model the distances traveled by each test pixel in a coherent manner. The next task is to use these models to segment the hand from the face. One might object and say that we should simply find the zeros of the potential image and not track the distance to the wells. The problem with only having well information is 92
126 that simply because a well is closer to one test pixel does not mean this test pixel ended there. In order to determine which pixels are in the occluding region we need to have information regarding each test pixel and how it is changing relative to the well positions. Section Combining Multiple Zooms to Refine Update Rules Until this point not much has been said of multiple levels of details. As was shown in [SSV04] all heads and hands in the image can be automatically found. We use their approach to find these objects at all zoom levels. What this means is that we have the hand and head regions found in zoom 1 and zoom 2. Usually, zoom 3 only has the head region. Whenever the hand comes into zoom 3, we stop updating all models that do not match any of the distributions. To determine when the hand has come into zoom 3, zoom 2 looks at its head and hand bounding boxes. Whenever a hand bounding box intersects a head bounding box, zoom 2, notifies zoom 3 to stop updating its model parameters. Specifically we do not replace the lowest match distribution with the new distance parameters. If a particular location r start, does match one of its K distributions then its model parameters are still updated according to Equation This has the effect that once the hand enters zoom 3, the affected test pixels distributions are fixed so that these new distances are not learned. Proceeding in this manner will prevent the hand from being merged into the background. Without this multizoom update rule, the modified background subtraction would fail to segment the hand as the channel disturbances would be learned and incorporated into the background model. It might not always be possible to have multiple cameras (zoom levels). Next we present a simple method that can determine if the hand has entered using only one camera. 93
127 Section Extracting the Hand There are two steps needed to extract the hand. We must first identify whether or not the frame has a hand in it. A good measure is when the maximally changing test pixel s distance from its distribution is much larger than its change in the previous frame. This indicates a large change in the image. Concretely, we say the hand has entered when t lµ X τ > 3 (t lµ 1 X τ 1 ), (3.17) where l = argmax l t lµ X τ, (3.18) t lµ is the mean of the distribution for t l, and X τ is the current distance traveled observation (computed as t l,0 t l,n for t l. t lµ 1 and X τ 1 are the mean of the distribution and observation for t l at the previous input frame. The 3 in Equation 3.17 is essentially saying that the new observation s distance from the distribution should be more than three standard deviations before the systems declares that a hand has entered. The goal is to find the set H which is all the hand pixels. Initially set H t l,x, x 1 x N. This only gives one t i and corresponding channel, which is not a complete segmentation. To get the full hand, any test pixel which ended up at the same well is also assumed to be part of the hand. Further, any test pixel whose well is within β pixels is assumed to be part of the hand. Concretely, set H H + t a,x, a,x t l,n t a,n β, 1 x N (3.19) 94
128 There are a few scenarios that will make the above method fail, such as large illumination changes. Another scenario would be if the person left the scene. In this case the deviation from the model would be high. If these situations need to be handled we can introduce a higher level analysis and only conclude that a hand has entered when the higher level process so determines. These test pixels and corresponding channels taken together segment the hand region. Once the hand region enters the head region, the distances the test pixels travel will start to vary greatly. Since we do not want to learn this variation, the models are not updated after the hand enters the facial region. One could also simply decrease the learning parameter, α, to obtain a similar effect. If it is desired to accumulate objects more quickly into the background, this behavior can easily be accomplished by increasing the learning parameter, α. Figure 3.32 shows a few frames of the raw channel lines found by our method. The final segmentation is achieved by finding the convex hull of this point set H and drawing the hull (unfilled). Other methods could be used to improve the resulting contour. The full algorithm is given in Table 3.1. Detailed results are presented in Section 3.6. Section 3.6 Results Our method was tested on 14 sequences involving hand/face occlusion for a total of 1800 frames. Not all of these frames contained hand over face occlusion. Of course the non-occlusion frames were needed in order to build the online distance models. Out of the 1800 frames, roughly one half contained hand over face occlusion. The method was successful under a variety of lighting 95


129 Table 3.1: Overall Algorithm For every frame 1. Compute force at every pixel using Equation Place test pixels t i uniformly; and t i compute Equations 3.10 and t i Use Equations to update online MoG models 4. Check for hand using Equations 3.17 and If hand present, segment using Equation 3.19, find convex hull and display result 6. Goto Step 1 Figure 3.32: The hand region is shown with the channel lines superimposed on it. These channel lines are the ones that varied most from the previous location s model. A convex hull algorithm could be used to fill in this hand region. 96
130 conditions. Further we tested the method on 5 subjects with a variety of hand pose configurations. Figures 3.33 and 3.34 show results of the hand segmentation on different input sequences. We should note that in Figure 3.33 the head starts out frontal and then rotates to a half-profile position. Our method is able to cope with rotation to half-profile, after which the model starts to break down. We assume that the hand is initially not present (which allows us to build the model). In order to allow translational invariance and to have faster processing, we find the head region using [VJ01] and only process these regions. During occlusion the head might not be detected thus we hypothesize the head region using its most recent position to continue using the model. If one is interested in handling these situations, tracking information could be used for the composite head/hand region. We show additional results in other contexts in Section 3.7 operating on full images. We model every 5 th pixel in both directions for faster computation. More samples would improve segmentation and contour accuracy. Again to obtain the results we run a convex hull algorithm on the set H, described in Section 3.5.2, and show the hull (unfilled). Notice that in the second image of Figure 3.34 an over-segmentation occurs. Since our process models regional structure, it occasionally happens that some additional region near the occluding region is segmented with the foreground object. The algorithm was always able to determine when the hand entered the image using the steps in Section Next we show a visual comparison between our proposed method, background subtraction [SG00b], mean shift segmentation [CM02], and mean shift tracking [CRM00] respectively. Figure 3.35 shows four images from a typical input sequence we used. Results using the proposed force field approach are shown in Figure Figures 3.37, 3.38, and 3.39 show results for 97
131 background subtraction [SG00b], mean shift segmentation, and mean shift tracking [CM02] respectively for the same frames shown in Figures 3.35 and Our method and [SG00b] both give pixel wise segmentation, so comparison was straightforward and unambiguous. Further, we felt it would be interesting to compare against general methods because our approach does not use hand color/shape to improve its decision, meaning it could possibly be applied in other contexts. Neither of these two other methods were successful in segmenting the hand from the face. Additional results are shown in Figures These were typical results obtained by our segmentation algorithm. In Figures 3.40 and 3.43 the channels lines are superimposed on the segmented hand region, which gives some insight into which channels are in H and how the convex hull algorithm works. Figure 3.43 shows a sequence that had occlusion lasting for over 250 frames. Even in these cases the segmentation remained correct. The algorithm was always able to determine when the hand(s) entered the image using the steps presented in Section In order to quantify how well the algorithm performed we manually generated ground truth segmentations for two sequences. Comparisons of our method to the ground truth and background subtraction [SG00b] are presented in Table 3.2. Comparison was made pixel wise. For our method each pixel in the convex hull was counted as hand and each pixel outside was counted as nonhand. The true positive percentages for every frame were added and divided by the total number of frames. A similar method was used to determine the true negative rate. Our method outperformed [SG00b] in all cases. While [SG00b] segmented part of the hand, it found much of the head region as hand, indicated by the low true negative rate. 98


![True Negative [SG00b] True %](/docs-images/91/104511516/images/132-4.jpg "Positive % % Negative % 1 44")


132 Table 3.2: This table shows the true positive and true negative segmentation rates for the specified sequences. Seq # # Our Method Method in Our Method Method in Frames True Positive [SG00b] True True Negative [SG00b] True % Positive % % Negative % Figure 3.33: Hand Segmentation Results. This was a challenging sequence due to the large rotation of the face. 99


133 Figure 3.34: Results of hand segmentation algorithm. Figure 3.35: Example images used for the comparison between our proposed hand segmentation algorithm, background subtraction, and mean shift segmentation. These figures are some of the input frames from the output sequence shown in Figure Figure 3.36: Hand Segmentation Algorithm results for the input images in Figure The hand region is shown with the channel lines superimposed on it. These channel lines are the ones that varied most from the previous location s model. This case was particularly interesting because of the eyeglasses on the face. 100


![region (found using [VJ01]).](/docs-images/91/104511516/images/134-2.jpg "It would be very difficult to extract the hand from these foreground")


134 Figure 3.37: Background subtraction results for the sequence in Figure The first row shows background subtraction of the whole image, and the second row shows background subtraction of only the extracted head region (found using [VJ01]). It would be very difficult to extract the hand from these foreground regions. Figure 3.38: Mean shift segmentation results on the sequence in Figure Here oversegmentation occurs and region merging in order to correctly segment the hand would prove difficult. Figure 3.39: Mean shift tracking results on the sequence in Figure Here the main difficulty is in manual initialization and after prolonged hand/face occlusion the tracker starts to drift. 101


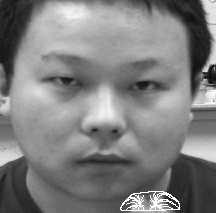

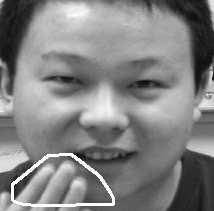


135 Figure 3.40: Hand segmentation with channel lines superimposed. Figure 3.41: Results of hand segmentation algorithm. 102


136 Figure 3.42: Results of hand segmentation algorithm. Figure 3.43: Hand Segmentation results on prolonged occlusion. Frames 55, 70, 120, 140, 250, and 340 are shown. The hand is leaving face in final frame. 103

137 Figure 3.44: Occlusion involving two hands. In this sequence the algorithm correctly finds the boundary for one of the hands. However because our algorithm looks for only the one well that changes most, it misses the second hand. We have tested the algorithm on one sequence involving both hands simultaneously occluding the face. This is a particularly challenging case. Figure 3.44 shows the output. The maximum changing well and associated channels (Section 3.5.2) occur on the right side of the image, so it misses the second hand. However, by allowing more of the maximally changing wells and associated field lines, the second hand can be segmented. Hand segmentation using this modified approach are shown in Figure Because there are so many changes occurring in the force field with two hands, there are some spurious regions marked as hand regions. The hand extraction algorithm could be modified to give more weight to the wells that had the largest percentage of incoming channels. This would help reduce the effect of the extra wells seen in the top row of Figure We could also compute the number of channels per unit area and give higher confidence to channel regions that were more uniform. 104

138 Figure 3.45: Occlusion involving two hands. In this sequence the algorithm correctly finds the boundary in the initial frames of the occlusion. Though there are some segmentation problems later in the sequence. Section 3.7 Application to Other Domains Though we have chosen as the target problem segmenting the hand from the face, there is nothing inherently that limits the method from only working for heads and hands. Here we report results we have obtained in other contexts and show that the method is general and has potential to handle a wide variety of occlusion problems involving similarly colored objects. The first row in Figure 3.46 shows a white box moving across a white wall. The next two rows in Figure 3.46 show two separate sequences involving newspapers occluding each other. This would present many challenges for most trakcing/segmentaion algorithms because both objects have such similar color and texture. In addition to the top newspaper moving, the newspaper being occluded is also moving slightly, which would present additional difficulties for background subtraction. The final row in Figure 3.46 shows an irregularly shaped brown bag occluding a brown door behind it. Figures 3.47 and 3.48 show these same frames segmented using background subtraction and mean shift segmentation, respectively. All these cases would cause most tracking or segmentation methods 105


139 to fail, yet using the regional structure of the image and modeling this structure over time, we are able to resolve the occlusion problem. We could make improvements to our method to get more precise boundaries, though we simply wanted to show the utility of the method for other contexts. Figure 3.46: Results from our method for occlusion involving other types of similarly colored objects. Section 3.8 Conclusions We have laid out in detail four of the features that could be used in a boosting framework. They have been verified to work at an acceptable level. In Chapter 4 we present a machine learning 106
140 Table 3.3: Subset of Hand to Face Actions. This table makes use of the terminology presented in Figure 3.1. Location in Feature Space Action Zoom Levels Needed use phone low, mid, high scratch chin low, mid, high scratch ear low, mid, high cup to mouth low, mid, high fork to face low, mid, high talking low, mid, high rub eye low, mid, high rub both eyes low, mid, high hand to Region 2,4, with object, long duration hand to Region 3, without object, short duration hand to Region 2,4, without object, short duration hand to Region 6, with object, medium duration hand to Region 6, with object, short duration Region 6 motion, variable duration hand to Region 5, without object, long duration both hands to Region 5, without object, long duration put on glasses low, mid, high both hands to Region 5, with object, short duration 107


141 Figure 3.47: Results from background subtraction for occlusion involving other types of similarly colored objects. framework which is able to combine many features to perform activity recognition. Further in Chapter 4 we give more details into different features that we use for boosted learning. 108


142 Figure 3.48: Results from mean shift segmentation for occlusion involving other types of similarly colored objects. 109


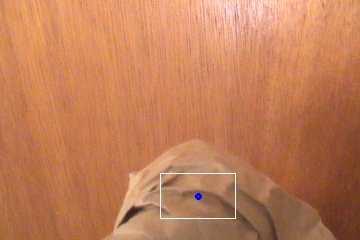

143 Figure 3.49: Results from mean shift tracking for occlusion involving other types of similarly colored objects. 110
144 CHAPTER 4 TEMPORALBOOST LEARNING We now give details on our new machine learning paradigm, TemporalBoost, and show an application of detecting events in an office environment. The system recognizes 11 events with good accuracy. The target actions to be recognized are listed in Table 4.1. A visual sample of each action is given in Figure 4.1. Many of the events we recognize are similar which makes the problem quite challenging. For instance, medication, drinking, and yawning with hand are all very similar. The rest of Chapter 4 is organized as follows: The machine learning algorithm is presented in Section 4.1; Details on the features used are presented in Sections ; Results are presented in Section 4.8; and finally we conclude. Figure 4.2 presents a high level overview of the entire learning and recognition process. Section 4.1 TemporalBoost Learning Figures give an algorithmic overview of TemporalBoost Learning. Each figure represents a classifier for each event. Each event has a separate classifier. Thus in total we have eleven such classifiers as seen in the figures. We describe in detail Figure 4.3. A similar explanation holds 111
145 Table 4.1: Actions recognized by system ID a 1 a 2 a 3 a 4 a 5 a 6 a 7 a 8 a 9 a 10 a 11 Name Talking on phone Checking voic on phone Bringing cup to face Scratching/Rubbing face Resting hand on face Taking medication Yawning with hand at mouth Yawning with no hand at mouth Putting on eyeglasses Putting on earphones Rubbing eyes 112


146 Figure 4.1: Visual Sample of Target Actions. They are shown in the same order as they are listed in Table 4.1. From left to right and top to bottom. The five figures in the lower row right corner show some non-action events. 113

147 Figure 4.2: Overview of the entire machine learning and recognition process. for the other classifiers. Input video frames are input into the video classifier. Each video frame goes to a separate strong classifier. Each strong classifier is comprised of many weak classifiers, shown as blue boxes. We show six boxes, but this is general for any number of features. Each weak classifier itself uses a sliding window of automatically determined size n. Each of the strong classifiers then makes a frame wise decision. The strong classifier decisions can be thought of as representing different stages of an event. The strong classifier decisions are then fed into another layer of boosting. This layer is responsible for detecting actions of varying length. It is strictly speaking an optimization process, but it can be thought of as a second level of boosting. Event detection then proceeds throughout the video. 114
148 Discover Temporal Dependence Classifier Decisions Input Frames Video Classifier A Frame 1... Frame 1 Frame 2 Frame 3 Temporal Dependence Frame 2 Learn Event Variation Final Decision Feature A Feature A... Temporal Dependence Frame 3 Feature A.... Input Video Stream d 1 Figure 4.3: This figure presents a visual overview of the TemporalBoost learning paradigm for event class A. 115
149 Discover Temporal Dependence Classifier Decisions Input Frames Video Classifier B Frame 1... Frame 1 Frame 2 Frame 3 Temporal Dependence Frame 2 Learn Event Variation Final Decision Feature A Feature A... Temporal Dependence Frame 3 Feature A.... Input Video Stream d 1 Figure 4.4: This figure presents a visual overview of the TemporalBoost learning paradigm for event class B. 116
150 Discover Temporal Dependence Classifier Decisions Input Frames Video Classifier C Frame 1... Frame 1 Frame 2 Frame 3 Temporal Dependence Frame 2 Learn Event Variation Final Decision Feature A Feature A... Temporal Dependence Frame 3 Feature A.... Input Video Stream d 1 Figure 4.5: This figure presents a visual overview of the TemporalBoost learning paradigm for event class C. 117
151 In the TemporalBoost procedure, when choosing the best weak classifier for a given stage we modify the boosting process to allow the weak classifier to use its previous classifier responses (previous frames in the temporal sense) if it helps decrease the overall error for this classifier. There are many ways to use previous weak classifier response data. We consider perhaps the two simplest. These allow a weak classifier to respond positively for the current frame if 1) any of the previous t frames were classified as being of the positive class (OR operation) or 2) if all of the previous t frames were classified as being of the positive class (AND operation). Case 1 will allow more true positives at the expense of possibly allowing false positives. Case 2 will reduce false positives at the expense of possibly reducing true positives. Other functions could be considered. For intuition, suppose a feature classifies an action correctly in the previous n frames, but misclassifies the action in the current frame. TemporalBoost allows this feature to classify the current frame correctly based on the fact that the previous n frames classified the action correctly if the overall error was decreased. n is learned automatically; if n = 0 it means previous temporal information did not help this feature. We refer to this step as the DiscoverTemporalDependence step. It has a twofold effect. First it automatically allows for different features to respond in different ways to the input, allowing each feature to use as much temporal information as it can while minimizing its error for the current boosting iteration. Second, it allows temporal smoothing to be embedded in the boosting process. Our search is influenced by the current weights and is different than giving all features temporal scale. 118
152 Video events happen over multiple frames, but the standard boosting framework makes a decision as to whether an event is happening in every frame. Our second algorithmic extension to AdaBoost, provides the necessary extensions to learn the allowable variation in action length while keeping the false positive rate as low as possible. Suppose that the yawning event is occurring but for the first x frames of the event, both the yawning and medication classifiers respond that their event is occurring (or only the medication classifier in the multiclass case). Suppose after x + δ frames only the yawning classifier responds. Suppose that when the medication event does happen the medication classifier responds for y x frames. We encountered this phenomenon frequently in training. If we require that the medication classifier responds for at least y frames, it would prevent the same action from being recognized if it were performed faster in the testing data. Further, if we allow the medication classifier to respond after x frames we would get many false positives. Instead the minimum number of frames needed to achieve high true positive and high true negative rates should be used. This learning process occurs after the classifiers are built. We refer to this step as the LearnEventVariation step. The full algorithm is in Table 4.4. The algorithm in Table 4.4 is the one-against-all algorithm. Given a target action (class), a, the algorithm will learn a strong classifier that can recognize the action. A separate classifier for each target action is built. By using multiple one-against-all classifiers two events occurring simultaneously can be recognized, which is not possible in a single multiclass classifier. Nonetheless, the method has been implemented and tested on both the one-against-all and the multiclass training approach. Similar results were obtained in both cases. Due to space limitations we leave out the adaptations to AdaBoost.M1. 119
153 Table 4.2: TemporalBoost Learning Algorithm For a given class a: 1. Given labeled video data (x a 1, ya 1, za 1 ),..., (xa n, y a n, z a n): x a i represents one video frame. Its label is y a i = 0, 1. z a i is the unique video sequence index. The za i label allows multiple training videos to be concatenated and trained together. All frames from the same video have the same sequence index. (a) Build the set Ω a for the a th event category by collecting the contiguously labeled frames as events to obtain the start and end of each event in the video (b) Each ω Ω a has ω s and ω e indicating the starting and ending frames for this event. 2. Set w a i,1 = 1 2m a, 1 2l a for y a i =0,1 where ma, l a are the number of negatives and positives respectively. 3. i Set h a,t i = 0. In this notation h i is the weak classifier that corresponds to f i, h a i indicates this classifier is for action a, and h a,t i zero. indicates the temporal extent of the feature, which is initialized to 4. For s = 1,...,S : (a) Normalize weights w a i,s wa i,s n j=1 wa j,s DiscoverTemporalDependence (Steps 4b-4e) (b) For each feature, j, train a classifier h a j which is restricted to using a single feature. ǫ a j = min ( i w a i 1 h a,t j + 1 j h a j(x a i k [z i =z i k ] ) yi a, h a,t ) wi a 1 j i h a,t h a j(x a i k [z j + 1 i =z i k ] ) yi a k=0 h a,t k=0 120
154 Table 4.3: TemporalBoost Learning Algorithm 1. set ǫ a prev ǫ a j 2. while ǫ a prev ǫ a j (a) ǫ a prev ǫ a j, h a,t j h a,t j + 1 (b) ǫ a j = min ( i w a i 1 h a,t j + 1 j h a j(x a i k [z i =z i k ]) ya i, h a,t wi a 1 j ) h a,t h a j(x a i k [z j + 1 i =z i k ]) yi a h a,t k=0 i k=0 (c) if ǫ a prev ǫ a j goto step 4.d (d) else ǫ a j ǫ a prev, h a,t j h a,t j 1 goto step 4.e 3. Choose the classifier, h a s with the lowest error ǫ a s 4. Update weights w a i,t+1 = w a i,tβ (1 ea i ),a s where e a i = 0 if example x a i is classified correctly, e a i = 1 otherwise, and β a s = ǫa s 1 ǫ a s 1 1. The final strong classifier is h a (x) = S s=1 αa sφ a s( 1 h a,t s +1 0 otherwise h a,t s k=0 ha s(x a i k )) 1 2 S s=1 αa s where α a s = log 1 β a s and Φ a s(x) is evaluated either as x or x depending on whichever resulted in the lower error term ǫ a s for the correspondingly selected weak classifier during stage s. 121
155 LearnEventVariation (Steps 6a-6b): Table 4.4: TemporalBoost Learning Algorithm 1. After the strong classifier has been built, for action a. (a) Run the strong classifier over the training data to obtain the candidate labeling. We refer to this set of candidate activities as Ω a. By grouping contiguously labeled frames then each ω Ω a has ω s and ω e indicating the starting and ending frames for this event. (b) compute argmin k error a (k) where error a (k) = ω Ωa[ω e ω s > k] Ψ(ω,ω) [x] is a true/false predicate that evaluates to 1 or 0, respectively and 1 ω s ω s ω e ω s ω e ω e ω s ω s ω e Ψ(ω,ω) = 1 otherwise 122
156 For clarity, let us point out that in steps 4.b and 4.d the term [z i = z i k ] is a 1/0 binary predicate that avoids temporal coherence being exploited across boundaries of training videos. Once the optimal k is found for action a in step 6, detection and localization of this action in video is straightforward. We emphasize that each action a can have a different optimal temporal extent k. The action starts when the action is present for k frames and ends when this contiguous detection ends. By keeping the final decision rule simple it allows us to focus on the lower level task of activity detection rather than on how to combine frame responses, which is a higher level task needed at the semantic level. Of course in individual frames multiple classifiers can respond positively, but in order for our method to declare an event is occurring, the classifier for action a has to fire for k frames. Rarely do two classifiers fire in the same time frame. It is handled by taking the action with the maximum classifier response. Section 4.2 Guide to Building Features Our features were selected by first intuitively determining what constituted each event. For instance, event a 3 requires a hand to come to the face, with an object, and bring the object to the mouth region. Further the mouth might open as the event is taking place. From this high level analysis for each action we then built features that specialized in responding positively for each of these sub tasks. These features compute higher level semantics. Generally, all the features compute one of the following: 1) Determining if an object is in the hand, 2) Determining where on the face an action is occurring (i.e., a phone would go to the ear region, whereas a cup would go to the mouth region), 3) Determining how many hands are involved in the action, 4)Determining 123


157 Figure 4.6: Examples of the usual Haar features and variations if the face is moving, 5) Determining if the mouth is opening. These 5 higher level semantics are referred to in Table 4.5 under the heading Purpose. The standard Haar features are shown in Figure 4.6 in order to illustrate the differences between our features and the usual features. The whole idea behind boosting is that we can feed it numerous weak classifiers and AdaBoost will select those that are best. Some of our features might seem inappropriate, but AdaBoost itself will discover which features are relevant and which are not. There is no harm in giving AdaBoost an overabundance of weak classifiers. It is with this philosophy that we designed our features. This is compatible with the original AdaBoost proposal [FS97]. Most boosting approaches normalize size of the training images so that the whole training image contains only the object to be detected (for a positive example). This allows features to operate directly on the pixel data. In videos it is unclear how to perform such normalization since different parts of the image are needed simultaneously. This has prevented us from using such Haar-like features. We now explain how to compute the features. The feature computation summary is presented in Table 4.5. We give the feature ID in Column 1. Column 2 gives the purpose of this feature. Column 3 contains a high level description of the feature. Column 4 gives the steps to compute each feature. α and β are size constraints. These values are not hard coded because we will have multiple features with varying values for α and β. 124
158 In this way AdaBoost itself can select which values of α and β work best. Since this table is quite concise we give more details in subsequent sections on how to compute some of these features so that the reader will have a better idea of the feature computation process. Section 4.3 EM Trajectory Fitting We first give a few examples of features that were not selected in the final boosting process. The trajectory fitting feature is one such feature. The EM trajectory fitting feature operates with the following intuition. When the user brings his hand to face with an object he will need to reach for the object. Since we have the tracking data of the hands, we can record the centroid location of the hand in time. For every sequence of N frames two lines can be fit to the data. This reaching motion can be broken down into two parts: reaching for the object and bringing it to the face. Each part corresponds to one roughly constant slope line segment. By fitting two lines to these centroid points we can plot the angle between the two lines over time. Figure 4.7 shows a few sample images from the sequence where the pen is brought to the face. Frames and are shown for both zoom 1 and zoom 3. The plot of this feature over time is given in Figure 4.8. One can see how the angle between the lines goes up after the object is picked up (frame 00297). Before the object is picked up, the angle is very small. As with all our features we do not say that this is always the case. But if the boosting process determines that this feature can separate the positive from the negative class it will be chosen. 125
159 Table 4.5: Description of all features and how to compute them. Col. 1 is the Feature ID. Col. 2 is the purpose of this feature. The purpose values are described in the first paragraph of Section 4.2. Col. 3 gives a short description of what the feature is computing. Col. 4 gives details on how to compute the feature.[x] is a 1/0 binary predicate. Computational Steps Required ID Purpose What Feature is Computing h 1 1 Spatial artifact agreement Computed above h 2 1 Relative size agreement S(B i,1 ) S(B j,2 ) + S(B i,1 ) S(B k,3 ) + S(B i,2 ) S(B j,3 ) h 3 1 Absolute size agreement i (S(B l,i) > α) (S(B l,i ) < β h 4 1 Artifact distance to face Distance from each artifact centroid to the face h 5 1,2 Number edges in region R Count number of edges in R h 6 2 Percent hand head overlap (area of intersection)/(area of head bounding box) h 7 1,2,4,5 Number moving pixels in x R [I(x) I (x) > α 0 ] R h 8 1,2 Number moving pixels in x R [I(x) I (x) > α 0 ] [RGB(x) C] R of specified color, C h 9 3 Distance hand to head e d 2σ 2, where d is the distance between the head and hand h 10 3 Distance both hands to e d 1 +d 2 2σ 2 where d 1, d 2 are the distance between each hand and the head h 11 h 13 head 2 Percentage overlap sides of face computes what percentage the hand overlaps each side of the face Count the number of unique segments that occur in the given region x R [RGB(x) C] x R (I(x) < α 1) h 14 1 Number Mean Shift Segments in R h 15 1 Number pixels with color C in R h 16 5 Number dark pixels in region R h 17 4 SSD Based Head Motion Performing an SSD match on the found head region h 18 4 Global flow head motion Measure global flow estimate of head region. 126


160 Figure 4.7: Sequence showing user grabbing pen in zoom 1. Note that in zoom 3 there is no way to determine if the hand is reaching for an object. Samples points are shown in Figure 4.9a with the corresponding fitted lines overlaid in 4.9b. In this case an object was picked up before being brought to the face. In the case of Figure 4.10 the hand is brought to the face without picking up an object. Observe the difference in angle between two the fitted lines. Section 4.4 Artifact Features These features look for artifacts in the background subtraction process of the lower zooms to determine if an object was recently brought to the face. If an object was recently brought to the face then the artifact will appear in the background image. This information is overall scene context information that is not available in zoom 3. The artifact features require previous frame history. They operate by considering an N frame sliding window and finding the artifacts that meet certain criteria. 127
161 60 EMA txt 40 Angle Frame Figure 4.8: Plot of the angle between the two line segments with parameters computed using the EM algorithm. Example of EM Line Fitting 115 TestPoints1.txt Example of EM Line Fitting TestPoints1.txt -.507*x *x (a) (b) Figure 4.9: EM Trajectory Line Fitting. In this case the person picks something up with his hand before bringing it to the face. Notice the substantial angle between the two lines. 128
162 Example of EM Line Fitting 115 TestPoints2.txt Example of EM Line Fitting TestPoints2.txt -.492*x *x (a) (b) Figure 4.10: EM Trajectory Line Fitting. In this case the hand is brought to the face without picking up an object. In this case the angle between the lines is seen to be small. The artifact features correspond to features h 1 -h 3. They were not selected in training. We describe them to show the kinds of feature that were not selected. We use 1)difference pictures 2)[SG00b], and 3) [EHD00] to acquire foreground images D 1, D 2, and D 3. For simplicity let us consider one particular zoom (or camera) C a. Connected components are (B 1,1,B 2,1,...,B N1,1), (B 1,2,B 2,2,...,B N2,2), and (B 1,3,B 2,3,...,B N3,3) for D 1, D 2, and D 3. For each triple B i,1,b j,2,b k,3 compute the corresponding centroids [x 1 y 1 ] T, [x 2 y 2 ] T, [x 3 y 3 ] T. Size of each is S(B i,j ). The spatial agreement among artifacts measures the spatial distance between each centroid of each method. The lower the score the higher the agreement between the three methods. h 1 : The spatial agreement is computed as e = ( [x 1 y 1 ] T [x 2 y 2 ] T + [x 1 y 1 ] T [x 3 y 3 ] T + [x 2 y 2 ] T [x 3 y 3 ] T )/3 (4.1) 129
![Figure 4.11: Artifact feature. This figure shows two example frames with one particular method of background subtraction [EHD00]. Other methods are also used as explained in this section.](/docs-images/91/104511516/images/163-1.jpg "The artifacts used in the computations are all connected components.")
163 Figure 4.11: Artifact feature. This figure shows two example frames with one particular method of background subtraction [EHD00]. Other methods are also used as explained in this section. The artifacts used in the computations are all connected components. The absolute size agreement considers all triples of artifacts using all methods and returns the number of methods that returned an artifact that is reasonably sized. The relative size agreement feature measures the relative size similarity between all triples of artifacts. This score for each method/centroid is recorded for every frame. Now when artifacts are observed in zoom 1, there will be a delay between the time the action occurs. Thus an N frame sliding window needs to be used to look for the smallest error for this feature. Figure 4.11 shows two sample frames and the corresponding background subtraction in [EHD00]. Multiple background subtraction methods run in parallel and statistics on the artifacts are computed. 130
 The foreground pixels are assumed to be the moving pixels and they are counted on a frame by frame basis in various spatial regions. (b) The moving pixels are those above a certain threshold.")
164 (a) Background subtraction motion detection (b) Difference picture motion detection Figure 4.12: Motion Features. (a) The foreground pixels are assumed to be the moving pixels and they are counted on a frame by frame basis in various spatial regions. (b) The moving pixels are those above a certain threshold. This threshold could be learned by having different variation of the feature with different thresholds. Section 4.5 Motion Features Here we show visual descriptions of several motion features. Figure 4.12 shows background subtraction based and difference picture based motion computations. The features simply count the number of moving, or foreground, pixels. Figures 4.13 and 4.14 are computed by measuring the frame to frame head motion using an SSD template and affine transformation respectively. In this case the features are the motion of the head, in pixel units. 131
165 SSD Figure 4.13: SSD based motion feature. Affine Figure 4.14: Affine based motion feature. 132
166 Section 4.6 Single Frame Features Single frame features are most closely related to the features found in [VJ01]. However they are still quite a bit different. Some of the features are listed below. 1. Distance from hand to head 2. Percentage overlap of head and hand bounding boxes 3. Number of non-skin pixels in a particular region 4. Number of moving non-skin pixels in a particular region 5. Number of moving pixels in a particular region 6. Number of mean shift segments in a particular region 7. Number of edges detected in a particular region They are too numerous to describe the computation of each one, but we describe a subset of them to give an idea of how they are computed. The distance from hand to head is relatively straightforward. In any given frame (in zoom 1 or zoom 2), the distance between the head and hand is computed. The probability of an event can be represented as e distance 2σ. A higher value indicates more confidence in a hand to head event. Another feature is counting the number of moving non-skin pixels in a certain region. The rationale is that moving non-skin pixels in the facial region might be an object. Using the previously built color model of the face allows us to determine non-skin pixels. 133


167 Figure 4.15: First row: Sequence showing person drinking from a mug. Second row: Mean shift segmentation performed on the above three frames. The idea of this feature is to count the number of segments in each given region. Here the region is the whole image. A higher level feature we compute is counting the number of mean shift segments in a particular region per frame. The idea is that when there is an object in the hand this number will go up to account for the new object near the face. To compute this we first perform mean shift segmentation on the image. Then we look in a certain image region (perhaps the whole image) and count the number of segments that occur. This is one of the more useful features (Adaboost selected it as the most discriminative feature in our small training set). In Figure 4.15 three input frames and the corresponding mean shift segmentations are shown. Frames 02854, 02897, and are shown. The plot over time of the mean shift segments in this image is shown in Figure One can see how when the object comes into view (approximately frame 02990) the number of mean shift segments spikes up. Another feature computed is the number of edges in a particular region of the image. When an object is being brought to the face there will be additional edges introduced. The frame wise 134
168 140 MGPNW2.txt Figure 4.16: Plot of the number of mean shift segments in the images of Figure The jump in mean shift segments occurs around frame 2897, when the object is near the face. features can be evaluated at any zoom and they can be evaluated at any region. Since we know the head and hand regions they can be evaluated at all these scales and regions. This gives a large number of features from which Adaboost can select the features that best separate the positive from the negative data. In order to provide more insight into the feature computation we show visually the interpretation of several of the features in Figures 4.17, 4.18, and Section 4.7 Visual Inspection of Feature Responses In Chapter 3 and in this chapter we introduced a number of features to detect activities. Here we look at some of the features in more detail to determine how well they distinguish between actions. Figure 4.20 shows frames from a particular training sequence. The frames are shown in chronological order from left to right and top to bottom. Frames 00235, 00435, 00545, 00745, 135

 shows how to compute the spatial overlap between the hand and face.")
 shows the edge features.")
 Mean shift segments (b) Dark pixels (c) Skin color segmentation Figure 4.")

169 (a) Distance features (b) Spatial Overlap (c) Number edges Figure 4.17: Geometric Statistical Features. (a) shows multiple features which measure the distance between the each hand and different parts of the face. (b) shows how to compute the spatial overlap between the hand and face. This is computed as the ratio of overlap area to the area of the smaller object. (c) shows the edge features. The number of edges is counted in various spatial regions, such as the head, full image, etc. (a) Mean shift segments (b) Dark pixels (c) Skin color segmentation Figure 4.18: Global Features. (a) shows the mean shift segmentation. The number of segments is counted in various spatial regions. (b) shows the dark pixels in the image. The number of dark pixels is counted in every frame. (c) Skin color is learned online from the head detection. The skin color pixels are then counted in various spatial regions. 136

170 Figure 4.19: Number segments feature with arrows corresponding to the frames in video. This shows what the feature computation step consists in , 01245, 01445, 01945, 02045, 02140, 02305, 02345, 02445, 02845, 02945, 02969, 03130, 03150, are shown. We list the frame numbers so that the feature responses shown below are meaningful. Figures show a few of the feature responses for the image sequence shown in Figure By comparing the feature responses with the given frames one can roughly see how well the individual features perform. In training the features, each weak learner must determine the optimal threshold (decision boundary) such that the minimum number of examples are misclassified [VJ01]. Each feature has a linear decision boundary computed as: 1 if p j f j < p j θ j h j (x) = 0 otherwise 137

171 Figure 4.20: Example of images from the training sequence. The frames go from left to right and top to bottom. The whole sequence is over 3000 frames long. 138
172 where h j (x) is the weak classifier which is comprised of a feature f j and a threshold θ j, determined automatically by the Adaboost learning framework. The direction of the inequality is determined by the parity p j. However by only minimizing the total number of errors, the threshold can be overly influenced by whichever set (positive or negative examples) has more elements. In order to avoid this problem we have developed a better decision boundary function in which the normalized similarity is maximized CorrectNegative + CorrectPositive TotalNegative TotalPositive. This gives both the positive and negative sets equal chance to contribute to the decision boundary. The above procedure is roughly equivalent to drawing a horizontal line at the value that classifies the highest number of training examples correctly. There is often a tendency to make the decision boundary a more complex function, but this increases the chances of overtraining. We have kept the decision boundaries simple to avoid overtraining. After the thresholds for each feature are chosen the Adaboost classifier training can begin. One problem encountered was how to convert the features into activity features. Adaboost must have labels to train with, and the features must be designed to answer yes or no for whatever class is being recognized. Our features were designed for answering questions about a specific sub-action. For instance many of the described temporal features determine whether an object is in the hand or not. Determining whether there is an object in the hand is not an action in itself. To correct this, the features must give an answer as to whether the given class is occurring. In the case of the object in hand temporal features, they would answer yes for events like phone to face or cup to face, but would answer no to actions like scratching face or resting hand of face. Adaboost requires a large number of features, and while we have approximately twenty base features they 139
173 160 MGPNW2.txt Figure 4.21: Plot of the number of mean shift segments for the whole sequence shown in Figure ECPNW2.txt Figure 4.22: Plot of the number of edges for the whole sequence shown in Figure
174 MNPNW2.txt Figure 4.23: Plot of the number of moving nonskin pixels for the whole sequence shown in Figure NMPNW2.txt Figure 4.24: Plot of the number of moving pixels for the whole sequence shown in Figure
175 90000 ONPNW2.txt Figure 4.25: Plot of the number of skin colored pixels for the whole sequence shown in Figure might not always be enough to recognize all actions in an office environment. By varying the parameters of the edge detection and mean shift segmentation we can greatly increase the number of features available. We can vary parameters such as the N frame sliding window of the temporal features. Other features can be varied in a similar manner. This expansion of base features would be analogous to changing the size of the haar like Adaboost features found in [VJ01]. Section 4.8 Results & Discussion To test the AdaBoost activity recognition framework we ran a number of experiments. We report these results and give other implementation details of the training process. We have tested the system on the actions listed in Table 4.1. All results were obtained using a separate one-againstall classifier for each action. Detailed result on the features selected by the classifiers for the 142
176 Table 4.6: Preliminary results showing the features selected in a cascade for the drinking event classifier. The feature name is shown in Column 1. The true positives and true negatives (on a frame by frame basis) are shown in Columns 2-3 respectively. Feature Name True Positives True Negatives Overlap bottom 107/ /3050 Moving non-skin 98/ /3050 Clusters 124/ /3050 Number edges 123/ /3050 Cascade 138/ /3050 drinking, phone, and empty hand events are shown in Tables Parallel results for the testing sequences are shown in Table 4.8. We performed a variety of experiments. Multiple people were used in the training/testing phase and the method achieved good success rates. We limited the system to allowing a maximum of seven weak classifiers for each action because we have higher level features. This also prevents over-training. We trained using the basic features presented in Chapters 3-4. Each feature was computed at all three zoom levels. For those features that were computed in a given region, the regions we computed these features at were the whole image and the found head and hand regions, respectively. 143
177 Table 4.7: Detailed results showing the features selected in a cascade for the using phone event classifier. The feature name is shown in Column 1. The true positives and true negatives (on a frame by frame basis) are shown in Columns 2-3 respectively. Feature Name True Positives True Negatives Hand at face 245/ /2927 Overlapleft/right 181/ /2927 Clusters 227/ /2927 SSD-Motion 200/ /2927 Clusters head 258/ /2927 Cascade 247/ /2927 Table 4.8: Detailed results showing the features selected in a cascade for the using phone event classifier. The feature name is shown in Column 1. The true positives and true negatives (on a frame by frame basis) are shown in Columns 2-3 respectively. Feature Name True Positives True Negatives Number moving 95/ /3090 Number skin pixels 43/ /3090 Hand at face 77/ /3090 Number edges (head region) 16/ /3090 Overlap bottom 100/ /3090 Cascade 98/ /
178 Table 4.9: Detailed results for the testing sequences. Column 1 shows the specific event for which results are reported. Column 2 shows the best feature name. Column 3 shows numerically how well this feature did. Column 4 shows how well the best classifier did on the detection rates. Action Best Feature Percentage Cascade Drinking Overlap bottom Using Phone Hand at face Empty Hand Number moving We now present results obtained by our algorithm. Overall we had 140 video events to train/test on totaling nearly 20,000 video frames. Using these events we performed a variety of training and testing setups. We report results both on detection of actions and localization in time of actions. In all instances the strong classifier built in training did better than any single feature. Generating ground truth for start and end of events is somewhat difficult, because the start and end of an event are not easily defined. We had a person not involved with the project annotate the start and end frames of events and we report results against this annotation. Tables 4.10 and 4.11 give detailed results for each action on the training and testing data respectively. We first compare our method to the best individual feature for each classifier (Columns 3-4). The features make a decision on a frame by frame basis. So we count the number of frames that the best feature correctly responded that a given action was occurring and divide by the total number of frames for this action to get the true positive rate. We use an analogous procedure to determine the true negative rate. We compare this result with the results of TemporalBoost s frame by frame decisions. It can be seen 145
179 Table 4.10: Results on training data. Col. 1 gives the action id. 2 gives the # actions and total # frames for each action. 3-4 give a head to head comparison between the best feature and the strong classifier. 5-6 (relevant only for TemporalBoost) give the true positive and false positive action detection rate. 7 gives TemporalBoost localization percentages. Action Frequency /# Best Feature: True Classifier: TP FP Localize True Frames +ve / True -ve % True +ve / +ve / True -ve True -ve % % a 1 2/263 68/96 91/ /91 a 2 1/46 84/80 100/ /66 a 3 6/412 82/98 99/ /97 a 4 8/303 80/76 94/ /92 a 5 11/501 70/85 93/ /95 a 6 9/348 94/79 95/ /94 a 7 7/205 95/79 98/ /97 a 8 6/464 89/94 95/ /99 a 9 9/136 86/87 97/ /95 a 10 6/136 97/80 97/ /86 a 11 8/336 97/78 99/ /93 146
180 that the classifier outperforms the individual features. We would get even bigger improvements if more features were in the strong classifier. Columns 5-6 show the number of true positive and false positives and indicate how well the TemporalBoost procedure was able to correctly detect events. Localization results (Column 7) are computed in the following manner. For a given action class a i the start and end frame of each instance is known via the ground truth. Our method also gave estimated start and end frames for each action of class a i. We compute the total number of frames that the proposed method overlapped with the ground truth for action a i. We divide this by the total number of frames a i occurred to obtain the localization true positive rate. An analogous procedure is used to compute the localization true negative rate. The localization results are often times lower than the frame wise % (Column 4). This is so because it is harder to find start and end of events. If an event is missed then every frame of that event is counted as a miss, whereas a classifier can still get some of the individual frames correct. Table 4.12 gives a partial listing of some of the features selected for a subset of actions. It is interesting that action a 3 relied most on color information, while actions a 4 and a 11 both made most use of contextual hand information. Figure 4.26 shows some example detections from the testing sequences. The detection rates for a 4 and a 5 indicate they were two of the harder events for the system. The problem comes from the fact that these two events are so similar (i.e., hand coming to face in arbitrary area). This is true because for both events the hand must move a lot initially, which looks like a 4 even if it is a 5. These results could be improved with the addition of more features. Some of our results for action recognition (about 70 actions) on the testing data set are included in the supplemental material. 147
181 Table 4.11: Results on testing data. Col 1 gives the action name. 2 gives the # actions and total # frames for each action. 3-4 give a head to head comparison between the best feature and the strong classifier. 5-6 are relevant only for TemporalBoost and give the true positive, false positive action detection and rate. 7 gives localization percentages. Action Frequency /# Best Feature: True Classifier: TP FP Localize True Frames +ve / True -ve % True +ve / +ve / True -ve True -ve % % a 1 4/230 68/94 91/ /91 a 2 2/70 82/80 99/ /74 a 3 5/400 82/97 98/ /91 a 4 9/276 79/79 93/ /92 a 5 12/468 70/83 93/ /94 a 6 9/367 94/79 90/ /89 a 7 7/268 97/81 97/ /96 a 8 6/398 89/93 94/ /98 a 9 9/132 86/85 95/ /86 a 10 6/141 95/77 95/ /87 a 11 8/283 96/79 98/ /91 148


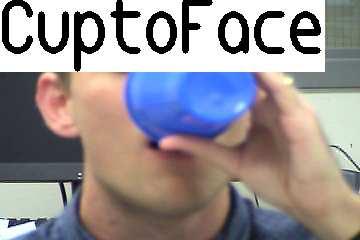


182 Figure 4.26: Example output frames from testing sequences showing images labeled automatically by TemporalBoost. They go from left to right. 149
Integrating multiple levels of zoom to enable activity analysis
 Computer Vision and Image Understanding 103 (2006) 33 51 www.elsevier.com/locate/cviu Integrating multiple levels of zoom to enable activity analysis Paul Smith *, Mubarak Shah, Niels da Vitoria Lobo Computer
Cs : Computer Vision Final Project Report
 Cs 600.461: Computer Vision Final Project Report Giancarlo Troni gtroni@jhu.edu Raphael Sznitman sznitman@jhu.edu Abstract Given a Youtube video of a busy street intersection, our task is to detect, track,
Fundamentals of Stereo Vision Michael Bleyer LVA Stereo Vision
 Fundamentals of Stereo Vision Michael Bleyer LVA Stereo Vision What Happened Last Time? Human 3D perception (3D cinema) Computational stereo Intuitive explanation of what is meant by disparity Stereo matching
Face detection, validation and tracking. Océane Esposito, Grazina Laurinaviciute, Alexandre Majetniak
 Face detection, validation and tracking Océane Esposito, Grazina Laurinaviciute, Alexandre Majetniak Agenda Motivation and examples Face detection Face validation Face tracking Conclusion Motivation Goal:
SIFT: SCALE INVARIANT FEATURE TRANSFORM SURF: SPEEDED UP ROBUST FEATURES BASHAR ALSADIK EOS DEPT. TOPMAP M13 3D GEOINFORMATION FROM IMAGES 2014
 SIFT: SCALE INVARIANT FEATURE TRANSFORM SURF: SPEEDED UP ROBUST FEATURES BASHAR ALSADIK EOS DEPT. TOPMAP M13 3D GEOINFORMATION FROM IMAGES 2014 SIFT SIFT: Scale Invariant Feature Transform; transform image
Deep Tracking: Biologically Inspired Tracking with Deep Convolutional Networks
 Deep Tracking: Biologically Inspired Tracking with Deep Convolutional Networks Si Chen The George Washington University sichen@gwmail.gwu.edu Meera Hahn Emory University mhahn7@emory.edu Mentor: Afshin
Pose estimation using a variety of techniques
 Pose estimation using a variety of techniques Keegan Go Stanford University keegango@stanford.edu Abstract Vision is an integral part robotic systems a component that is needed for robots to interact robustly
CS4758: Rovio Augmented Vision Mapping Project
 CS4758: Rovio Augmented Vision Mapping Project Sam Fladung, James Mwaura Abstract The goal of this project is to use the Rovio to create a 2D map of its environment using a camera and a fixed laser pointer
Why study Computer Vision?
 Why study Computer Vision? Images and movies are everywhere Fast-growing collection of useful applications building representations of the 3D world from pictures automated surveillance (who s doing what)
Outline 7/2/201011/6/
 Outline Pattern recognition in computer vision Background on the development of SIFT SIFT algorithm and some of its variations Computational considerations (SURF) Potential improvement Summary 01 2 Pattern
What have we leaned so far?
 What have we leaned so far? Camera structure Eye structure Project 1: High Dynamic Range Imaging What have we learned so far? Image Filtering Image Warping Camera Projection Model Project 2: Panoramic
CROSS-REFERENCE TABLE ASME A Including A17.1a-1997 Through A17.1d 2000 vs. ASME A
 CROSS-REFERENCE TABLE ASME Including A17.1a-1997 Through A17.1d 2000 vs. ASME 1 1.1 1.1 1.1.1 1.2 1.1.2 1.3 1.1.3 1.4 1.1.4 2 1.2 3 1.3 4 Part 9 100 2.1 100.1 2.1.1 100.1a 2.1.1.1 100.1b 2.1.1.2 100.1c
Contents I IMAGE FORMATION 1
 Contents I IMAGE FORMATION 1 1 Geometric Camera Models 3 1.1 Image Formation............................. 4 1.1.1 Pinhole Perspective....................... 4 1.1.2 Weak Perspective.........................
Introduction to Creo Elements/Direct 19.0 Modeling
 Introduction to Creo Elements/Direct 19.0 Modeling Overview Course Code Course Length TRN-4531-T 3 Day In this course, you will learn the basics about 3-D design using Creo Elements/Direct Modeling. You
Segmentation and Tracking of Partial Planar Templates
 Segmentation and Tracking of Partial Planar Templates Abdelsalam Masoud William Hoff Colorado School of Mines Colorado School of Mines Golden, CO 800 Golden, CO 800 amasoud@mines.edu whoff@mines.edu Abstract
Computer Vision with MATLAB MATLAB Expo 2012 Steve Kuznicki
 Computer Vision with MATLAB MATLAB Expo 2012 Steve Kuznicki 2011 The MathWorks, Inc. 1 Today s Topics Introduction Computer Vision Feature-based registration Automatic image registration Object recognition/rotation
Image processing and features
 Image processing and features Gabriele Bleser gabriele.bleser@dfki.de Thanks to Harald Wuest, Folker Wientapper and Marc Pollefeys Introduction Previous lectures: geometry Pose estimation Epipolar geometry
CS 231A Computer Vision (Fall 2012) Problem Set 3
 Problem Set 3") CS 231A Computer Vision (Fall 2012) Problem Set 3 Due: Nov. 13 th, 2012 (2:15pm) 1 Probabilistic Recursion for Tracking (20 points) In this problem you will derive a method for tracking a point of interest
CS 231A Computer Vision (Fall 2012) Problem Set 3 Due: Nov. 13 th, 2012 (2:15pm) 1 Probabilistic Recursion for Tracking (20 points) In this problem you will derive a method for tracking a point of interest
Range Imaging Through Triangulation. Range Imaging Through Triangulation. Range Imaging Through Triangulation. Range Imaging Through Triangulation
 Obviously, this is a very slow process and not suitable for dynamic scenes. To speed things up, we can use a laser that projects a vertical line of light onto the scene. This laser rotates around its vertical
COMPARATIVE STUDY OF DIFFERENT APPROACHES FOR EFFICIENT RECTIFICATION UNDER GENERAL MOTION
 COMPARATIVE STUDY OF DIFFERENT APPROACHES FOR EFFICIENT RECTIFICATION UNDER GENERAL MOTION Mr.V.SRINIVASA RAO 1 Prof.A.SATYA KALYAN 2 DEPARTMENT OF COMPUTER SCIENCE AND ENGINEERING PRASAD V POTLURI SIDDHARTHA
CSE 252B: Computer Vision II
 CSE 252B: Computer Vision II Lecturer: Serge Belongie Scribes: Jeremy Pollock and Neil Alldrin LECTURE 14 Robust Feature Matching 14.1. Introduction Last lecture we learned how to find interest points
CAP 5415 Computer Vision Fall 2012
 CAP 5415 Computer Vision Fall 01 Dr. Mubarak Shah Univ. of Central Florida Office 47-F HEC Lecture-5 SIFT: David Lowe, UBC SIFT - Key Point Extraction Stands for scale invariant feature transform Patented
Mathematics Shape and Space: Polygon Angles
 a place of mind F A C U L T Y O F E D U C A T I O N Department of Curriculum and Pedagogy Mathematics Shape and Space: Polygon Angles Science and Mathematics Education Research Group Supported by UBC Teaching
Final Exam Study Guide
 Final Exam Study Guide Exam Window: 28th April, 12:00am EST to 30th April, 11:59pm EST Description As indicated in class the goal of the exam is to encourage you to review the material from the course.
Automatic Initialization of the TLD Object Tracker: Milestone Update
 Automatic Initialization of the TLD Object Tracker: Milestone Update Louis Buck May 08, 2012 1 Background TLD is a long-term, real-time tracker designed to be robust to partial and complete occlusions
Human Detection. A state-of-the-art survey. Mohammad Dorgham. University of Hamburg
 Human Detection A state-of-the-art survey Mohammad Dorgham University of Hamburg Presentation outline Motivation Applications Overview of approaches (categorized) Approaches details References Motivation
Analysis of Image and Video Using Color, Texture and Shape Features for Object Identification
 IOSR Journal of Computer Engineering (IOSR-JCE) e-issn: 2278-0661,p-ISSN: 2278-8727, Volume 16, Issue 6, Ver. VI (Nov Dec. 2014), PP 29-33 Analysis of Image and Video Using Color, Texture and Shape Features
SUMMARY: DISTINCTIVE IMAGE FEATURES FROM SCALE- INVARIANT KEYPOINTS
 SUMMARY: DISTINCTIVE IMAGE FEATURES FROM SCALE- INVARIANT KEYPOINTS Cognitive Robotics Original: David G. Lowe, 004 Summary: Coen van Leeuwen, s1460919 Abstract: This article presents a method to extract
Detection of a Single Hand Shape in the Foreground of Still Images
 CS229 Project Final Report Detection of a Single Hand Shape in the Foreground of Still Images Toan Tran (dtoan@stanford.edu) 1. Introduction This paper is about an image detection system that can detect
BSB663 Image Processing Pinar Duygulu. Slides are adapted from Selim Aksoy
 BSB663 Image Processing Pinar Duygulu Slides are adapted from Selim Aksoy Image matching Image matching is a fundamental aspect of many problems in computer vision. Object or scene recognition Solving
CS 4495 Computer Vision A. Bobick. Motion and Optic Flow. Stereo Matching
 Stereo Matching Fundamental matrix Let p be a point in left image, p in right image l l Epipolar relation p maps to epipolar line l p maps to epipolar line l p p Epipolar mapping described by a 3x3 matrix
A Novel Multi-Planar Homography Constraint Algorithm for Robust Multi-People Location with Severe Occlusion
 A Novel Multi-Planar Homography Constraint Algorithm for Robust Multi-People Location with Severe Occlusion Paper ID:086 Abstract Multi-view approach has been proposed to solve occlusion and lack of visibility
Motion Tracking and Event Understanding in Video Sequences
 Motion Tracking and Event Understanding in Video Sequences Isaac Cohen Elaine Kang, Jinman Kang Institute for Robotics and Intelligent Systems University of Southern California Los Angeles, CA Objectives!
CS 223B Computer Vision Problem Set 3
 CS 223B Computer Vision Problem Set 3 Due: Feb. 22 nd, 2011 1 Probabilistic Recursion for Tracking In this problem you will derive a method for tracking a point of interest through a sequence of images.
Human Motion Detection and Tracking for Video Surveillance
 Human Motion Detection and Tracking for Video Surveillance Prithviraj Banerjee and Somnath Sengupta Department of Electronics and Electrical Communication Engineering Indian Institute of Technology, Kharagpur,
A Hybrid Face Detection System using combination of Appearance-based and Feature-based methods
 IJCSNS International Journal of Computer Science and Network Security, VOL.9 No.5, May 2009 181 A Hybrid Face Detection System using combination of Appearance-based and Feature-based methods Zahra Sadri
Multiple View Geometry
 Multiple View Geometry CS 6320, Spring 2013 Guest Lecture Marcel Prastawa adapted from Pollefeys, Shah, and Zisserman Single view computer vision Projective actions of cameras Camera callibration Photometric
Multi-stable Perception. Necker Cube
 Multi-stable Perception Necker Cube Spinning dancer illusion, Nobuyuki Kayahara Multiple view geometry Stereo vision Epipolar geometry Lowe Hartley and Zisserman Depth map extraction Essential matrix
Edge and corner detection
 Edge and corner detection Prof. Stricker Doz. G. Bleser Computer Vision: Object and People Tracking Goals Where is the information in an image? How is an object characterized? How can I find measurements
CS 664 Segmentation. Daniel Huttenlocher
 CS 664 Segmentation Daniel Huttenlocher Grouping Perceptual Organization Structural relationships between tokens Parallelism, symmetry, alignment Similarity of token properties Often strong psychophysical
ECE 172A: Introduction to Intelligent Systems: Machine Vision, Fall Midterm Examination
 ECE 172A: Introduction to Intelligent Systems: Machine Vision, Fall 2008 October 29, 2008 Notes: Midterm Examination This is a closed book and closed notes examination. Please be precise and to the point.
Epipolar Geometry in Stereo, Motion and Object Recognition
 Epipolar Geometry in Stereo, Motion and Object Recognition A Unified Approach by GangXu Department of Computer Science, Ritsumeikan University, Kusatsu, Japan and Zhengyou Zhang INRIA Sophia-Antipolis,
Object and Class Recognition I:
 Object and Class Recognition I: Object Recognition Lectures 10 Sources ICCV 2005 short courses Li Fei-Fei (UIUC), Rob Fergus (Oxford-MIT), Antonio Torralba (MIT) http://people.csail.mit.edu/torralba/iccv2005
CAP 6412 Advanced Computer Vision
 CAP 6412 Advanced Computer Vision http://www.cs.ucf.edu/~bgong/cap6412.html Boqing Gong April 21st, 2016 Today Administrivia Free parameters in an approach, model, or algorithm? Egocentric videos by Aisha
Object Detection System
 A Trainable View-Based Object Detection System Thesis Proposal Henry A. Rowley Thesis Committee: Takeo Kanade, Chair Shumeet Baluja Dean Pomerleau Manuela Veloso Tomaso Poggio, MIT Motivation Object detection
Chapter 3 Image Registration. Chapter 3 Image Registration
 Chapter 3 Image Registration Distributed Algorithms for Introduction (1) Definition: Image Registration Input: 2 images of the same scene but taken from different perspectives Goal: Identify transformation
A method for depth-based hand tracing
 A method for depth-based hand tracing Khoa Ha University of Maryland, College Park khoaha@umd.edu Abstract An algorithm for natural human-computer interaction via in-air drawing is detailed. We discuss
Prof. Fanny Ficuciello Robotics for Bioengineering Visual Servoing
 Visual servoing vision allows a robotic system to obtain geometrical and qualitative information on the surrounding environment high level control motion planning (look-and-move visual grasping) low level
(Refer Slide Time 00:17) Welcome to the course on Digital Image Processing. (Refer Slide Time 00:22)
 Welcome to the course on Digital Image Processing. (Refer Slide Time 00:22)") Digital Image Processing Prof. P. K. Biswas Department of Electronics and Electrical Communications Engineering Indian Institute of Technology, Kharagpur Module Number 01 Lecture Number 02 Application
Digital Image Processing Prof. P. K. Biswas Department of Electronics and Electrical Communications Engineering Indian Institute of Technology, Kharagpur Module Number 01 Lecture Number 02 Application
Feature Tracking and Optical Flow
 Feature Tracking and Optical Flow Prof. D. Stricker Doz. G. Bleser Many slides adapted from James Hays, Derek Hoeim, Lana Lazebnik, Silvio Saverse, who in turn adapted slides from Steve Seitz, Rick Szeliski,
COSC160: Detection and Classification. Jeremy Bolton, PhD Assistant Teaching Professor
 COSC160: Detection and Classification Jeremy Bolton, PhD Assistant Teaching Professor Outline I. Problem I. Strategies II. Features for training III. Using spatial information? IV. Reducing dimensionality
Chapter 12 3D Localisation and High-Level Processing
 Chapter 12 3D Localisation and High-Level Processing This chapter describes how the results obtained from the moving object tracking phase are used for estimating the 3D location of objects, based on the
Video Alignment. Literature Survey. Spring 2005 Prof. Brian Evans Multidimensional Digital Signal Processing Project The University of Texas at Austin
 Literature Survey Spring 2005 Prof. Brian Evans Multidimensional Digital Signal Processing Project The University of Texas at Austin Omer Shakil Abstract This literature survey compares various methods
Postprint.
 http://www.diva-portal.org Postprint This is the accepted version of a paper presented at 14th International Conference of the Biometrics Special Interest Group, BIOSIG, Darmstadt, Germany, 9-11 September,
Accurate 3D Face and Body Modeling from a Single Fixed Kinect
 Accurate 3D Face and Body Modeling from a Single Fixed Kinect Ruizhe Wang*, Matthias Hernandez*, Jongmoo Choi, Gérard Medioni Computer Vision Lab, IRIS University of Southern California Abstract In this
Stereo Vision. MAN-522 Computer Vision
 Stereo Vision MAN-522 Computer Vision What is the goal of stereo vision? The recovery of the 3D structure of a scene using two or more images of the 3D scene, each acquired from a different viewpoint in
COMPUTER AND ROBOT VISION
 VOLUME COMPUTER AND ROBOT VISION Robert M. Haralick University of Washington Linda G. Shapiro University of Washington T V ADDISON-WESLEY PUBLISHING COMPANY Reading, Massachusetts Menlo Park, California
Discovering Visual Hierarchy through Unsupervised Learning Haider Razvi
 Discovering Visual Hierarchy through Unsupervised Learning Haider Razvi hrazvi@stanford.edu 1 Introduction: We present a method for discovering visual hierarchy in a set of images. Automatically grouping
CS231A Midterm Review. Friday 5/6/2016
 CS231A Midterm Review Friday 5/6/2016 Outline General Logistics Camera Models Non-perspective cameras Calibration Single View Metrology Epipolar Geometry Structure from Motion Active Stereo and Volumetric
Certificate Program. Introduction to Microsoft Excel 2013
 Certificate Program We offer online education programs designed to provide the workforce skills necessary to enter a new field or advance your current career. Our Online Career Training Programs in the
METRIC PLANE RECTIFICATION USING SYMMETRIC VANISHING POINTS
 METRIC PLANE RECTIFICATION USING SYMMETRIC VANISHING POINTS M. Lefler, H. Hel-Or Dept. of CS, University of Haifa, Israel Y. Hel-Or School of CS, IDC, Herzliya, Israel ABSTRACT Video analysis often requires
CS 231A Computer Vision (Winter 2014) Problem Set 3
 Problem Set 3") CS 231A Computer Vision (Winter 2014) Problem Set 3 Due: Feb. 18 th, 2015 (11:59pm) 1 Single Object Recognition Via SIFT (45 points) In his 2004 SIFT paper, David Lowe demonstrates impressive object recognition
CS 231A Computer Vision (Winter 2014) Problem Set 3 Due: Feb. 18 th, 2015 (11:59pm) 1 Single Object Recognition Via SIFT (45 points) In his 2004 SIFT paper, David Lowe demonstrates impressive object recognition
Mobile Human Detection Systems based on Sliding Windows Approach-A Review
 Mobile Human Detection Systems based on Sliding Windows Approach-A Review Seminar: Mobile Human detection systems Njieutcheu Tassi cedrique Rovile Department of Computer Engineering University of Heidelberg
Feature Tracking and Optical Flow
 Feature Tracking and Optical Flow Prof. D. Stricker Doz. G. Bleser Many slides adapted from James Hays, Derek Hoeim, Lana Lazebnik, Silvio Saverse, who 1 in turn adapted slides from Steve Seitz, Rick Szeliski,
Mouse Pointer Tracking with Eyes
 Mouse Pointer Tracking with Eyes H. Mhamdi, N. Hamrouni, A. Temimi, and M. Bouhlel Abstract In this article, we expose our research work in Human-machine Interaction. The research consists in manipulating
MediaTek Video Face Beautify
 MediaTek Video Face Beautify November 2014 2014 MediaTek Inc. Table of Contents 1 Introduction... 3 2 The MediaTek Solution... 4 3 Overview of Video Face Beautify... 4 4 Face Detection... 6 5 Skin Detection...
Motivation. Gray Levels
 Motivation Image Intensity and Point Operations Dr. Edmund Lam Department of Electrical and Electronic Engineering The University of Hong ong A digital image is a matrix of numbers, each corresponding
Occluded Facial Expression Tracking
 Occluded Facial Expression Tracking Hugo Mercier 1, Julien Peyras 2, and Patrice Dalle 1 1 Institut de Recherche en Informatique de Toulouse 118, route de Narbonne, F-31062 Toulouse Cedex 9 2 Dipartimento
Lecture 9: Hough Transform and Thresholding base Segmentation
 #1 Lecture 9: Hough Transform and Thresholding base Segmentation Saad Bedros sbedros@umn.edu Hough Transform Robust method to find a shape in an image Shape can be described in parametric form A voting
Gesture based PTZ camera control
 Gesture based PTZ camera control Report submitted in May 2014 to the department of Computer Science and Engineering of National Institute of Technology Rourkela in partial fulfillment of the requirements
Finally: Motion and tracking. Motion 4/20/2011. CS 376 Lecture 24 Motion 1. Video. Uses of motion. Motion parallax. Motion field
 Finally: Motion and tracking Tracking objects, video analysis, low level motion Motion Wed, April 20 Kristen Grauman UT-Austin Many slides adapted from S. Seitz, R. Szeliski, M. Pollefeys, and S. Lazebnik
Complex Sensors: Cameras, Visual Sensing. The Robotics Primer (Ch. 9) ECE 497: Introduction to Mobile Robotics -Visual Sensors
 ECE 497: Introduction to Mobile Robotics -Visual Sensors") Complex Sensors: Cameras, Visual Sensing The Robotics Primer (Ch. 9) Bring your laptop and robot everyday DO NOT unplug the network cables from the desktop computers or the walls Tuesday s Quiz is on Visual
Complex Sensors: Cameras, Visual Sensing The Robotics Primer (Ch. 9) Bring your laptop and robot everyday DO NOT unplug the network cables from the desktop computers or the walls Tuesday s Quiz is on Visual
Motion Analysis. Motion analysis. Now we will talk about. Differential Motion Analysis. Motion analysis. Difference Pictures
 Now we will talk about Motion Analysis Motion analysis Motion analysis is dealing with three main groups of motionrelated problems: Motion detection Moving object detection and location. Derivation of
arxiv: v1 [cs.cv] 28 Sep 2018
![arxiv: v1 [cs.cv] 28 Sep 2018](/thumbs/93/113542646.jpg "arxiv: v1 [cs.cv] 28 Sep 2018") Camera Pose Estimation from Sequence of Calibrated Images arxiv:1809.11066v1 [cs.cv] 28 Sep 2018 Jacek Komorowski 1 and Przemyslaw Rokita 2 1 Maria Curie-Sklodowska University, Institute of Computer Science,
Camera Pose Estimation from Sequence of Calibrated Images arxiv:1809.11066v1 [cs.cv] 28 Sep 2018 Jacek Komorowski 1 and Przemyslaw Rokita 2 1 Maria Curie-Sklodowska University, Institute of Computer Science,
Fundamentals of Digital Image Processing
 \L\.6 Gw.i Fundamentals of Digital Image Processing A Practical Approach with Examples in Matlab Chris Solomon School of Physical Sciences, University of Kent, Canterbury, UK Toby Breckon School of Engineering,
Image Processing Pipeline for Facial Expression Recognition under Variable Lighting
 Image Processing Pipeline for Facial Expression Recognition under Variable Lighting Ralph Ma, Amr Mohamed ralphma@stanford.edu, amr1@stanford.edu Abstract Much research has been done in the field of automated
Detecting and Identifying Moving Objects in Real-Time
 Chapter 9 Detecting and Identifying Moving Objects in Real-Time For surveillance applications or for human-computer interaction, the automated real-time tracking of moving objects in images from a stationary
Pairwise Threshold for Gaussian Mixture Classification and its Application on Human Tracking Enhancement
 Pairwise Threshold for Gaussian Mixture Classification and its Application on Human Tracking Enhancement Daegeon Kim Sung Chun Lee Institute for Robotics and Intelligent Systems University of Southern
Topics for thesis. Automatic Speech-based Emotion Recognition
 Topics for thesis Bachelor: Automatic Speech-based Emotion Recognition Emotion recognition is an important part of Human-Computer Interaction (HCI). It has various applications in industrial and commercial
Generic Face Alignment Using an Improved Active Shape Model
 Generic Face Alignment Using an Improved Active Shape Model Liting Wang, Xiaoqing Ding, Chi Fang Electronic Engineering Department, Tsinghua University, Beijing, China {wanglt, dxq, fangchi} @ocrserv.ee.tsinghua.edu.cn
Multiple-Choice Questionnaire Group C
 Family name: Vision and Machine-Learning Given name: 1/28/2011 Multiple-Choice naire Group C No documents authorized. There can be several right answers to a question. Marking-scheme: 2 points if all right
Face tracking. (In the context of Saya, the android secretary) Anton Podolsky and Valery Frolov
 Anton Podolsky and Valery Frolov") Face tracking (In the context of Saya, the android secretary) Anton Podolsky and Valery Frolov Introduction Given the rather ambitious task of developing a robust face tracking algorithm which could be
Face tracking (In the context of Saya, the android secretary) Anton Podolsky and Valery Frolov Introduction Given the rather ambitious task of developing a robust face tracking algorithm which could be
Peripheral drift illusion
 Peripheral drift illusion Does it work on other animals? Computer Vision Motion and Optical Flow Many slides adapted from J. Hays, S. Seitz, R. Szeliski, M. Pollefeys, K. Grauman and others Video A video
Illumination invariant face detection
 University of Wollongong Research Online University of Wollongong Thesis Collection 1954-2016 University of Wollongong Thesis Collections 2009 Illumination invariant face detection Alister Cordiner University
CHAPTER 6 PERCEPTUAL ORGANIZATION BASED ON TEMPORAL DYNAMICS
 CHAPTER 6 PERCEPTUAL ORGANIZATION BASED ON TEMPORAL DYNAMICS This chapter presents a computational model for perceptual organization. A figure-ground segregation network is proposed based on a novel boundary
Measurement in Science
 Measurement in Science Name Why? Many observations of events in the natural world are best described with numbers.measurements allow us to determine and describe properties, patterns and relationships
Face Recognition using SURF Features and SVM Classifier
 International Journal of Electronics Engineering Research. ISSN 0975-6450 Volume 8, Number 1 (016) pp. 1-8 Research India Publications http://www.ripublication.com Face Recognition using SURF Features
Subject-Oriented Image Classification based on Face Detection and Recognition
 000 001 002 003 004 005 006 007 008 009 010 011 012 013 014 015 016 017 018 019 020 021 022 023 024 025 026 027 028 029 030 031 032 033 034 035 036 037 038 039 040 041 042 043 044 045 046 047 048 049 050
Local Feature Detectors
 Local Feature Detectors Selim Aksoy Department of Computer Engineering Bilkent University saksoy@cs.bilkent.edu.tr Slides adapted from Cordelia Schmid and David Lowe, CVPR 2003 Tutorial, Matthew Brown,
Automatic Tracking of Moving Objects in Video for Surveillance Applications
 Automatic Tracking of Moving Objects in Video for Surveillance Applications Manjunath Narayana Committee: Dr. Donna Haverkamp (Chair) Dr. Arvin Agah Dr. James Miller Department of Electrical Engineering
EXAM SOLUTIONS. Image Processing and Computer Vision Course 2D1421 Monday, 13 th of March 2006,
 School of Computer Science and Communication, KTH Danica Kragic EXAM SOLUTIONS Image Processing and Computer Vision Course 2D1421 Monday, 13 th of March 2006, 14.00 19.00 Grade table 0-25 U 26-35 3 36-45
Digital Image Processing
 Digital Image Processing Third Edition Rafael C. Gonzalez University of Tennessee Richard E. Woods MedData Interactive PEARSON Prentice Hall Pearson Education International Contents Preface xv Acknowledgments
RGBD Face Detection with Kinect Sensor. ZhongJie Bi
 RGBD Face Detection with Kinect Sensor ZhongJie Bi Outline The Existing State-of-the-art Face Detector Problems with this Face Detector Proposed solution to the problems Result and ongoing tasks The Existing
A Survey of Light Source Detection Methods
 A Survey of Light Source Detection Methods Nathan Funk University of Alberta Mini-Project for CMPUT 603 November 30, 2003 Abstract This paper provides an overview of the most prominent techniques for light
Visual Odometry. Features, Tracking, Essential Matrix, and RANSAC. Stephan Weiss Computer Vision Group NASA-JPL / CalTech
 Visual Odometry Features, Tracking, Essential Matrix, and RANSAC Stephan Weiss Computer Vision Group NASA-JPL / CalTech Stephan.Weiss@ieee.org (c) 2013. Government sponsorship acknowledged. Outline The
IRIS SEGMENTATION OF NON-IDEAL IMAGES
 IRIS SEGMENTATION OF NON-IDEAL IMAGES William S. Weld St. Lawrence University Computer Science Department Canton, NY 13617 Xiaojun Qi, Ph.D Utah State University Computer Science Department Logan, UT 84322
CS231A Course Project Final Report Sign Language Recognition with Unsupervised Feature Learning
 CS231A Course Project Final Report Sign Language Recognition with Unsupervised Feature Learning Justin Chen Stanford University justinkchen@stanford.edu Abstract This paper focuses on experimenting with
Knowledge libraries and information space
 University of Wollongong Research Online University of Wollongong Thesis Collection 1954-2016 University of Wollongong Thesis Collections 2009 Knowledge libraries and information space Eric Rayner University
School of Computing University of Utah
 School of Computing University of Utah Presentation Outline 1 2 3 4 Main paper to be discussed David G. Lowe, Distinctive Image Features from Scale-Invariant Keypoints, IJCV, 2004. How to find useful keypoints?
Face Detection and Recognition in an Image Sequence using Eigenedginess
 Face Detection and Recognition in an Image Sequence using Eigenedginess B S Venkatesh, S Palanivel and B Yegnanarayana Department of Computer Science and Engineering. Indian Institute of Technology, Madras