Module 10. Data Visualization. Andrew Jaffe Instructor
|
|
|
- Anthony Norman
- 5 years ago
- Views:
Transcription
1 Module 10 Data Visualization Andrew Jaffe Instructor
2 Basic Plots We covered some basic plots on Wednesday, but we are going to expand the ability to customize these basic graphics first. 2/37
3 But first... Some cool graphics made in R by us. 3/37
 >year=as.integer(gsub(\"x\",\"\",names(death))) >plot(as.")
4 Basic Plots >death=read.csv(" + as.is=t,header=true,row.names=1) >year=as.integer(gsub("x","",names(death))) >plot(as.numeric(death["sweden",])~year) 4/37
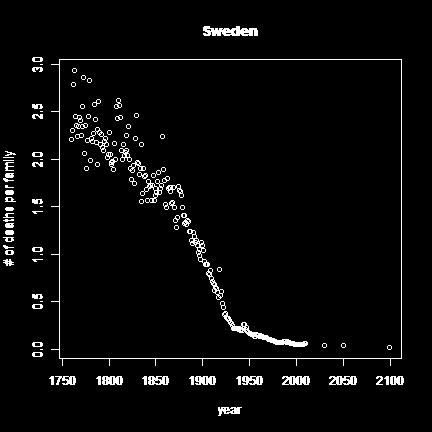
5 Basic Plots >plot(as.numeric(death["sweden",])~year,ylab="#ofdeathsperfamily", + main="sweden") 5/37
6 Basic Plots >plot(as.numeric(death["sweden",])~year,ylab="#ofdeathsperfamily", + main="sweden",xlim=c(1760,2012),pch=19,cex=1.2,col="blue") 6/37
7 Basic Plots >scatter.smooth(as.numeric(death["sweden",])~year,span=0.2,ylab="#ofdeathsperfamily", + main="sweden",lwd=3,xlim=c(1760,2012),pch=19,cex=0.9,col="grey") 7/37
![Basic Plots >par(mfrow=c(1,2)) >scatter.smooth(as.numeric(death["sweden",])~year,span=0.2,ylab="#ofdeathsperfamily", + main="sweden",lwd=3,xlim=c(1760,2012),pch=19,cex=0.](/docs-images/92/108355350/images/8-0.jpg "9,col=\"grey\") >scatter.smooth(as.numeric(death[\"unitedkingdom\",])~year,span=0.2,ylab=\"#ofdeathsperfamil + main=\"unitedkingdom\",lwd=3,xlim=c(1760,2012),pch=19,cex=0.")
8 Basic Plots >par(mfrow=c(1,2)) >scatter.smooth(as.numeric(death["sweden",])~year,span=0.2,ylab="#ofdeathsperfamily", + main="sweden",lwd=3,xlim=c(1760,2012),pch=19,cex=0.9,col="grey") >scatter.smooth(as.numeric(death["unitedkingdom",])~year,span=0.2,ylab="#ofdeathsperfamil + main="unitedkingdom",lwd=3,xlim=c(1760,2012),pch=19,cex=0.9, + col="grey") 8/37
![Basic Plots >par(mfrow=c(1,2)) >yl=range(death[c("sweden","unitedkingdom"),]) >scatter.smooth(as.numeric(death["sweden",])~year,span=0.](/docs-images/92/108355350/images/9-0.jpg "2,ylim=yl, + ylab=\"#ofdeathsperfamily\",main=\"sweden\",lwd=3,xlim=c(1760, + 2012),pch=19,cex=0.9,col=\"grey\") >scatter.smooth(as.numeric(death[\"unitedkingdom\",])~year,span=0.")
9 Basic Plots >par(mfrow=c(1,2)) >yl=range(death[c("sweden","unitedkingdom"),]) >scatter.smooth(as.numeric(death["sweden",])~year,span=0.2,ylim=yl, + ylab="#ofdeathsperfamily",main="sweden",lwd=3,xlim=c(1760, ),pch=19,cex=0.9,col="grey") >scatter.smooth(as.numeric(death["unitedkingdom",])~year,span=0.2,ylab="", + main="unitedkingdom",lwd=3,ylim=yl,xlim=c(1760,2012),pch=19, + cex=0.9,col="grey") 9/37
10 Graphical parameters par() can be used to set or query graphical parameters. Parameters can be set by specifying them as arguments to par in tag = value form, or by passing them as a list of tagged values. Note that some parameters are passed from plot(,...) calls whereas others need to be explicitly set using par() - like above with par(mfrow = c(nrow,ncol)) Note that some parameters are both very flexible but also very finicky, especially margins. 10/37
 >counts<-table(cars$isbadbuy,cars$vehicleage) >barplot(counts,main=\"cardistributionbyageandbadbuystatus\",xlab=\"vehicleage\", +")
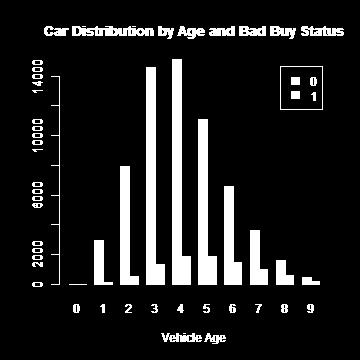
11 Bar Plots Stacked Bar Charts are sometimes wanted to show how >##StackedBarCharts >cars=read.csv(" + as.is=t) >counts<-table(cars$isbadbuy,cars$vehicleage) >barplot(counts,main="cardistributionbyageandbadbuystatus",xlab="vehicleage", + col=c("darkblue","red"),legend=rownames(counts)) 11/37


12 Bar Plots >##Usepercentages(columnpercentages) >barplot(prop.table(counts,2),main="cardistributionbyageandbadbuystatus", + xlab="vehicleage",col=c("darkblue","red"),legend=rownames(counts)) 12/37
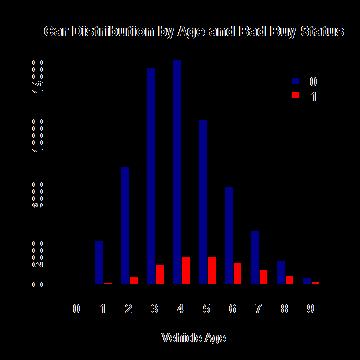
13 Bar Plots >#StackedBarPlotwithColorsandLegend >barplot(counts,main="cardistributionbyageandbadbuystatus",xlab="vehicleage", + col=c("darkblue","red"),legend=rownames(counts),beside=true) 13/37
14 Graphics parameters Set within most plots in the base 'graphics' package: pch = point shape, cex = size/scale xlab, ylab = labels for x and y axes main = plot title lwd = line density col = color cex.axis, cex.lab, cex.main = scaling/sizing for axes marks, axes labels, and title 14/37
 [1]\"black\" \"red\" \"green3\" \"blue\"")
!["cyan" "magenta""yellow" [8]"gray"](/docs-images/92/108355350/images/15-1.jpg ">plot(1:8,1:8,type=\"n\")")
15 Colors R relies on color 'palettes'. >palette() [1]"black" "red" "green3" "blue" "cyan" "magenta""yellow" [8]"gray" >plot(1:8,1:8,type="n") >text(1:8,1:8,lab=palette(),col=1:8) 15/37
16 Colors The default color palette is pretty bad, so you can try to make your own. >palette(c("darkred","orange","blue")) >plot(1:3,1:3,col=1:3,pch=19,cex=2) 16/37
17 Colors It's actually pretty hard to make a good color palette. Luckily, smart and artistic people have spent a lot more time thinking about this. The result is the 'RColorBrewer' package RColorBrewer::display.brewer.all() will show you all of the palettes available. You can even print it out and keep it next to your monitor for reference. The help file for brewer.pal() gives you an idea how to use the package. You can also get a "sneak peek" of these palettes at: You would provide the number of levels or classes of your data, and then the type of data: sequential, diverging, or qualitative. The names of the RColorBrewer palettes are the string after 'pick a color scheme:' 17/37
18 Colors >palette("default") >with(chickweight,plot(weight~time,pch=19,col=diet)) 18/37
19 >library(rcolorbrewer) >palette(brewer.pal(5,"dark2")) >with(chickweight,plot(weight~time,pch=19,col=diet)) 19/37
20 >library(rcolorbrewer) >palette(brewer.pal(5,"dark2")) >with(chickweight,plot(weight~jitter(time,amount=0.2),pch=19,col=diet), + xlab="time") 20/37
21 Adding legends The legend() command adds a legend to your plot. There are tons of arguments to pass it. x, y=null: this just means you can give (x,y) coordinates, or more commonly just give x, as a character string: "top","bottom","topleft","bottomleft","topright","bottomright". legend: unique character vector, the levels of a factor pch, lwd: if you want points in the legend, give a pch value. if you want lines, give a lwd value. col: give the color for each legend level 21/37
,pch=19,col=diet), + xlab=\"time\")")
22 >palette(brewer.pal(5,"dark2")) >with(chickweight,plot(weight~jitter(time,amount=0.2),pch=19,col=diet), + xlab="time") >legend("topleft",paste("diet",levels(chickweight$diet)),col=1:length(levels(chickweight$diet)), + lwd=3,ncol=2) 22/37
) >points(chickweight$weight~jitter(as.numeric(chickweight$diet),0.")
23 Boxplots, revisited These are one of my favorite plots. They are way more informative than the barchart + antenna... >with(chickweight,boxplot(weight~diet,outline=false)) >points(chickweight$weight~jitter(as.numeric(chickweight$diet),0.5)) 23/37
) >dd=factor(dat$day) >with(dat,plot(orangeaverage~greenaverage,pch=19,col=as.")
24 Coloring by variable >load("data/charmcirc.rda") >palette(brewer.pal(7,"dark2")) >dd=factor(dat$day) >with(dat,plot(orangeaverage~greenaverage,pch=19,col=as.numeric(dd))) >legend("bottomright",levels(dd),col=1:length(dd),pch=19) 24/37

25 Coloring by variable >dd=factor(dat$day,levels=c("monday","tuesday","wednesday","thursday", + "Friday","Saturday","Sunday")) >with(dat,plot(orangeaverage~greenaverage,pch=19,col=as.numeric(dd))) >legend("bottomright",levels(dd),col=1:length(dd),pch=19) 25/37
26 Devices By default, R displays plots in a separate panel. From there, you can export the plot to a variety of image file types, or copy it to the clipboard. However, sometimes its very nice to save many plots made at one time to one pdf file, say, for flipping through. Or being more precise with the plot size in the saved file. R has 5 additional graphics devices: bmp(), jpeg(), png(), tiff(), and pdf() The syntax is very similar for all of them: pdf("filename.pdf",width=8,height=8)#inches plot()#plot1 plot()#plot2 #etc dev.off() Basically, you are creating a pdf file, and telling R to write any subsequent plots to that file. Once you are done, you turn the device off. Note that failing to turn the device off will create a pdf file that is corrupt, that you cannot open. 26/37
27 More powerful graphics There are two very common packages for making very nice looking graphics. lattice: ggplot2: 27/37
28 Lattice >library(lattice) >xyplot(weight~time Diet,data=ChickWeight) 28/37
29 Lattice >densityplot(~weight Diet,data=ChickWeight) 29/37
,3:6])")
30 Lattice >rownames(dat2)=dat2$date >mat=as.matrix(dat2[975:nrow(dat2),3:6]) >levelplot(t(mat),aspect="fill") 30/37
)(length(theseq)) >levelplot(t(mat),aspect=\"fill\",at=theseq,col.regions=my.")
31 Lattice >theseq=seq(0,max(mat),by=50) >my.col<-colorramppalette(brewer.pal(5,"greens"))(length(theseq)) >levelplot(t(mat),aspect="fill",at=theseq,col.regions=my.col,xlab="route", + ylab="date") 31/37
![Lattice >tmp=death[grep("s$",rownames(death)),200:251] >yr=gsub("x","",names(tmp)) >theseq=seq(0,max(tmp,na.rm=true),by=0.05) >my.](/docs-images/92/108355350/images/32-0.jpg "col<-colorramppalette(brewer.pal(5,\"reds\"))(length(theseq)) >levelplot(t(tmp),aspect=\"fill\",at=theseq,col.regions=my.")
32 Lattice >tmp=death[grep("s$",rownames(death)),200:251] >yr=gsub("x","",names(tmp)) >theseq=seq(0,max(tmp,na.rm=true),by=0.05) >my.col<-colorramppalette(brewer.pal(5,"reds"))(length(theseq)) >levelplot(t(tmp),aspect="fill",at=theseq,col.regions=my.col,scales=list(x=list(label=y + rot=90,cex=0.7))) 32/37

33 Lattice >cloud(weight~weight*chick Diet,data=ChickWeight) 33/37

34 Lattice >cloud(weight~weight*chick Diet,data=ChickWeight,screen=list(z=40, + x=-70,y=60)) 34/37
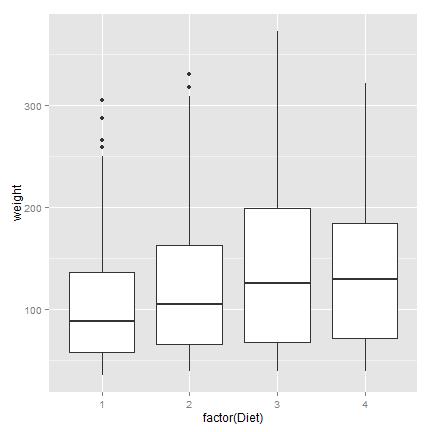
35 ggplot2 >library(ggplot2) >qplot(factor(diet),weight,data=chickweight,geom="boxplot") 35/37
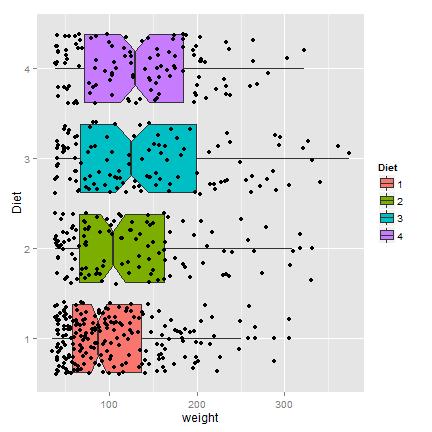
36 ggplot2 >p=ggplot(chickweight,aes(diet,weight)) >p+geom_boxplot(notch=true,aes(fill=diet))+geom_jitter()+coord_flip() 36/37
37 ggplot2 Useful links: /37
Data Visualization. Andrew Jaffe Instructor
 Module 9 Data Visualization Andrew Jaffe Instructor Basic Plots We covered some basic plots previously, but we are going to expand the ability to customize these basic graphics first. 2/45 Read in Data
Intro to R Graphics Center for Social Science Computation and Research, 2010 Stephanie Lee, Dept of Sociology, University of Washington
 Intro to R Graphics Center for Social Science Computation and Research, 2010 Stephanie Lee, Dept of Sociology, University of Washington Class Outline - The R Environment and Graphics Engine - Basic Graphs
Plotting Complex Figures Using R. Simon Andrews v
 Plotting Complex Figures Using R Simon Andrews simon.andrews@babraham.ac.uk v2017-11 The R Painters Model Plot area Base plot Overlays Core Graph Types Local options to change a specific plot Global options
data visualization Show the Data Snow Month skimming deep waters
 data visualization skimming deep waters Show the Data Snow 2 4 6 8 12 Minimize Distraction Minimize Distraction Snow 2 4 6 8 12 2 4 6 8 12 Make Big Data Coherent Reveal Several Levels of Detail 1974 1975
An Introduction to R Graphics
 An Introduction to R Graphics PnP Group Seminar 25 th April 2012 Why use R for graphics? Fast data exploration Easy automation and reproducibility Create publication quality figures Customisation of almost
Introduction to R for Epidemiologists
 Introduction to R for Epidemiologists Jenna Krall, PhD Thursday, January 29, 2015 Final project Epidemiological analysis of real data Must include: Summary statistics T-tests or chi-squared tests Regression
AA BB CC DD EE. Introduction to Graphics in R
 Introduction to Graphics in R Cori Mar 7/10/18 ### Reading in the data dat
Analysing Spatial Data in R: Vizualising Spatial Data
 Analysing Spatial Data in R: Vizualising Spatial Data Roger Bivand Department of Economics Norwegian School of Economics and Business Administration Bergen, Norway 31 August 2007 Vizualising Spatial Data
INTRODUCTION TO R. Basic Graphics
 INTRODUCTION TO R Basic Graphics Graphics in R Create plots with code Replication and modification easy Reproducibility! graphics package ggplot2, ggvis, lattice graphics package Many functions plot()
Types of Plotting Functions. Managing graphics devices. Further High-level Plotting Functions. The plot() Function
 Function") 3 / 23 5 / 23 Outline The R Statistical Environment R Graphics Peter Dalgaard Department of Biostatistics University of Copenhagen January 16, 29 1 / 23 2 / 23 Overview Standard R Graphics The standard
3 / 23 5 / 23 Outline The R Statistical Environment R Graphics Peter Dalgaard Department of Biostatistics University of Copenhagen January 16, 29 1 / 23 2 / 23 Overview Standard R Graphics The standard
Lab 1 Introduction to R
 Lab 1 Introduction to R Date: August 23, 2011 Assignment and Report Due Date: August 30, 2011 Goal: The purpose of this lab is to get R running on your machines and to get you familiar with the basics
Statistical Programming with R
 Statistical Programming with R Lecture 9: Basic graphics in R Part 2 Bisher M. Iqelan biqelan@iugaza.edu.ps Department of Mathematics, Faculty of Science, The Islamic University of Gaza 2017-2018, Semester
Visualising Spatial Data UCL Geography R Spatial Workshop Tuesday 9 th November 2010 rspatialtips.org.uk
 Visualising Spatial Data UCL Geography R Spatial Workshop Tuesday 9 th November 2010 james.cheshire@ucl.ac.uk rspatialtips.org.uk The previous workshop served as an in depth introduction to R's spatial
Basics of Plotting Data
 Basics of Plotting Data Luke Chang Last Revised July 16, 2010 One of the strengths of R over other statistical analysis packages is its ability to easily render high quality graphs. R uses vector based
Graphics - Part III: Basic Graphics Continued
 Graphics - Part III: Basic Graphics Continued Statistics 135 Autumn 2005 Copyright c 2005 by Mark E. Irwin Highway MPG 20 25 30 35 40 45 50 y^i e i = y i y^i 2000 2500 3000 3500 4000 Car Weight Copyright
Configuring Figure Regions with prepplot Ulrike Grömping 03 April 2018
 Configuring Figure Regions with prepplot Ulrike Grömping 3 April 218 Contents 1 Purpose and concept of package prepplot 1 2 Overview of possibilities 2 2.1 Scope.................................................
Advanced Graphics with R
 Advanced Graphics with R Paul Murrell Universitat de Barcelona April 30 2009 Session overview: (i) Introduction Graphic formats: Overview and creating graphics in R Graphical parameters in R: par() Selected
DSCI 325: Handout 18 Introduction to Graphics in R
 DSCI 325: Handout 18 Introduction to Graphics in R Spring 2016 This handout will provide an introduction to creating graphics in R. One big advantage that R has over SAS (and over several other statistical
An introduction to ggplot: An implementation of the grammar of graphics in R
 An introduction to ggplot: An implementation of the grammar of graphics in R Hadley Wickham 00-0-7 1 Introduction Currently, R has two major systems for plotting data, base graphics and lattice graphics
Graphics #1. R Graphics Fundamentals & Scatter Plots
 Graphics #1. R Graphics Fundamentals & Scatter Plots In this lab, you will learn how to generate customized publication-quality graphs in R. Working with R graphics can be done as a stepwise process. Rather
IST 3108 Data Analysis and Graphics Using R Week 9
 IST 3108 Data Analysis and Graphics Using R Week 9 Engin YILDIZTEPE, Ph.D 2017-Spring Introduction to Graphics >y plot (y) In R, pictures are presented in the active graphical device or window.
Plotting Segment Calls From SNP Assay
 Plotting Segment Calls From SNP Assay Kevin R. Coombes 17 March 2011 Contents 1 Executive Summary 1 1.1 Introduction......................................... 1 1.1.1 Aims/Objectives..................................
Welcome to Workshop: Making Graphs
 Welcome to Workshop: Making Graphs I. Please sign in on the sign in sheet (so I can send you slides & follow up for feedback). II. Download materials you ll need from my website (http://faculty.washington.edu/jhrl/teaching.html
Introduction to R: Day 2 September 20, 2017
 Introduction to R: Day 2 September 20, 2017 Outline RStudio projects Base R graphics plotting one or two continuous variables customizable elements of plots saving plots to a file Create a new project
Statistical Programming Camp: An Introduction to R
 Statistical Programming Camp: An Introduction to R Handout 3: Data Manipulation and Summarizing Univariate Data Fox Chapters 1-3, 7-8 In this handout, we cover the following new materials: ˆ Using logical
An Introduction to R 2.2 Statistical graphics
 An Introduction to R 2.2 Statistical graphics Dan Navarro (daniel.navarro@adelaide.edu.au) School of Psychology, University of Adelaide ua.edu.au/ccs/people/dan DSTO R Workshop, 29-Apr-2015 Scatter plots
CIND123 Module 6.2 Screen Capture
 CIND123 Module 6.2 Screen Capture Hello, everyone. In this segment, we will discuss the basic plottings in R. Mainly; we will see line charts, bar charts, histograms, pie charts, and dot charts. Here is
Using Built-in Plotting Functions
 Workshop: Graphics in R Katherine Thompson (katherine.thompson@uky.edu Department of Statistics, University of Kentucky September 15, 2016 Using Built-in Plotting Functions ## Plotting One Quantitative
An introduction to WS 2015/2016
 An introduction to WS 2015/2016 Dr. Noémie Becker (AG Metzler) Dr. Sonja Grath (AG Parsch) Special thanks to: Prof. Dr. Martin Hutzenthaler (previously AG Metzler, now University of Duisburg-Essen) course
Introduction to R. Biostatistics 615/815 Lecture 23
 Introduction to R Biostatistics 615/815 Lecture 23 So far We have been working with C Strongly typed language Variable and function types set explicitly Functional language Programs are a collection of
Graphics in R Ira Sharenow January 2, 2019
 Graphics in R Ira Sharenow January 2, 2019 library(ggplot2) # graphing library library(rcolorbrewer) # nice colors R Markdown This is an R Markdown document. The purpose of this document is to show R users
Graphics in R. Jim Bentley. The following code creates a couple of sample data frames that we will use in our examples.
 Graphics in R Jim Bentley 1 Sample Data The following code creates a couple of sample data frames that we will use in our examples. > sex = c(rep("female",12),rep("male",7)) > mass = c(36.1, 54.6, 48.5,
Practical 2: Plotting
 Practical 2: Plotting Complete this sheet as you work through it. If you run into problems, then ask for help - don t skip sections! Open Rstudio and store any files you download or create in a directory
Customizing Graphs Using R
 Customizing Graphs Using R Scott Richter 2018 QMS Summer Workshop Series 1 Base R Plotting The data: In November and December of 2003, the New Haven Fire Department administered oral and written exams
Raman Spectra of Chondrocytes in Cartilage: hyperspec s chondro data set
 Raman Spectra of Chondrocytes in Cartilage: hyperspec s chondro data set Claudia Beleites CENMAT and DI3, University of Trieste Spectroscopy Imaging, IPHT Jena e.v. February 13,
BIMM-143: INTRODUCTION TO BIOINFORMATICS (Lecture 5)
") BIMM-143: INTRODUCTION TO BIOINFORMATICS (Lecture 5) Data exploration and visualization in R https://bioboot.github.io/bimm143_w18/lectures/#5 Dr. Barry Grant Overview: One of the biggest attractions to
BIMM-143: INTRODUCTION TO BIOINFORMATICS (Lecture 5) Data exploration and visualization in R https://bioboot.github.io/bimm143_w18/lectures/#5 Dr. Barry Grant Overview: One of the biggest attractions to
Introduction Basics Simple Statistics Graphics. Using R for Data Analysis and Graphics. 4. Graphics
 Using R for Data Analysis and Graphics 4. Graphics Overview 4.1 Overview Several R graphics functions have been presented so far: > plot(d.sport[,"kugel"], d.sport[,"speer"], + xlab="ball push", ylab="javelin",
Making plots in R [things I wish someone told me when I started grad school]
![Making plots in R [things I wish someone told me when I started grad school]](/thumbs/94/119886540.jpg "Making plots in R [things I wish someone told me when I started grad school]") Making plots in R [things I wish someone told me when I started grad school] Kirk Lohmueller Department of Ecology and Evolutionary Biology UCLA September 22, 2017 In honor of Talk Like a Pirate Day...
Making plots in R [things I wish someone told me when I started grad school] Kirk Lohmueller Department of Ecology and Evolutionary Biology UCLA September 22, 2017 In honor of Talk Like a Pirate Day...
Preliminary Figures for Renormalizing Illumina SNP Cell Line Data
 Preliminary Figures for Renormalizing Illumina SNP Cell Line Data Kevin R. Coombes 17 March 2011 Contents 1 Executive Summary 1 1.1 Introduction......................................... 1 1.1.1 Aims/Objectives..................................
Package desplot. R topics documented: April 3, 2018
 Package desplot April 3, 2018 Title Plotting Field Plans for Agricultural Experiments Version 1.4 Date 2018-04-02 Type Package Description A function for plotting maps of agricultural field experiments
Package sciplot. February 15, 2013
 Package sciplot February 15, 2013 Version 1.1-0 Title Scientific Graphing Functions for Factorial Designs Author Manuel Morales , with code developed by the R Development Core Team
GS Analysis of Microarray Data
 GS01 0163 Analysis of Microarray Data Keith Baggerly and Kevin Coombes Section of Bioinformatics Department of Biostatistics and Applied Mathematics UT M. D. Anderson Cancer Center kabagg@mdanderson.org
Graphics in R STAT 133. Gaston Sanchez. Department of Statistics, UC Berkeley
 Graphics in R STAT 133 Gaston Sanchez Department of Statistics, UC Berkeley gastonsanchez.com github.com/gastonstat/stat133 Course web: gastonsanchez.com/stat133 Base Graphics 2 Graphics in R Traditional
Advanced Statistics 1. Lab 11 - Charts for three or more variables. Systems modelling and data analysis 2016/2017
 Advanced Statistics 1 Lab 11 - Charts for three or more variables 1 Preparing the data 1. Run RStudio Systems modelling and data analysis 2016/2017 2. Set your Working Directory using the setwd() command.
Exploring cdna Data. Achim Tresch, Andreas Buness, Wolfgang Huber, Tim Beißbarth
 Exploring cdna Data Achim Tresch, Andreas Buness, Wolfgang Huber, Tim Beißbarth Practical DNA Microarray Analysis http://compdiag.molgen.mpg.de/ngfn/pma0nov.shtml The following exercise will guide you
Short tutorial on studying module preservation: Preservation of female mouse liver modules in male data
 Short tutorial on studying module preservation: Preservation of female mouse liver modules in male data Peter Langfelder and Steve Horvath October 1, 0 Contents 1 Overview 1 1.a Setting up the R session............................................
Package MFDFA. April 18, 2018
 Type Package Title MultiFractal Detrended Fluctuation Analysis Version 1.0 Author Mohamed Laib [aut, cre], Luciano Telesca [aut], Mikhail Kanevski [aut] Package MFDFA April 18, 2018 Maintainer Mohamed
plot(seq(0,10,1), seq(0,10,1), main = "the Title", xlim=c(1,20), ylim=c(1,20), col="darkblue");
, seq(0,10,1), main = the Title, xlim=c(1,20), ylim=c(1,20), col=darkblue);") R for Biologists Day 3 Graphing and Making Maps with Your Data Graphing is a pretty convenient use for R, especially in Rstudio. plot() is the most generalized graphing function. If you give it all numeric
R for Biologists Day 3 Graphing and Making Maps with Your Data Graphing is a pretty convenient use for R, especially in Rstudio. plot() is the most generalized graphing function. If you give it all numeric
Importing and visualizing data in R. Day 3
 Importing and visualizing data in R Day 3 R data.frames Like pandas in python, R uses data frame (data.frame) object to support tabular data. These provide: Data input Row- and column-wise manipulation
The Basics of Plotting in R
 The Basics of Plotting in R R has a built-in Datasets Package: iris mtcars precip faithful state.x77 USArrests presidents ToothGrowth USJudgeRatings You can call built-in functions like hist() or plot()
An Introduction to R Graphics with examples
 An Introduction to R Graphics with examples Feng Li November 18, 2008 1 R graphics system A picture is worth a thousand words! The R graphics system can be broken into four distinct levels: graphics packages;
Basic Statistical Graphics in R. Stem and leaf plots 100,100,100,99,98,97,96,94,94,87,83,82,77,75,75,73,71,66,63,55,55,55,51,19
 Basic Statistical Graphics in R. Stem and leaf plots Example. Create a vector of data titled exam containing the following scores: 100,100,100,99,98,97,96,94,94,87,83,82,77,75,75,73,71,66,63,55,55,55,51,19
#1#set Working directory #2# Download packages: source(" bioclite("affy") library (affy)
 library (affy)") #1#set Working directory #2# Download packages: source("http://bioconductor.org/bioclite.r") bioclite("affy") library (affy) #3# Read the CEL files: Med
#1#set Working directory #2# Download packages: source("http://bioconductor.org/bioclite.r") bioclite("affy") library (affy) #3# Read the CEL files: Med
LAB #1: DESCRIPTIVE STATISTICS WITH R
 NAVAL POSTGRADUATE SCHOOL LAB #1: DESCRIPTIVE STATISTICS WITH R Statistics (OA3102) Lab #1: Descriptive Statistics with R Goal: Introduce students to various R commands for descriptive statistics. Lab
Statistics 251: Statistical Methods
 Statistics 251: Statistical Methods Summaries and Graphs in R Module R1 2018 file:///u:/documents/classes/lectures/251301/renae/markdown/master%20versions/summary_graphs.html#1 1/14 Summary Statistics
ArcGIS Desktop: Fundamentals of Cartography
 ArcGIS Desktop: Fundamentals of Cartography Outline Symbology Style Files -.style Layer files -.lyr Labeling Label Classes Label Expressions Map Document files -.mxd Map Template files -.mxt Map Elements
Visualizing in R advanced plotting
 Visualizing in R advanced plotting Norsk statistikermøte, Halden, 10. juni 2013 Elisabeth Orskaug Thordis Thorarinsdottir Norsk Regnesentral 1 / 22 Outline of the lectures Monday Lecture I: Basic plotting
Examples of implementation of pre-processing method described in paper with R code snippets - Electronic Supplementary Information (ESI)
") Electronic Supplementary Material (ESI) for Analyst. This journal is The Royal Society of Chemistry 2015 Examples of implementation of pre-processing method described in paper with R code snippets - Electronic
Electronic Supplementary Material (ESI) for Analyst. This journal is The Royal Society of Chemistry 2015 Examples of implementation of pre-processing method described in paper with R code snippets - Electronic
Visualizing the World
 Visualizing the World An Introduction to Visualization 15.071x The Analytics Edge Why Visualization? The picture-examining eye is the best finder we have of the wholly unanticipated -John Tukey Visualizing
Exploring cdna Data. Achim Tresch, Andreas Buness, Tim Beißbarth, Wolfgang Huber
 Exploring cdna Data Achim Tresch, Andreas Buness, Tim Beißbarth, Wolfgang Huber Practical DNA Microarray Analysis, Heidelberg, March 2005 http://compdiag.molgen.mpg.de/ngfn/pma2005mar.shtml The following
Recap From Last Time: Today s Learning Goals. Today s Learning Goals BIMM 143. Data visualization with R. Lecture 5. Barry Grant
 BIMM 143 Data visualization with R Lecture 5 Barry Grant http://thegrantlab.org/bimm143 Recap From Last Time: What is R and why should we use it? Familiarity with R s basic syntax. Familiarity with major
User manual forggsubplot
 User manual forggsubplot Garrett Grolemund September 3, 2012 1 Introduction ggsubplot expands the ggplot2 package to help users create multi-level plots, or embedded plots." Embedded plots embed subplots
Lab 3 - Part A. R Graphics Fundamentals & Scatter Plots
 Lab 3 - Part A R Graphics Fundamentals & Scatter Plots In this lab, you will learn how to generate customized publication-quality graphs in R. Working with R graphics can be done as a stepwise process.
Mixed models in R using the lme4 package Part 2: Lattice graphics
 Mixed models in R using the lme4 package Part 2: Lattice graphics Douglas Bates University of Wisconsin - Madison and R Development Core Team University of Lausanne July 1,
PyPlot. The plotting library must be imported, and we will assume in these examples an import statement similar to those for numpy and math as
 Geog 271 Geographic Data Analysis Fall 2015 PyPlot Graphicscanbeproducedin Pythonviaavarietyofpackages. We willuseapythonplotting package that is part of MatPlotLib, for which documentation can be found
Package Mondrian. R topics documented: March 4, Type Package
 Type Package Package Mondrian March 4, 2016 Title A Simple Graphical Representation of the Relative Occurrence and Co-Occurrence of Events The unique function of this package allows representing in a single
Package gains. September 12, 2017
 Package gains September 12, 2017 Version 1.2 Date 2017-09-08 Title Lift (Gains) Tables and Charts Author Craig A. Rolling Maintainer Craig A. Rolling Depends
Simulation studies of module preservation: Simulation study of weak module preservation
 Simulation studies of module preservation: Simulation study of weak module preservation Peter Langfelder and Steve Horvath October 25, 2010 Contents 1 Overview 1 1.a Setting up the R session............................................
Getting Started with VicMap
 Getting Started with VicMap This is a brief overview of some of the tools and features available on VicMap. At any time you can right click on the map and click Identify What s Here to find more information
Teaching univariate measures of location-using loss functions
 Original Article Teaching univariate measures of location-using loss functions Jon-Paul Paolino Department of Mathematics and Computer Sciences, Mercy College, Dobbs Ferry, 10522, NY USA e-mail: jpaolino@mercy.edu
Introduction to R Cmdr
 Introduction to R Cmdr MARS 6910 Spring 2015 David Hyrenbach Starting R Some Basic Unix Commands (http://cran.r-project.org/ doc/contrib/short-refcard.pdf) ls() show objects in search path; () default
Session 3: Cartography in ArcGIS. Mapping population data
 Exercise 3: Cartography in ArcGIS Mapping population data Background GIS is well known for its ability to produce high quality maps. ArcGIS provides useful tools that allow you to do this. It is important
Introduction to R for Beginners, Level II. Jeon Lee Bio-Informatics Core Facility (BICF), UTSW
, UTSW") Introduction to R for Beginners, Level II Jeon Lee Bio-Informatics Core Facility (BICF), UTSW Basics of R Powerful programming language and environment for statistical computing Useful for very basic analysis
Introduction to R for Beginners, Level II Jeon Lee Bio-Informatics Core Facility (BICF), UTSW Basics of R Powerful programming language and environment for statistical computing Useful for very basic analysis
Package EnQuireR. R topics documented: February 19, Type Package Title A package dedicated to questionnaires Version 0.
 Type Package Title A package dedicated to questionnaires Version 0.10 Date 2009-06-10 Package EnQuireR February 19, 2015 Author Fournier Gwenaelle, Cadoret Marine, Fournier Olivier, Le Poder Francois,
AN INTRODUCTION TO LATTICE GRAPHICS IN R
 AN INTRODUCTION TO LATTICE GRAPHICS IN R William G. Jacoby Michigan State University ICPSR Summer Program July 27-28, 2016 I. Introductory Thoughts about Lattice Graphics A. The lattice package 1. Created
R Graphics. Feng Li School of Statistics and Mathematics Central University of Finance and Economics
 R Graphics Feng Li feng.li@cufe.edu.cn School of Statistics and Mathematics Central University of Finance and Economics Revised on June 2, 2015 Today we are going to learn... 1 Basic R Graphical System
Using the CRM Pivot Tables
 Using the CRM Pivot Tables Pivot tables have now been added to your CRM system: we hope that these will provide you with an easy way to produce charts and graphs straight from your CRM, using the most
Working with Charts Stratum.Viewer 6
 Working with Charts Stratum.Viewer 6 Getting Started Tasks Additional Information Access to Charts Introduction to Charts Overview of Chart Types Quick Start - Adding a Chart to a View Create a Chart with
Exploring cdna Data. Achim Tresch, Andreas Buness, Tim Beißbarth, Wolfgang Huber
 Exploring cdna Data Achim Tresch, Andreas Buness, Tim Beißbarth, Wolfgang Huber Practical DNA Microarray Analysis http://compdiag.molgen.mpg.de/ngfn/pma0nov.shtml The following exercise will guide you
Package basictrendline
 Version 2.0.3 Date 2018-07-26 Package basictrendline July 26, 2018 Title Add Trendline and Confidence Interval of Basic Regression Models to Plot Maintainer Weiping Mei Plot, draw
Contents. Introduction 2
 R code for The human immune system is robustly maintained in multiple stable equilibriums shaped by age and cohabitation Vasiliki Lagou, on behalf of co-authors 18 September 2015 Contents Introduction
Graph tool instructions and R code
 Graph tool instructions and R code 1) Prepare data: tab-delimited format Data need to be inputted in a tab-delimited format. This can be easily achieved by preparing the data in a spread sheet program
ArcGIS Desktop: Making Maps in ArcMap
 ArcGIS Desktop: Making Maps in ArcMap California, Nevada, Hawaii Regional User Group February 6-8, 6 2008 Sacramento, CA Harry J. Moore IV Outline Symbology Style Files -.style Layer files -.lyr Labeling
Practice for Learning R and Learning Latex
 Practice for Learning R and Learning Latex Jennifer Pan August, 2011 Latex Environments A) Try to create the following equations: 1. 5+6 α = β2 2. P r( 1.96 Z 1.96) = 0.95 ( ) ( ) sy 1 r 2 3. ˆβx = r xy
Exploratory Data Analysis - Part 2 September 8, 2005
 Exploratory Data Analysis - Part 2 September 8, 2005 Exploratory Data Analysis - Part 2 p. 1/20 Trellis Plots Trellis plots (S-Plus) and Lattice plots in R also create layouts for multiple plots. A trellis
42 X : ] [ : 100 : ] III IV. [ Turn over
![42 X : ] [ : 100 : ] III IV. [ Turn over](/thumbs/95/126037406.jpg "42 X : ] [ : 100 : ] III IV. [ Turn over") B 2015 42 X : 30. 07. 2015 ] [ : 100 : 10-30 11-30 ] 1. 2. 3. 4. 5. I II III IV V [ Turn over Code No. 42 X 2 B Computer Examination, July, 2015 GRAPHIC DESIGNER COURSE ( Theory ) Time : 1 hour ] [ Max.
B 2015 42 X : 30. 07. 2015 ] [ : 100 : 10-30 11-30 ] 1. 2. 3. 4. 5. I II III IV V [ Turn over Code No. 42 X 2 B Computer Examination, July, 2015 GRAPHIC DESIGNER COURSE ( Theory ) Time : 1 hour ] [ Max.
42 X : ] [ : 100 : ] III IV. [ Turn over
![42 X : ] [ : 100 : ] III IV. [ Turn over](/thumbs/95/126037300.jpg "42 X : ] [ : 100 : ] III IV. [ Turn over") A 2015 42 X : 30. 07. 2015 ] [ : 100 : 10-30 11-30 ] 1. 2. 3. 4. 5. I II III IV V [ Turn over Code No. 42 X 2 A Computer Examination, July, 2015 GRAPHIC DESIGNER COURSE ( Theory ) Time : 1 hour ] [ Max.
A 2015 42 X : 30. 07. 2015 ] [ : 100 : 10-30 11-30 ] 1. 2. 3. 4. 5. I II III IV V [ Turn over Code No. 42 X 2 A Computer Examination, July, 2015 GRAPHIC DESIGNER COURSE ( Theory ) Time : 1 hour ] [ Max.
Package beanplot. R topics documented: February 19, Type Package
 Type Package Package beanplot February 19, 2015 Title Visualization via Beanplots (like Boxplot/Stripchart/Violin Plot) Version 1.2 Date 2014-09-15 Author Peter Kampstra Maintainer Peter Kampstra
Package rtsplot. September 15, 2018
 Tpe Package Title Time Series Plot Version 0.1.1 Package rtsplot September 15, 2018 A fast and elegant time series visualization package. In addition to the standard R plot tpes, this package supports
Page 1 of 16 CONTENTS:
 Page 1 of 16 CONTENTS: HOME-BOX -- (PG.2) o PROPERTY OWNERSHIP o ADDRESS SEARCH o I WANT TO AERIAL IMAGERY AND BASE MAPS -- (PG.2) o IMAGERY WITH LABELS ON/OFF o TOPOGRAPHY ON/OFF o TRANSPARENCY ZOOM IN
Designing effective scientific figures Introduction to Inkscape to finalise figures
 Designing effective scientific figures Introduction to Inkscape to finalise figures Aiora Zabala, based on slides by Simon Andrews and Boo Virk Please, find and click on this icon on your computer: What
SES123 Computer Methods Lab Procedures
 SES123 Computer Methods Lab Procedures Introduction Science and engineering commonly involve numerical calculations, graphs, photographic images, and various types of figures. In this lab, you will use
A (very) brief introduction to R
 brief introduction to R") A (very) brief introduction to R You typically start R at the command line prompt in a command line interface (CLI) mode. It is not a graphical user interface (GUI) although there are some efforts to produce
A (very) brief introduction to R You typically start R at the command line prompt in a command line interface (CLI) mode. It is not a graphical user interface (GUI) although there are some efforts to produce
PyPlot. The plotting library must be imported, and we will assume in these examples an import statement similar to those for numpy and math as
 Geog 271 Geographic Data Analysis Fall 2017 PyPlot Graphicscanbeproducedin Pythonviaavarietyofpackages. We willuseapythonplotting package that is part of MatPlotLib, for which documentation can be found
limma: A brief introduction to R
 limma: A brief introduction to R Natalie P. Thorne September 5, 2006 R basics i R is a command line driven environment. This means you have to type in commands (line-by-line) for it to compute or calculate
R Bootcamp Part I (B)
") R Bootcamp Part I (B) An R Script is available to make it easy for you to copy/paste all the tutorial commands into RStudio: http://statistics.uchicago.edu/~collins/rbootcamp/rbootcamp1b_rcode.r Preliminaries:
R Bootcamp Part I (B) An R Script is available to make it easy for you to copy/paste all the tutorial commands into RStudio: http://statistics.uchicago.edu/~collins/rbootcamp/rbootcamp1b_rcode.r Preliminaries:
APPM 2460 PLOTTING IN MATLAB
 APPM 2460 PLOTTING IN MATLAB. Introduction Matlab is great at crunching numbers, and one of the fundamental ways that we understand the output of this number-crunching is through visualization, or plots.
R Graph Essentials. Use R's powerful graphing capabilities to design and create professional-level graphics. David Alexander Lillis
 R Graph Essentials Use R's powerful graphing capabilities to design and create professional-level graphics David Alexander Lillis BIRMINGHAM - MUMBAI R Graph Essentials Copyright 2014 Packt Publishing
Making R Graphs, For People Who Don t Want To Learn R
 Making R Graphs, For People Who Don t Want To Learn R Richard Blissett I get it. You already know one statistical programming language, and the idea of having to learn another one just to make pretty pictures
Package harrypotter. September 3, 2018
 Type Package Package harrypotter September 3, 2018 Title Palettes Generated from All ``Harry Potter'' Movies Version 0.1.0 Maintainer Alejandro Jimenez Rico Description Implementation