Data Visualization (DSC 530/CIS )
|
|
|
- Naomi Bradford
- 5 years ago
- Views:
Transcription
1 Data Visualization (DSC 530/CIS 60-0) Isosurfaces & Volume Rendering Dr. David Koop
2 Fields & Grids Fields: - Values come from a continuous domain, infinitely many values - Sampled at certain positions to approximate the entire domain - Often measurements of natural or simulated phenomena - Examples: temperature, wind speed, tissue density, pressure, speed, electrical conductance Grids: geometry (positions) and topology (connections)
3 Fields & Grids Fields: - Values come from a continuous domain, infinitely many values - Sampled at certain positions to approximate the entire domain - Often measurements of natural or simulated phenomena - Examples: temperature, wind speed, tissue density, pressure, speed, electrical conductance Grids: geometry (positions) and topology (connections) uniform rectilinear structured unstructured [ Weiskopf/Machiraju/Möller]
4 Fields in Visualization Scalar Fields Vector Fields Tensor Fields (Order-0 Tensor Fields) (Order-1 Tensor Fields) (Order-+) Each point in space has an associated... s 0 4 v v 1 v Scalar Vector Tensor 3 5 3
5 What are different types of interpolation? Value at.? 4
6 Nearest Neighbor Interpolation Value at.? 5
7 Linear Interpolation Value at.? 6
8 Visualizing Volume (3D) Data D visualization slice images (or multi-planar reformating MPR) Indirect 3D visualization isosurfaces (or surface-shaded display SSD) Direct 3D visualization (direct volume rendering DVR) [ Weiskopf/Machiraju/Möller] 7


9 Visualizing Volume (3D) Data [J. Kniss, 00]
 Data [J.")
10 Visualizing Volume (3D) Data [J. Kniss, 00] 9
11 Project Designs Due April 7 April 17 Feedback soon Start thinking about ways to evolve the sketch or go in new directions based on more recent class discussions 3 Designs!= 3 Views - Want to see how your designs evolve, not three basic encodings Some inspiration: - University of Washington - Stanford University - University of Miami (more journalism-focused) 10
 Link a line chart for a state over the")
12 Assignment 4 Changing value + reordering interaction Brushing (linked highlighting) Link a line chart for a state over the years 11
13 How have we encoded 3D data before? Hint: Think about maps 1

14 Isolines (D) Isoline: a line that has the same scalar value at all locations Example: Topographical Map [USGS via Wikipedia] 13
15 Isosurfaces (3D) Isosurface: a surface that has the same scalar value at all locations Often use multiple isosurfaces to show different levels [J. Kniss, 00] 14
16 How? Given an isovalue, we want to draw the isocontours corresponding to that value Remember we only have values defined at grid points How do we get isolines or isosurfaces from that data? Can we use the ideas from interpolation? 15
17 Generating Isolines [R. Wenger, 013] 16
18 Generating Isolines [R. Wenger, 013] 17
19 Generating Isolines [R. Wenger, 013] 1
20 Generating Isolines [R. Wenger, 013] 19
21 Marching Squares [R. Wenger, 013] 0
22 Ambiguous Configurations There are some cases for which we cannot tell which way to draw the isolines 16 I II 16 I 16 II [R. Wenger, 013] 1
23 Ambiguous Configurations Either works for marching squares, this isn't the case for 3D [R. Wenger, 013]
24 3D: Marching Cubes Same idea, more cases [Lorensen and Cline, 197] # Positive Vertices 4A 4B 4C 4D 4E Zero Five 0 5A 5B 5C One Six 1 6A 6B 6C Two Seven A B C 7 Three Eight 3A 3B 3C Four 4A 4B 4C 4D 4E 4F [R. Wenger, 013] 3
25 Incompatible Choices If we have ambiguous cases where we choose differently for each cell, the surfaces will not match up correctly there are holes Fix with the asymptotic decider [Nielson and Hamann,1991] [R. Wenger, 013] 4
26 Marching Cubes Algorithm For each cell: - Classify each vertex as inside or outside (>=, <) 0 or 1 - Take the eight vertex classifications as a bit string - Use the bit string as a lookup into a table to get edges - Interpolate to get actual edge locations - Compute gradients - Resolve ambiguities Render a bunch of triangles: easy for graphics cards 5
27 Multiple Isosurfaces Topographical maps have multiple isolines to show elevation trends Problem in 3D? Occlusion Solution? Transparent surfaces Issues: - Think about color in order to make each surface visible - Compositing: how do colors "add up" with multiple surfaces - How to determine good isovalues? Next time: - Direct Volume Rendering [J. Kniss, 00] 6
 Direct 3D visualization (direct volume rendering DVR) [")
28 Visualizing Volume (3D) Data D visualization slice images (or multi-planar reformating MPR) Indirect 3D visualization isosurfaces (or surface-shaded display SSD) Direct 3D visualization (direct volume rendering DVR) [ Weiskopf/Machiraju/Möller] 7
 Direct volume rendered (b)")
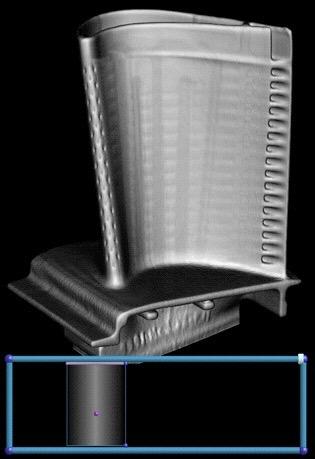
29 Volume Rendering vs. Isosurfacing (a) Direct volume rendered (b) Isosurface rendered [Kindlmann, 199]
30 (Direct) Volume Rendering Isosurfacing: compute a surface (triangles) and use standard computer graphics to render the triangles Volume rendering: compute the pixels shown directly from the volume information Why? - No need to figure out precise isosurface boundaries - Can work better for data with noise or uncertainty - Greater control over appearance based on values 9
31 Object Volume Ray Casting order approach Image Plane Data Set Eye [Levine] 30
32 Volume Ray Casting Image Plane Data Set Eye [Levine] 31
 Use trilinear interpolation Not the only possibility, also \"object order\" techniques like splatting or texture-based and combinations like shear-warp")
33 How? Approximate volume rendering integral: light absorption & emission Sample at regular intervals along each ray Trilinear interpolation: linear interpolation along each axes (x,y,z) Use trilinear interpolation Not the only possibility, also "object order" techniques like splatting or texture-based and combinations like shear-warp 3
34 Compositing Need one pixel from all of the values along the ray Q: How do we "add up" all of those values along the ray? A: Compositing! Different types of compositing - First: like isosurfacing, first intersection at a certain intensity - Max intensity: choose highest val - Average: mean intensity (density, like x-rays) - Accumulate: each voxel has some contribution intensity max intensity accumulate average first depth [Levine and Weiskopf/Machiraju/Möller] 33

35 Types of Compositing max intensity intensity accumulate average first depth [Levine and Weiskopf/Machiraju/Möller] 34
36 Types of Compositing max intensity intensity accumulate average first depth [Levine and Weiskopf/Machiraju/Möller] 35
37 Types of Compositing max intensity Synth intensity accumulate average first depth [Levine and Weiskopf/Machiraju/Möller] 36
38 Types of Compositing max intensity intensity accumulate average first depth [Levine and Weiskopf/Machiraju/Möller] 37
39 Accumulation If we're not just calculating a single number (max, average) or a position (first), how do we determine the accumulation? Assume each value has an associated color (c) and opacity (α) Over operator (back-to-front): - c = αf cf + (1-αf) αb cb - α = αf + (1-αf) αb Order is important! Blue Last Blue First 3

40 Transfer Functions Where do the colors and opacities come from? Idea is that each voxel emits/absorbs light based on its scalar value but users get to choose how that happens x-axis: color region definitions, y-axis: opacity α RGB Simp value [Kindlmann] 39
41 Transfer Function Design Transfer function design is non-trivial! Lots of tools to help visualization designers to create good transfer functions Histograms, more attributes than just value like gradient magnitude 40

42 Multidimensional Transfer Functions [Kniss] 41

43 Multidimensional Transfer Functions [Kniss] 4
Data Visualization (DSC 530/CIS )
") Data Visualization (DSC 530/CIS 60-01) Scalar Visualization Dr. David Koop Online JavaScript Resources http://learnjsdata.com/ Good coverage of data wrangling using JavaScript Fields in Visualization Scalar
Data Visualization (DSC 530/CIS 60-01) Scalar Visualization Dr. David Koop Online JavaScript Resources http://learnjsdata.com/ Good coverage of data wrangling using JavaScript Fields in Visualization Scalar
CIS 467/602-01: Data Visualization
 CIS 467/60-01: Data Visualization Isosurfacing and Volume Rendering Dr. David Koop Fields and Grids Fields: values come from a continuous domain, infinitely many values - Sampled at certain positions to
Data Visualization (CIS/DSC 468)
") Data Visualization (CIS/DSC 46) Volume Rendering Dr. David Koop Visualizing Volume (3D) Data 2D visualization slice images (or multi-planar reformating MPR) Indirect 3D visualization isosurfaces (or surface-shaded
Data Visualization (CIS/DSC 46) Volume Rendering Dr. David Koop Visualizing Volume (3D) Data 2D visualization slice images (or multi-planar reformating MPR) Indirect 3D visualization isosurfaces (or surface-shaded
Data Visualization (CIS/DSC 468)
") Data Visualization (CIS/DSC 468) Vector Visualization Dr. David Koop Visualizing Volume (3D) Data 2D visualization slice images (or multi-planar reformating MPR) Indirect 3D visualization isosurfaces (or
Data Visualization (CIS/DSC 468) Vector Visualization Dr. David Koop Visualizing Volume (3D) Data 2D visualization slice images (or multi-planar reformating MPR) Indirect 3D visualization isosurfaces (or
CIS 467/602-01: Data Visualization
 CIS 467/602-01: Data Visualization Vector Field Visualization Dr. David Koop Fields Tables Networks & Trees Fields Geometry Clusters, Sets, Lists Items Items (nodes) Grids Items Items Attributes Links
Scalar Data. Visualization Torsten Möller. Weiskopf/Machiraju/Möller
 Scalar Data Visualization Torsten Möller Weiskopf/Machiraju/Möller Overview Basic strategies Function plots and height fields Isolines Color coding Volume visualization (overview) Classification Segmentation
Scalar Data. CMPT 467/767 Visualization Torsten Möller. Weiskopf/Machiraju/Möller
 Scalar Data CMPT 467/767 Visualization Torsten Möller Weiskopf/Machiraju/Möller Overview Basic strategies Function plots and height fields Isolines Color coding Volume visualization (overview) Classification
Data Visualization (CIS/DSC 468)
") Data Visualization (CIS/DSC 468) Isosurfaces Dr. David Koop Data Wrangling Problem 1: Visualizations need data Solution: The Web: github, gists, cloud services Problem 2: Data has extra information I don't
Data Visualization (CIS/DSC 468) Isosurfaces Dr. David Koop Data Wrangling Problem 1: Visualizations need data Solution: The Web: github, gists, cloud services Problem 2: Data has extra information I don't
CIS 4930/ SCIENTIFICVISUALIZATION
 CIS 4930/6930-902 SCIENTIFICVISUALIZATION ISOSURFACING Paul Rosen Assistant Professor University of South Florida slides credits Tricoche and Meyer ADMINISTRATIVE Read (or watch video): Kieffer et al,
Indirect Volume Rendering
 Indirect Volume Rendering Visualization Torsten Möller Weiskopf/Machiraju/Möller Overview Contour tracing Marching cubes Marching tetrahedra Optimization octree-based range query Weiskopf/Machiraju/Möller
Volume Rendering - Introduction. Markus Hadwiger Visual Computing Center King Abdullah University of Science and Technology
 Volume Rendering - Introduction Markus Hadwiger Visual Computing Center King Abdullah University of Science and Technology Volume Visualization 2D visualization: slice images (or multi-planar reformation:
Volume Illumination, Contouring
 Volume Illumination, Contouring Computer Animation and Visualisation Lecture 0 tkomura@inf.ed.ac.uk Institute for Perception, Action & Behaviour School of Informatics Contouring Scaler Data Overview -
Visualization. Images are used to aid in understanding of data. Height Fields and Contours Scalar Fields Volume Rendering Vector Fields [chapter 26]
![Visualization. Images are used to aid in understanding of data. Height Fields and Contours Scalar Fields Volume Rendering Vector Fields [chapter 26]](/thumbs/74/70771954.jpg "Visualization. Images are used to aid in understanding of data. Height Fields and Contours Scalar Fields Volume Rendering Vector Fields [chapter 26]") Visualization Images are used to aid in understanding of data Height Fields and Contours Scalar Fields Volume Rendering Vector Fields [chapter 26] Tumor SCI, Utah Scientific Visualization Visualize large
Visualization Images are used to aid in understanding of data Height Fields and Contours Scalar Fields Volume Rendering Vector Fields [chapter 26] Tumor SCI, Utah Scientific Visualization Visualize large
Scalar Algorithms: Contouring
 Scalar Algorithms: Contouring Computer Animation and Visualisation Lecture tkomura@inf.ed.ac.uk Institute for Perception, Action & Behaviour School of Informatics Contouring Scaler Data Last Lecture...
Volume Visualization
 Volume Visualization Part 1 (out of 3) Overview: Volume Visualization Introduction to volume visualization On volume data Surface vs. volume rendering Overview: Techniques Simple methods Slicing, cuberille
Volume Visualization. Part 1 (out of 3) Volume Data. Where do the data come from? 3D Data Space How are volume data organized?
 Volume Data. Where do the data come from? 3D Data Space How are volume data organized?") Volume Data Volume Visualization Part 1 (out of 3) Where do the data come from? Medical Application Computed Tomographie (CT) Magnetic Resonance Imaging (MR) Materials testing Industrial-CT Simulation
Volume Data Volume Visualization Part 1 (out of 3) Where do the data come from? Medical Application Computed Tomographie (CT) Magnetic Resonance Imaging (MR) Materials testing Industrial-CT Simulation
Volume Rendering. Lecture 21
 Volume Rendering Lecture 21 Acknowledgements These slides are collected from many sources. A particularly valuable source is the IEEE Visualization conference tutorials. Sources from: Roger Crawfis, Klaus
5. Volume Visualization
 5. Volume Visualization Scalar volume data Medical Applications: CT, MRI, confocal microscopy, ultrasound, etc. 1 5. Volume Visualization 2 5. Volume Visualization 3 5. Volume Visualization Some possible
Lecture overview. Visualisatie BMT. Fundamental algorithms. Visualization pipeline. Structural classification - 1. Structural classification - 2
 Visualisatie BMT Fundamental algorithms Arjan Kok a.j.f.kok@tue.nl Lecture overview Classification of algorithms Scalar algorithms Vector algorithms Tensor algorithms Modeling algorithms 1 2 Visualization
Volume Illumination & Vector Field Visualisation
 Volume Illumination & Vector Field Visualisation Visualisation Lecture 11 Institute for Perception, Action & Behaviour School of Informatics Volume Illumination & Vector Vis. 1 Previously : Volume Rendering
Visualization Computer Graphics I Lecture 20
 15-462 Computer Graphics I Lecture 20 Visualization Height Fields and Contours Scalar Fields Volume Rendering Vector Fields [Angel Ch. 12] April 15, 2003 Frank Pfenning Carnegie Mellon University http://www.cs.cmu.edu/~fp/courses/graphics/
Height Fields and Contours Scalar Fields Volume Rendering Vector Fields [Angel Ch. 12] April 23, 2002 Frank Pfenning Carnegie Mellon University
![Height Fields and Contours Scalar Fields Volume Rendering Vector Fields [Angel Ch. 12] April 23, 2002 Frank Pfenning Carnegie Mellon University](/thumbs/90/102611276.jpg "Height Fields and Contours Scalar Fields Volume Rendering Vector Fields [Angel Ch. 12] April 23, 2002 Frank Pfenning Carnegie Mellon University") 15-462 Computer Graphics I Lecture 21 Visualization Height Fields and Contours Scalar Fields Volume Rendering Vector Fields [Angel Ch. 12] April 23, 2002 Frank Pfenning Carnegie Mellon University http://www.cs.cmu.edu/~fp/courses/graphics/
15-462 Computer Graphics I Lecture 21 Visualization Height Fields and Contours Scalar Fields Volume Rendering Vector Fields [Angel Ch. 12] April 23, 2002 Frank Pfenning Carnegie Mellon University http://www.cs.cmu.edu/~fp/courses/graphics/
11/1/13. Visualization. Scientific Visualization. Types of Data. Height Field. Contour Curves. Meshes
 CSCI 420 Computer Graphics Lecture 26 Visualization Height Fields and Contours Scalar Fields Volume Rendering Vector Fields [Angel Ch. 2.11] Jernej Barbic University of Southern California Scientific Visualization
Visualization. CSCI 420 Computer Graphics Lecture 26
 CSCI 420 Computer Graphics Lecture 26 Visualization Height Fields and Contours Scalar Fields Volume Rendering Vector Fields [Angel Ch. 11] Jernej Barbic University of Southern California 1 Scientific Visualization
Volume Illumination. Visualisation Lecture 11. Taku Komura. Institute for Perception, Action & Behaviour School of Informatics
 Volume Illumination Visualisation Lecture 11 Taku Komura Institute for Perception, Action & Behaviour School of Informatics Taku Komura Volume Illumination & Vector Vis. 1 Previously : Volume Rendering
Scalar Visualization
 Scalar Visualization Visualizing scalar data Popular scalar visualization techniques Color mapping Contouring Height plots outline Recap of Chap 4: Visualization Pipeline 1. Data Importing 2. Data Filtering
Visualization Computer Graphics I Lecture 20
 15-462 Computer Graphics I Lecture 20 Visualization Height Fields and Contours Scalar Fields Volume Rendering Vector Fields [Angel Ch. 12] November 20, 2003 Doug James Carnegie Mellon University http://www.cs.cmu.edu/~djames/15-462/fall03
Volume visualization. Volume visualization. Volume visualization methods. Sources of volume visualization. Sources of volume visualization
 Volume visualization Volume visualization Volumes are special cases of scalar data: regular 3D grids of scalars, typically interpreted as density values. Each data value is assumed to describe a cubic
Isosurface Rendering. CSC 7443: Scientific Information Visualization
 Isosurface Rendering What is Isosurfacing? An isosurface is the 3D surface representing the locations of a constant scalar value within a volume A surface with the same scalar field value Isosurfaces form
Raycasting. Ronald Peikert SciVis Raycasting 3-1
 Raycasting Ronald Peikert SciVis 2007 - Raycasting 3-1 Direct volume rendering Volume rendering (sometimes called direct volume rendering) stands for methods that generate images directly from 3D scalar
Scalar Visualization
 Scalar Visualization 5-1 Motivation Visualizing scalar data is frequently encountered in science, engineering, and medicine, but also in daily life. Recalling from earlier, scalar datasets, or scalar fields,
Scalar Data. Alark Joshi
 Scalar Data Alark Joshi Announcements Pick two papers to present Email me your top 3/4 choices. FIFO allotment Contact your clients Blog summaries: http://cs.boisestate.edu/~alark/cs564/participants.html
Direct Volume Rendering
 Direct Volume Rendering Visualization Torsten Möller Weiskopf/Machiraju/Möller Overview 2D visualization slice images (or multi-planar reformating MPR) Indirect 3D visualization isosurfaces (or surface-shaded
Direct Volume Rendering
 Direct Volume Rendering CMPT 467/767 Visualization Torsten Möller Weiskopf/Machiraju/Möller Overview Volume rendering equation Compositing schemes Ray casting Acceleration techniques for ray casting Texture-based
GPU-based Volume Rendering. Michal Červeňanský
 GPU-based Volume Rendering Michal Červeňanský Outline Volume Data Volume Rendering GPU rendering Classification Speed-up techniques Other techniques 2 Volume Data Describe interior structures Liquids,
Data Representation in Visualisation
 Data Representation in Visualisation Visualisation Lecture 4 Taku Komura Institute for Perception, Action & Behaviour School of Informatics Taku Komura Data Representation 1 Data Representation We have
Volume Rendering. Computer Animation and Visualisation Lecture 9. Taku Komura. Institute for Perception, Action & Behaviour School of Informatics
 Volume Rendering Computer Animation and Visualisation Lecture 9 Taku Komura Institute for Perception, Action & Behaviour School of Informatics Volume Rendering 1 Volume Data Usually, a data uniformly distributed
cs6630 November TRANSFER FUNCTIONS Alex Bigelow University of Utah
 cs6630 November 14 2014 TRANSFER FUNCTIONS Alex Bigelow University of Utah 1 cs6630 November 13 2014 TRANSFER FUNCTIONS Alex Bigelow University of Utah slide acknowledgements: Miriah Meyer, University
Volume Graphics Introduction
 High-Quality Volume Graphics on Consumer PC Hardware Volume Graphics Introduction Joe Kniss Gordon Kindlmann Markus Hadwiger Christof Rezk-Salama Rüdiger Westermann Motivation (1) Motivation (2) Scientific
Scientific Visualization. CSC 7443: Scientific Information Visualization
 Scientific Visualization Scientific Datasets Gaining insight into scientific data by representing the data by computer graphics Scientific data sources Computation Real material simulation/modeling (e.g.,
CSC Computer Graphics
 // CSC. Computer Graphics Lecture Kasun@dscs.sjp.ac.lk Department of Computer Science University of Sri Jayewardanepura Polygon Filling Scan-Line Polygon Fill Algorithm Span Flood-Fill Algorithm Inside-outside
Contouring and Isosurfaces. Ronald Peikert SciVis Contouring 2-1
 Contouring and Isosurfaces Ronald Peikert SciVis 2007 - Contouring 2-1 What are contours? Set of points where the scalar field s has a given value c: Examples in 2D: height contours on maps isobars on
Volume Illumination and Segmentation
 Volume Illumination and Segmentation Computer Animation and Visualisation Lecture 13 Institute for Perception, Action & Behaviour School of Informatics Overview Volume illumination Segmentation Volume
Solid Modeling. Michael Kazhdan ( /657) HB , FvDFH 12.1, 12.2, 12.6, 12.7 Marching Cubes, Lorensen et al.
 HB , FvDFH 12.1, 12.2, 12.6, 12.7 Marching Cubes, Lorensen et al.") Solid Modeling Michael Kazhdan (601.457/657) HB 10.15 10.17, 10.22 FvDFH 12.1, 12.2, 12.6, 12.7 Marching Cubes, Lorensen et al. 1987 Announcement OpenGL review session: When: Today @ 9:00 PM Where: Malone
Solid Modeling Michael Kazhdan (601.457/657) HB 10.15 10.17, 10.22 FvDFH 12.1, 12.2, 12.6, 12.7 Marching Cubes, Lorensen et al. 1987 Announcement OpenGL review session: When: Today @ 9:00 PM Where: Malone
Previously... contour or image rendering in 2D
 Volume Rendering Visualisation Lecture 10 Taku Komura Institute for Perception, Action & Behaviour School of Informatics Volume Rendering 1 Previously... contour or image rendering in 2D 2D Contour line
Scientific Visualization
 Scientific Visualization Dr. Ronald Peikert Summer 2007 Ronald Peikert SciVis 2007 - Introduction 1-1 Introduction to Scientific Visualization Ronald Peikert SciVis 2007 - Introduction 1-2 What is Scientific
Scientific Visualization Example exam questions with commented answers
 Scientific Visualization Example exam questions with commented answers The theoretical part of this course is evaluated by means of a multiple- choice exam. The questions cover the material mentioned during
Direct Volume Rendering
 Direct Volume Rendering Balázs Csébfalvi Department of Control Engineering and Information Technology Budapest University of Technology and Economics Classification of Visualization Algorithms Indirect
A Survey of Volumetric Visualization Techniques for Medical Images
 International Journal of Research Studies in Computer Science and Engineering (IJRSCSE) Volume 2, Issue 4, April 2015, PP 34-39 ISSN 2349-4840 (Print) & ISSN 2349-4859 (Online) www.arcjournals.org A Survey
Display. Introduction page 67 2D Images page 68. All Orientations page 69 Single Image page 70 3D Images page 71
 Display Introduction page 67 2D Images page 68 All Orientations page 69 Single Image page 70 3D Images page 71 Intersecting Sections page 71 Cube Sections page 72 Render page 73 1. Tissue Maps page 77
Direct Volume Rendering. Overview
 Direct Volume Rendering Department of Computer Science University of New Hampshire Durham, NH 03824 Based on: Brodlie and Wood, Recent Advances in Visualization of Volumetric Data, Eurographics 2000 State
Overview. Direct Volume Rendering. Volume Rendering Integral. Volume Rendering Integral Approximation
 Overview Direct Volume Rendering Department of Computer Science University of New Hampshire Durham, NH 03824 Based on: Brodlie and Wood, Recent Advances in Visualization of Volumetric Data, Eurographics
8. Tensor Field Visualization
 8. Tensor Field Visualization Tensor: extension of concept of scalar and vector Tensor data for a tensor of level k is given by t i1,i2,,ik (x 1,,x n ) Second-order tensor often represented by matrix Examples:
Isosurface Visualization of Data with Nonparametric Models for Uncertainty
 Isosurface Visualization of Data with Nonparametric Models for Uncertainty Tushar Athawale, Elham Sakhaee, and Alireza Entezari Department of Computer & Information Science & Engineering University of
Geometric Representations. Stelian Coros
 Geometric Representations Stelian Coros Geometric Representations Languages for describing shape Boundary representations Polygonal meshes Subdivision surfaces Implicit surfaces Volumetric models Parametric
Point based Rendering
 Point based Rendering CS535 Daniel Aliaga Current Standards Traditionally, graphics has worked with triangles as the rendering primitive Triangles are really just the lowest common denominator for surfaces
Lecture overview. Visualisatie BMT. Transparency. Transparency. Transparency. Transparency. Transparency Volume rendering Assignment
 Visualisatie BMT Lecture overview Assignment Arjan Kok a.j.f.kok@tue.nl 1 Makes it possible to see inside or behind objects Complement of transparency is opacity Opacity defined by alpha value with range
Computer Graphics Ray Casting. Matthias Teschner
 Computer Graphics Ray Casting Matthias Teschner Outline Context Implicit surfaces Parametric surfaces Combined objects Triangles Axis-aligned boxes Iso-surfaces in grids Summary University of Freiburg
Topology Preserving Tetrahedral Decomposition of Trilinear Cell
 Topology Preserving Tetrahedral Decomposition of Trilinear Cell Bong-Soo Sohn Department of Computer Engineering, Kyungpook National University Daegu 702-701, South Korea bongbong@knu.ac.kr http://bh.knu.ac.kr/
lecture 21 volume rendering - blending N layers - OpenGL fog (not on final exam) - transfer functions - rendering level surfaces
 - transfer functions - rendering level surfaces") lecture 21 volume rendering - blending N layers - OpenGL fog (not on final exam) - transfer functions - rendering level surfaces - 3D objects Clouds, fire, smoke, fog, and dust are difficult to model with
lecture 21 volume rendering - blending N layers - OpenGL fog (not on final exam) - transfer functions - rendering level surfaces - 3D objects Clouds, fire, smoke, fog, and dust are difficult to model with
Lecture notes: Object modeling
 Lecture notes: Object modeling One of the classic problems in computer vision is to construct a model of an object from an image of the object. An object model has the following general principles: Compact
Clipping. CSC 7443: Scientific Information Visualization
 Clipping Clipping to See Inside Obscuring critical information contained in a volume data Contour displays show only exterior visible surfaces Isosurfaces can hide other isosurfaces Other displays can
Multi-view Stereo. Ivo Boyadzhiev CS7670: September 13, 2011
 Multi-view Stereo Ivo Boyadzhiev CS7670: September 13, 2011 What is stereo vision? Generic problem formulation: given several images of the same object or scene, compute a representation of its 3D shape
Ray Casting on Programmable Graphics Hardware. Martin Kraus PURPL group, Purdue University
 Ray Casting on Programmable Graphics Hardware Martin Kraus PURPL group, Purdue University Overview Parallel volume rendering with a single GPU Implementing ray casting for a GPU Basics Optimizations Published
Fundamental Algorithms
 Fundamental Algorithms Fundamental Algorithms 3-1 Overview This chapter introduces some basic techniques for visualizing different types of scientific data sets. We will categorize visualization methods
Implicit Surfaces & Solid Representations COS 426
 Implicit Surfaces & Solid Representations COS 426 3D Object Representations Desirable properties of an object representation Easy to acquire Accurate Concise Intuitive editing Efficient editing Efficient
Hardware Accelerated Volume Visualization. Leonid I. Dimitrov & Milos Sramek GMI Austrian Academy of Sciences
 Hardware Accelerated Volume Visualization Leonid I. Dimitrov & Milos Sramek GMI Austrian Academy of Sciences A Real-Time VR System Real-Time: 25-30 frames per second 4D visualization: real time input of
4. Basic Mapping Techniques
 4. Basic Mapping Techniques Mapping from (filtered) data to renderable representation Most important part of visualization Possible visual representations: Position Size Orientation Shape Brightness Color
3/29/2016. Applications: Geology. Appliations: Medicine. Applications: Archeology. Applications: Klaus Engel Markus Hadwiger Christof Rezk Salama
 Tutorial 7 Real-Time Volume Graphics Real-Time Volume Graphics [01] Introduction and Theory Klaus Engel Markus Hadwiger Christof Rezk Salama Appliations: Medicine Applications: Geology Deformed Plasticine
Iso-surface cell search. Iso-surface Cells. Efficient Searching. Efficient search methods. Efficient iso-surface cell search. Problem statement:
 Iso-Contouring Advanced Issues Iso-surface cell search 1. Efficiently determining which cells to examine. 2. Using iso-contouring as a slicing mechanism 3. Iso-contouring in higher dimensions 4. Texturing
CS 5630/6630 Scientific Visualization. Volume Rendering I: Overview
 CS 5630/6630 Scientific Visualization Volume Rendering I: Overview Motivation Isosurfacing is limited It is binary A hard, distinct boundary is not always appropriate Slice Isosurface Volume Rendering
Mosaics. Today s Readings
 Mosaics VR Seattle: http://www.vrseattle.com/ Full screen panoramas (cubic): http://www.panoramas.dk/ Mars: http://www.panoramas.dk/fullscreen3/f2_mars97.html Today s Readings Szeliski and Shum paper (sections
Data Visualization (CIS/DSC 468)
") Data Visualization (CIS/DSC 468) Data & Tasks Dr. David Koop Programmatic SVG Example Draw a horizontal bar chart - var a = [6, 2, 6, 10, 7, 18, 0, 17, 20, 6]; Steps: - Programmatically create SVG - Create
Data Visualization (CIS/DSC 468) Data & Tasks Dr. David Koop Programmatic SVG Example Draw a horizontal bar chart - var a = [6, 2, 6, 10, 7, 18, 0, 17, 20, 6]; Steps: - Programmatically create SVG - Create
CS 5630/6630 Scientific Visualization. Volume Rendering III: Unstructured Grid Techniques
 CS 5630/6630 Scientific Visualization Volume Rendering III: Unstructured Grid Techniques Unstructured Grids Image-space techniques Ray-Casting Object-space techniques Projected Tetrahedra Hybrid Incremental
Announcements. Mosaics. How to do it? Image Mosaics
 Announcements Mosaics Project artifact voting Project 2 out today (help session at end of class) http://www.destination36.com/start.htm http://www.vrseattle.com/html/vrview.php?cat_id=&vrs_id=vrs38 Today
Rendering Smoke & Clouds
 Rendering Smoke & Clouds Game Design Seminar 2007 Jürgen Treml Talk Overview 1. Introduction to Clouds 2. Virtual Clouds based on physical Models 1. Generating Clouds 2. Rendering Clouds using Volume Rendering
Interactive Methods in Scientific Visualization
 Interactive Methods in Scientific Visualization GPU Volume Raycasting Christof Rezk-Salama University of Siegen, Germany Volume Rendering in a Nutshell Image Plane Eye Data Set Back-to-front iteration
Scalar Field Visualization. Some slices used by Prof. Mike Bailey
 Scalar Field Visualization Some slices used by Prof. Mike Bailey Scalar Fields The approximation of certain scalar function in space f(x,y,z). Most of time, they come in as some scalar values defined on
Announcements. Mosaics. Image Mosaics. How to do it? Basic Procedure Take a sequence of images from the same position =
 Announcements Project 2 out today panorama signup help session at end of class Today mosaic recap blending Mosaics Full screen panoramas (cubic): http://www.panoramas.dk/ Mars: http://www.panoramas.dk/fullscreen3/f2_mars97.html
Approximation of Isosurface in the Marching Cube: Ambiguity Problem.
 Approximation of Isosurface in the Marching Cube: Ambiguity Problem Sergey V Matveyev Computer Science Department Institute for High Energy Physics 142284, Protvino, Moscow Region, Russia E-mail: matveyev@desertihepsu
Level Set Extraction from Gridded 2D and 3D Data
 Level Set Extraction from Gridded 2D and 3D Data David Eberly, Geometric Tools, Redmond WA 98052 https://www.geometrictools.com/ This work is licensed under the Creative Commons Attribution 4.0 International
Who has worked on a voxel engine before? Who wants to? My goal is to give the talk I wish I would have had before I started on our procedural engine.
 1 Who has worked on a voxel engine before? Who wants to? My goal is to give the talk I wish I would have had before I started on our procedural engine. Three parts to this talk. A lot of content, so I
Surface Rendering. Surface Rendering
 Surface Rendering Surface Rendering Introduce Mapping Methods - Texture Mapping - Environmental Mapping - Bump Mapping Go over strategies for - Forward vs backward mapping 2 1 The Limits of Geometric Modeling
Volume Visualiza0on. Today s Class. Grades & Homework feedback on Homework Submission Server
 11/3/14 Volume Visualiza0on h3p://imgur.com/trjonqk h3p://i.imgur.com/zcjc9kp.jpg Today s Class Grades & Homework feedback on Homework Submission Server Everything except HW4 (didn t get to that yet) &
Deferred Rendering Due: Wednesday November 15 at 10pm
 CMSC 23700 Autumn 2017 Introduction to Computer Graphics Project 4 November 2, 2017 Deferred Rendering Due: Wednesday November 15 at 10pm 1 Summary This assignment uses the same application architecture
Introduction to 3D Graphics
 Graphics Without Polygons Volume Rendering May 11, 2010 So Far Volumetric Rendering Techniques Misc. So Far Extended the Fixed Function Pipeline with a Programmable Pipeline Programming the pipeline is
Introduction to Scientific Visualization
 Visualization Definition Introduction to Scientific Visualization Stefan Bruckner visualization: to form a mental vision, image, or picture of (something not visible or present to the sight, or of an abstraction);
MARCHING CUBES AND VARIANTS
 CHAPTER MARCHING CUBES AND VARIANTS In the introduction, we mentioned four different approaches to isosurface construction. In this chapter, we describe one of those approaches to isosurface construction,
Scalar Field Visualization I
 Scalar Field Visualization I What is a Scalar Field? The approximation of certain scalar function in space f(x,y,z). Image source: blimpyb.com f What is a Scalar Field? The approximation of certain scalar
Multidimensional Transfer Functions in Volume Rendering of Medical Datasets. Master thesis. Tor Øyvind Fluør
 UNIVERSITY OF OSLO Department of Informatics Multidimensional Transfer Functions in Volume Rendering of Medical Datasets Master thesis Tor Øyvind Fluør February 2006 Abstract In volume rendering, transfer
CSE 167: Lecture #17: Volume Rendering. Jürgen P. Schulze, Ph.D. University of California, San Diego Fall Quarter 2012
 CSE 167: Introduction to Computer Graphics Lecture #17: Volume Rendering Jürgen P. Schulze, Ph.D. University of California, San Diego Fall Quarter 2012 Announcements Thursday, Dec 13: Final project presentations
Hot Topics in Visualization
 Hot Topic 1: Illustrative visualization 12 Illustrative visualization: computer supported interactive and expressive visualizations through abstractions as in traditional illustrations. Hot Topics in Visualization
Marching Squares Algorithm. Can you summarize the marching squares algorithm based on what we just discussed?
 Marching Squares Algorithm Can you summarize the marching squares algorithm based on what we just discussed? Marching Squares Algorithm Can you summarize the marching squares algorithm based on what we
New Method for Opacity Correction in Oversampled Volume Ray Casting
 New Method for Opacity Correction in Oversampled Volume Ray Casting Jong Kwan Lee Department of Computer Science University of Alabama in Huntsville Huntsville, AL 35899 USA jlee@cs.uah.edu Timothy S.
CS 4620 Midterm, March 21, 2017
 CS 460 Midterm, March 1, 017 This 90-minute exam has 4 questions worth a total of 100 points. Use the back of the pages if you need more space. Academic Integrity is expected of all students of Cornell
Project Updates Short lecture Volumetric Modeling +2 papers
 Volumetric Modeling Schedule (tentative) Feb 20 Feb 27 Mar 5 Introduction Lecture: Geometry, Camera Model, Calibration Lecture: Features, Tracking/Matching Mar 12 Mar 19 Mar 26 Apr 2 Apr 9 Apr 16 Apr 23
Visualizer An implicit surface rendering application
 June 01, 2004 Visualizer An implicit surface rendering application Derek Gerstmann - C1405511 MSc Computer Animation NCCA Bournemouth University OVERVIEW OF APPLICATION Visualizer is an interactive application
Hot Topics in Visualization. Ronald Peikert SciVis Hot Topics 12-1
 Hot Topics in Visualization Ronald Peikert SciVis 2007 - Hot Topics 12-1 Hot Topic 1: Illustrative visualization Illustrative visualization: computer supported interactive and expressive visualizations
Shear-Warp Volume Rendering. Volume Rendering Overview
 Shear-Warp Volume Rendering R. Daniel Bergeron Department of Computer Science University of New Hampshire Durham, NH 03824 From: Lacroute and Levoy, Fast Volume Rendering Using a Shear-Warp- Factorization
Course Review. Computer Animation and Visualisation. Taku Komura
 Course Review Computer Animation and Visualisation Taku Komura Characters include Human models Virtual characters Animal models Representation of postures The body has a hierarchical structure Many types