CIS 4930/ SCIENTIFICVISUALIZATION
|
|
|
- Jesse Norris
- 5 years ago
- Views:
Transcription


1 CIS 4930/ SCIENTIFICVISUALIZATION ISOSURFACING Paul Rosen Assistant Professor University of South Florida slides credits Tricoche and Meyer
2 ADMINISTRATIVE Read (or watch video): Kieffer et al, HOLA: Human-like Orthogonal Network Layout [InfoVis 2015 Best Paper]
3 TODAY visualization for scalar fields pseudocoloring isocurves with marching squares isosurfacing with marching cubes
 Direct 3D visualization (direct volume rendering")
4 Weiskopf/Machiraju/Möller 19 2D visualization slice images (or multi-planar reformating MPR) Indirect 3D visualization isosurfaces (or surface-shaded display SSD) Direct 3D visualization (direct volume rendering DVR)

5 In Visualization, we Use the Concept of a Transfer Function to set Color as a Function of Scalar Value Scalar values ->[0,1] -> Colors In OpenGL, the mapping of 1D texture
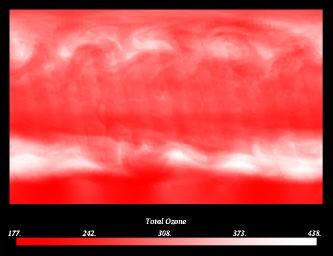
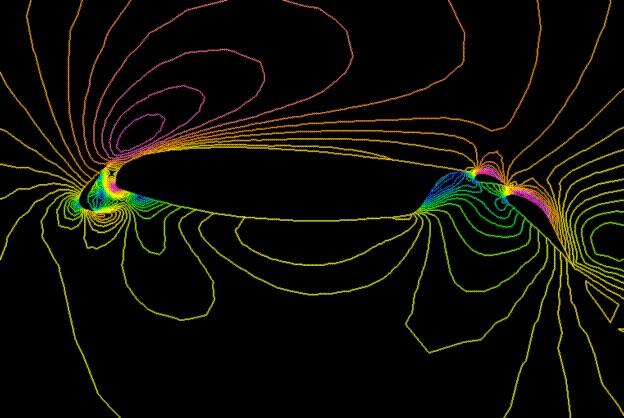
6 USE THE RIGHT TRANSFER FUNCTION COLOR SCALE TO REPRESENT A RANGE OF SCALAR VALUES Gray scale Intensity Interpolation Saturation interpolation Two-color interpolation Rainbow scale Heated object interpolation Blue-White-Red

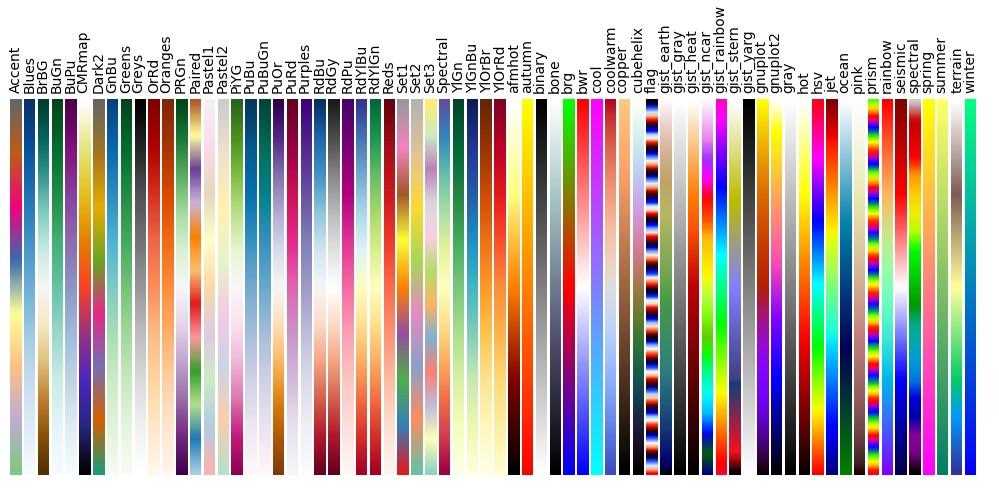
7 A GALLERY OF COLOR SCALES
8 GREY SCALE.
9 SATURATION SCALE.

10 SPECTRUM SCALE.

11 LIMITED SPECTRUM SCALE.
12 REDUNDANT HUE/LIGHTNESS SCALE.
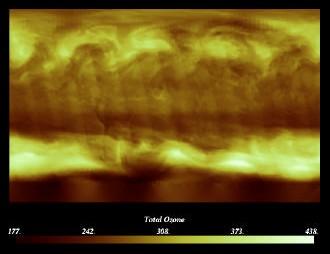
13 HEATED-OBJECT SCALE.

14 Other examples 35
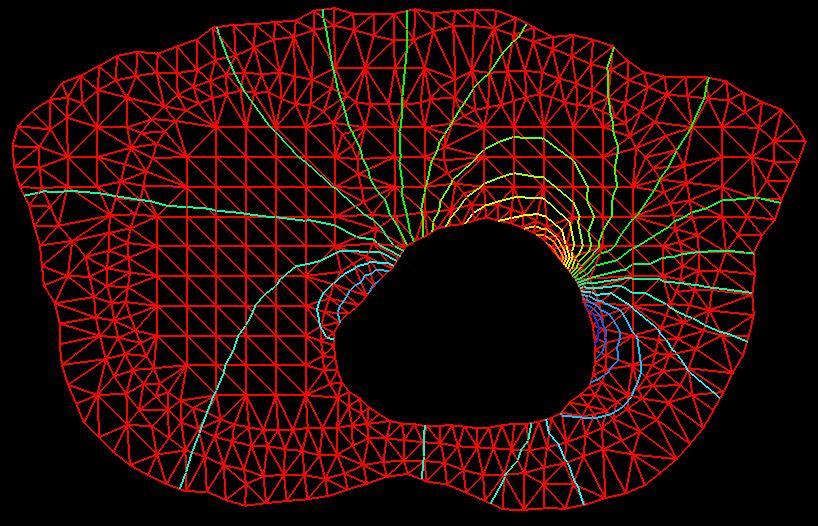
15 ISOCONTOURS IN 2D

16 PROCESS Get cell Identify grid lines w/cross Find crossings Draw x x Primitives naturally chain together + -
17 SIMPLER TO IMPLEMENT PROCESS check each corner above or below isovalue assign bit 0/1 4-bit string describes a particular case

18 2D SCALAR VISUALIZATION 16 possible marching squares reduce to 5 symmetric cases or 4 topological cases 18
19 x x x x x x x x x x x x
20 what is the isocontour for isovalue = 4? 5x5 grid

21 2D Scalar Visualization 21
22 IN 3D: ISOSURFACES 22
23 Weiskopf/Machiraju/Möller 19 2D visualization slice images (or multi-planar reformating MPR) Indirect 3D visualization isosurfaces (or surface-shaded display SSD) Direct 3D visualization (direct volume rendering DVR)
24 MARCHING CUBES Predominant method used today Efficient and simple Independently reported by Wyvill and McPeeters in 1986, Lorenson and Cline in 1987 Patented in 1987 by Lorenson and Cline 24
25 MARCHING CUBES 3D generalization of isocontours Treat each cube individually No 2D contour curves Allow intersections only on the edges or at vertices Pre-calculate all of the necessary information to construct a surface 25


26 MARCHING CUBES Linear search through cells Trivially parallelizable Row by row, layer by layer No neighborhood information is required 26
27 MARCHING CUBES Consider a single cube Three cases: All vertices above the contour threshold All vertices below Mixed above and below 27
28 MARCHING CUBES Binary label each node (above or below) Examine all possible cases of above or below for each vertex 28

29 MARCHING CUBES Now we have 8 vertices Thus, 2 8 = 256 cases How many unique topological cases? 29

30 CASE REDUCTION Value symmetry 30

31 CASE REDUCTION Rotation symmetry 31

32 CASE REDUCTION Mirror symmetry By inspection, we can reduce 256 cases to only 15 32
33 MARCHING CUBES CASES 33
34 MARCHING CUBES SUMMARY Basic Marching Cubes algorithm: 2. Classify 1. Create a cube each voxel (volume element) 3. Build an index 4. Lookup edge list 5. Interpolate triangle vertices 6. Calculate normals 34
35 STEP 1: CREATE A CUBE Consider a cube defined by eight data values Four values from slice and four from neighbor 35
36 STEP 2: CLASSIFY EACH VOXEL Binary classify each vertex of the cube as to whether it lies Outside the surface voxel value > isosurface value Inside the surface voxel value <= isosurface value 36
37 CLASSIFICATION EXAMPLE 37
38 STEP 3: BUILD AN INDEX Use the binary labeling of each voxel to create an 8- bit index (8 vertices 256 cases) 38


39 STEP 4: LOOKUP EDGE LIST 39
40 STEP 5: INTERPOLATE TRIANGLE VERTICES For each edge Find the vertex location along the edge by using linear interpolation of the voxel values 40
41 STEP 6: COMPUTE NORMALS Calculate the normal at each cube vertex Linearly interpolate the polygon vertex normal Renormalize after interpolation 41

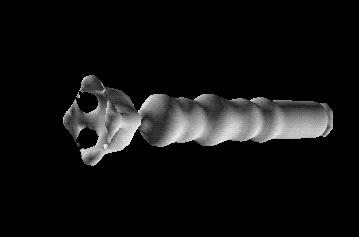


42 EXAMPLES 1 Isosurface 3 Isosurfaces 2 Isosurfaces


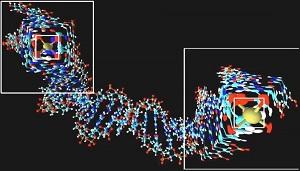
43 ENHANCING ISOSURFACING Can add information about additional variables Here, two additional variables control the color 43
44 CHALLENGES what is a good isovalue? ambiguities poorly shaped, nonadaptive triangles gaps between neighboring points looking at every voxel 73
45 MARCHING CUBES SPEEDUP Expensive to search each grid cell Use a MinMax Octree to ignore cells outside the isovalue range 45
46 MINMAX OCTREE BUILDING THE STRUCTURE Create an octree structure for the voxels of the volume In each node store the minimum and maximum isovalues of the children 46
47 MINMAX OCTREE BUILDING THE ISOSURFACE Begin at the root node If min <= isovalue <= max Recurse to the next level of the tree Otherwise Terminate search 47
48 MINMAX OCTREE PERFORMANCE ANALYSIS WORST-CASE PERFORMANCE? O(n log n) or O(nh), where n is the number of voxels and h is the tree height When all voxels cross the isovalue EXPECTED PERFORMANCE? O(k log n) or O(kh), where k is the number of voxels with geometry USUALLY K<<N, MAKING THIS METHOD QUITE EFFICIENT
49 BIGGEST LIMITATION OF ISOSURFACING? 49

50 BIGGEST LIMITATION OF ISOSURFACING? 50


51 Volume Rendering 51
52
Indirect Volume Rendering
 Indirect Volume Rendering Visualization Torsten Möller Weiskopf/Machiraju/Möller Overview Contour tracing Marching cubes Marching tetrahedra Optimization octree-based range query Weiskopf/Machiraju/Möller
Data Visualization (DSC 530/CIS )
") Data Visualization (DSC 530/CIS 60-0) Isosurfaces & Volume Rendering Dr. David Koop Fields & Grids Fields: - Values come from a continuous domain, infinitely many values - Sampled at certain positions
Data Visualization (DSC 530/CIS 60-0) Isosurfaces & Volume Rendering Dr. David Koop Fields & Grids Fields: - Values come from a continuous domain, infinitely many values - Sampled at certain positions
CIS 467/602-01: Data Visualization
 CIS 467/60-01: Data Visualization Isosurfacing and Volume Rendering Dr. David Koop Fields and Grids Fields: values come from a continuous domain, infinitely many values - Sampled at certain positions to
Data Visualization (DSC 530/CIS )
") Data Visualization (DSC 530/CIS 60-01) Scalar Visualization Dr. David Koop Online JavaScript Resources http://learnjsdata.com/ Good coverage of data wrangling using JavaScript Fields in Visualization Scalar
Data Visualization (DSC 530/CIS 60-01) Scalar Visualization Dr. David Koop Online JavaScript Resources http://learnjsdata.com/ Good coverage of data wrangling using JavaScript Fields in Visualization Scalar
Scalar Algorithms: Contouring
 Scalar Algorithms: Contouring Computer Animation and Visualisation Lecture tkomura@inf.ed.ac.uk Institute for Perception, Action & Behaviour School of Informatics Contouring Scaler Data Last Lecture...
Scalar Field Visualization I
 Scalar Field Visualization I What is a Scalar Field? The approximation of certain scalar function in space f(x,y,z). Image source: blimpyb.com f What is a Scalar Field? The approximation of certain scalar
Data Visualization (CIS/DSC 468)
") Data Visualization (CIS/DSC 46) Volume Rendering Dr. David Koop Visualizing Volume (3D) Data 2D visualization slice images (or multi-planar reformating MPR) Indirect 3D visualization isosurfaces (or surface-shaded
Data Visualization (CIS/DSC 46) Volume Rendering Dr. David Koop Visualizing Volume (3D) Data 2D visualization slice images (or multi-planar reformating MPR) Indirect 3D visualization isosurfaces (or surface-shaded
Scalar Visualization
 Scalar Visualization Visualizing scalar data Popular scalar visualization techniques Color mapping Contouring Height plots outline Recap of Chap 4: Visualization Pipeline 1. Data Importing 2. Data Filtering
Scalar Data. Visualization Torsten Möller. Weiskopf/Machiraju/Möller
 Scalar Data Visualization Torsten Möller Weiskopf/Machiraju/Möller Overview Basic strategies Function plots and height fields Isolines Color coding Volume visualization (overview) Classification Segmentation
Scalar Field Visualization I
 Scalar Field Visualization I What is a Scalar Field? The approximation of certain scalar function in space f(x,y,z). Image source: blimpyb.com f What is a Scalar Field? The approximation of certain scalar
Lecture overview. Visualisatie BMT. Fundamental algorithms. Visualization pipeline. Structural classification - 1. Structural classification - 2
 Visualisatie BMT Fundamental algorithms Arjan Kok a.j.f.kok@tue.nl Lecture overview Classification of algorithms Scalar algorithms Vector algorithms Tensor algorithms Modeling algorithms 1 2 Visualization
Contouring and Isosurfaces. Ronald Peikert SciVis Contouring 2-1
 Contouring and Isosurfaces Ronald Peikert SciVis 2007 - Contouring 2-1 What are contours? Set of points where the scalar field s has a given value c: Examples in 2D: height contours on maps isobars on
Scalar Visualization
 Scalar Visualization 5-1 Motivation Visualizing scalar data is frequently encountered in science, engineering, and medicine, but also in daily life. Recalling from earlier, scalar datasets, or scalar fields,
Isosurface Rendering. CSC 7443: Scientific Information Visualization
 Isosurface Rendering What is Isosurfacing? An isosurface is the 3D surface representing the locations of a constant scalar value within a volume A surface with the same scalar field value Isosurfaces form
Scientific Visualization. CSC 7443: Scientific Information Visualization
 Scientific Visualization Scientific Datasets Gaining insight into scientific data by representing the data by computer graphics Scientific data sources Computation Real material simulation/modeling (e.g.,
Iso-surface cell search. Iso-surface Cells. Efficient Searching. Efficient search methods. Efficient iso-surface cell search. Problem statement:
 Iso-Contouring Advanced Issues Iso-surface cell search 1. Efficiently determining which cells to examine. 2. Using iso-contouring as a slicing mechanism 3. Iso-contouring in higher dimensions 4. Texturing
Volume Illumination, Contouring
 Volume Illumination, Contouring Computer Animation and Visualisation Lecture 0 tkomura@inf.ed.ac.uk Institute for Perception, Action & Behaviour School of Informatics Contouring Scaler Data Overview -
Scalar Data. CMPT 467/767 Visualization Torsten Möller. Weiskopf/Machiraju/Möller
 Scalar Data CMPT 467/767 Visualization Torsten Möller Weiskopf/Machiraju/Möller Overview Basic strategies Function plots and height fields Isolines Color coding Volume visualization (overview) Classification
CSC Computer Graphics
 // CSC. Computer Graphics Lecture Kasun@dscs.sjp.ac.lk Department of Computer Science University of Sri Jayewardanepura Polygon Filling Scan-Line Polygon Fill Algorithm Span Flood-Fill Algorithm Inside-outside
Who has worked on a voxel engine before? Who wants to? My goal is to give the talk I wish I would have had before I started on our procedural engine.
 1 Who has worked on a voxel engine before? Who wants to? My goal is to give the talk I wish I would have had before I started on our procedural engine. Three parts to this talk. A lot of content, so I
Polygonization of Implicit Surfaces
 Polygonization of Implicit Surfaces Hongxin Zhang and Jieqing Feng 2007-01-11 State Key Lab of CAD&CG Zhejiang University Contents Polygonization of Implicit Surfaces Other Methods for Displaying Implicit
Volume Rendering - Introduction. Markus Hadwiger Visual Computing Center King Abdullah University of Science and Technology
 Volume Rendering - Introduction Markus Hadwiger Visual Computing Center King Abdullah University of Science and Technology Volume Visualization 2D visualization: slice images (or multi-planar reformation:
Visualization. Images are used to aid in understanding of data. Height Fields and Contours Scalar Fields Volume Rendering Vector Fields [chapter 26]
![Visualization. Images are used to aid in understanding of data. Height Fields and Contours Scalar Fields Volume Rendering Vector Fields [chapter 26]](/thumbs/74/70771954.jpg "Visualization. Images are used to aid in understanding of data. Height Fields and Contours Scalar Fields Volume Rendering Vector Fields [chapter 26]") Visualization Images are used to aid in understanding of data Height Fields and Contours Scalar Fields Volume Rendering Vector Fields [chapter 26] Tumor SCI, Utah Scientific Visualization Visualize large
Visualization Images are used to aid in understanding of data Height Fields and Contours Scalar Fields Volume Rendering Vector Fields [chapter 26] Tumor SCI, Utah Scientific Visualization Visualize large
Marching Cubes Robert Hunt CS 525. Introduction
 Marching Cubes Robert Hunt CS 525 Introduction The Marching Cubes algorithm is a method for visualizing a conceptual surface called an isosurface. An isosurface is formed from a set of points in 3 space
Isosurface Visualization of Data with Nonparametric Models for Uncertainty
 Isosurface Visualization of Data with Nonparametric Models for Uncertainty Tushar Athawale, Elham Sakhaee, and Alireza Entezari Department of Computer & Information Science & Engineering University of
Scientific Visualization Example exam questions with commented answers
 Scientific Visualization Example exam questions with commented answers The theoretical part of this course is evaluated by means of a multiple- choice exam. The questions cover the material mentioned during
Scalar Field Visualization. Some slices used by Prof. Mike Bailey
 Scalar Field Visualization Some slices used by Prof. Mike Bailey Scalar Fields The approximation of certain scalar function in space f(x,y,z). Most of time, they come in as some scalar values defined on
Scalar Algorithms -- surfaces
 Scalar Algorithms -- surfaces Color Mapping Slicing Clipping Contouring / iso-surface 1 Sources of Scalar Data Sensors CT/MRI Surface Scanners: laser/range scans Simulations CFD/FEM Mathematical Implicit
Level Set Extraction from Gridded 2D and 3D Data
 Level Set Extraction from Gridded 2D and 3D Data David Eberly, Geometric Tools, Redmond WA 98052 https://www.geometrictools.com/ This work is licensed under the Creative Commons Attribution 4.0 International
CSE 554 Lecture 5: Contouring (faster)
") CSE 554 Lecture 5: Contouring (faster) Fall 2016 CSE554 Contouring II Slide 1 Review Iso-contours Points where a function evaluates to be a given value (iso-value) Smooth thresholded boundaries Contouring
CSE 554 Lecture 5: Contouring (faster) Fall 2016 CSE554 Contouring II Slide 1 Review Iso-contours Points where a function evaluates to be a given value (iso-value) Smooth thresholded boundaries Contouring
MARCHING CUBES AND VARIANTS
 CHAPTER MARCHING CUBES AND VARIANTS In the introduction, we mentioned four different approaches to isosurface construction. In this chapter, we describe one of those approaches to isosurface construction,
Geometric Representations. Stelian Coros
 Geometric Representations Stelian Coros Geometric Representations Languages for describing shape Boundary representations Polygonal meshes Subdivision surfaces Implicit surfaces Volumetric models Parametric
Topology Preserving Tetrahedral Decomposition of Trilinear Cell
 Topology Preserving Tetrahedral Decomposition of Trilinear Cell Bong-Soo Sohn Department of Computer Engineering, Kyungpook National University Daegu 702-701, South Korea bongbong@knu.ac.kr http://bh.knu.ac.kr/
9. Three Dimensional Object Representations
 9. Three Dimensional Object Representations Methods: Polygon and Quadric surfaces: For simple Euclidean objects Spline surfaces and construction: For curved surfaces Procedural methods: Eg. Fractals, Particle
Lecture notes: Object modeling
 Lecture notes: Object modeling One of the classic problems in computer vision is to construct a model of an object from an image of the object. An object model has the following general principles: Compact
coding of various parts showing different features, the possibility of rotation or of hiding covering parts of the object's surface to gain an insight
 Three-Dimensional Object Reconstruction from Layered Spatial Data Michael Dangl and Robert Sablatnig Vienna University of Technology, Institute of Computer Aided Automation, Pattern Recognition and Image
5. Volume Visualization
 5. Volume Visualization Scalar volume data Medical Applications: CT, MRI, confocal microscopy, ultrasound, etc. 1 5. Volume Visualization 2 5. Volume Visualization 3 5. Volume Visualization Some possible
11/1/13. Visualization. Scientific Visualization. Types of Data. Height Field. Contour Curves. Meshes
 CSCI 420 Computer Graphics Lecture 26 Visualization Height Fields and Contours Scalar Fields Volume Rendering Vector Fields [Angel Ch. 2.11] Jernej Barbic University of Southern California Scientific Visualization
Visualization. CSCI 420 Computer Graphics Lecture 26
 CSCI 420 Computer Graphics Lecture 26 Visualization Height Fields and Contours Scalar Fields Volume Rendering Vector Fields [Angel Ch. 11] Jernej Barbic University of Southern California 1 Scientific Visualization
Multi-View Matching & Mesh Generation. Qixing Huang Feb. 13 th 2017
 Multi-View Matching & Mesh Generation Qixing Huang Feb. 13 th 2017 Geometry Reconstruction Pipeline RANSAC --- facts Sampling Feature point detection [Gelfand et al. 05, Huang et al. 06] Correspondences
CS 4620 Midterm, March 21, 2017
 CS 460 Midterm, March 1, 017 This 90-minute exam has 4 questions worth a total of 100 points. Use the back of the pages if you need more space. Academic Integrity is expected of all students of Cornell
4. Basic Mapping Techniques
 4. Basic Mapping Techniques Mapping from (filtered) data to renderable representation Most important part of visualization Possible visual representations: Position Size Orientation Shape Brightness Color
Data Visualization (CIS/DSC 468)
") Data Visualization (CIS/DSC 468) Vector Visualization Dr. David Koop Visualizing Volume (3D) Data 2D visualization slice images (or multi-planar reformating MPR) Indirect 3D visualization isosurfaces (or
Data Visualization (CIS/DSC 468) Vector Visualization Dr. David Koop Visualizing Volume (3D) Data 2D visualization slice images (or multi-planar reformating MPR) Indirect 3D visualization isosurfaces (or
Volume Visualization. Part 1 (out of 3) Volume Data. Where do the data come from? 3D Data Space How are volume data organized?
 Volume Data. Where do the data come from? 3D Data Space How are volume data organized?") Volume Data Volume Visualization Part 1 (out of 3) Where do the data come from? Medical Application Computed Tomographie (CT) Magnetic Resonance Imaging (MR) Materials testing Industrial-CT Simulation
Volume Data Volume Visualization Part 1 (out of 3) Where do the data come from? Medical Application Computed Tomographie (CT) Magnetic Resonance Imaging (MR) Materials testing Industrial-CT Simulation
Visualization Computer Graphics I Lecture 20
 15-462 Computer Graphics I Lecture 20 Visualization Height Fields and Contours Scalar Fields Volume Rendering Vector Fields [Angel Ch. 12] April 15, 2003 Frank Pfenning Carnegie Mellon University http://www.cs.cmu.edu/~fp/courses/graphics/
Height Fields and Contours Scalar Fields Volume Rendering Vector Fields [Angel Ch. 12] April 23, 2002 Frank Pfenning Carnegie Mellon University
![Height Fields and Contours Scalar Fields Volume Rendering Vector Fields [Angel Ch. 12] April 23, 2002 Frank Pfenning Carnegie Mellon University](/thumbs/90/102611276.jpg "Height Fields and Contours Scalar Fields Volume Rendering Vector Fields [Angel Ch. 12] April 23, 2002 Frank Pfenning Carnegie Mellon University") 15-462 Computer Graphics I Lecture 21 Visualization Height Fields and Contours Scalar Fields Volume Rendering Vector Fields [Angel Ch. 12] April 23, 2002 Frank Pfenning Carnegie Mellon University http://www.cs.cmu.edu/~fp/courses/graphics/
15-462 Computer Graphics I Lecture 21 Visualization Height Fields and Contours Scalar Fields Volume Rendering Vector Fields [Angel Ch. 12] April 23, 2002 Frank Pfenning Carnegie Mellon University http://www.cs.cmu.edu/~fp/courses/graphics/
Volume Visualization
 Volume Visualization Part 1 (out of 3) Overview: Volume Visualization Introduction to volume visualization On volume data Surface vs. volume rendering Overview: Techniques Simple methods Slicing, cuberille
03 - Reconstruction. Acknowledgements: Olga Sorkine-Hornung. CSCI-GA Geometric Modeling - Spring 17 - Daniele Panozzo
 3 - Reconstruction Acknowledgements: Olga Sorkine-Hornung Geometry Acquisition Pipeline Scanning: results in range images Registration: bring all range images to one coordinate system Stitching/ reconstruction:
Previously... contour or image rendering in 2D
 Volume Rendering Visualisation Lecture 10 Taku Komura Institute for Perception, Action & Behaviour School of Informatics Volume Rendering 1 Previously... contour or image rendering in 2D 2D Contour line
Surface Modeling. Polygon Tables. Types: Generating models: Polygon Surfaces. Polygon surfaces Curved surfaces Volumes. Interactive Procedural
 Surface Modeling Types: Polygon surfaces Curved surfaces Volumes Generating models: Interactive Procedural Polygon Tables We specify a polygon surface with a set of vertex coordinates and associated attribute
Data Representation in Visualisation
 Data Representation in Visualisation Visualisation Lecture 4 Taku Komura Institute for Perception, Action & Behaviour School of Informatics Taku Komura Data Representation 1 Data Representation We have
Digital Geometry Processing
 Digital Geometry Processing Spring 2011 physical model acquired point cloud reconstructed model 2 Digital Michelangelo Project Range Scanning Systems Passive: Stereo Matching Find and match features in
Visualization Computer Graphics I Lecture 20
 15-462 Computer Graphics I Lecture 20 Visualization Height Fields and Contours Scalar Fields Volume Rendering Vector Fields [Angel Ch. 12] November 20, 2003 Doug James Carnegie Mellon University http://www.cs.cmu.edu/~djames/15-462/fall03
A Survey of Volumetric Visualization Techniques for Medical Images
 International Journal of Research Studies in Computer Science and Engineering (IJRSCSE) Volume 2, Issue 4, April 2015, PP 34-39 ISSN 2349-4840 (Print) & ISSN 2349-4859 (Online) www.arcjournals.org A Survey
Image Analysis. 1. A First Look at Image Classification
 Image Analysis Image Analysis 1. A First Look at Image Classification Lars Schmidt-Thieme Information Systems and Machine Learning Lab (ISMLL) Institute for Business Economics and Information Systems &
cs6630 November TRANSFER FUNCTIONS Alex Bigelow University of Utah
 cs6630 November 14 2014 TRANSFER FUNCTIONS Alex Bigelow University of Utah 1 cs6630 November 13 2014 TRANSFER FUNCTIONS Alex Bigelow University of Utah slide acknowledgements: Miriah Meyer, University
Computer Graphics 1. Chapter 2 (May 19th, 2011, 2-4pm): 3D Modeling. LMU München Medieninformatik Andreas Butz Computergraphik 1 SS2011
: 3D Modeling. LMU München Medieninformatik Andreas Butz Computergraphik 1 SS2011") Computer Graphics 1 Chapter 2 (May 19th, 2011, 2-4pm): 3D Modeling 1 The 3D rendering pipeline (our version for this class) 3D models in model coordinates 3D models in world coordinates 2D Polygons in
Computer Graphics 1 Chapter 2 (May 19th, 2011, 2-4pm): 3D Modeling 1 The 3D rendering pipeline (our version for this class) 3D models in model coordinates 3D models in world coordinates 2D Polygons in
Clipping. CSC 7443: Scientific Information Visualization
 Clipping Clipping to See Inside Obscuring critical information contained in a volume data Contour displays show only exterior visible surfaces Isosurfaces can hide other isosurfaces Other displays can
Solid Modeling. Michael Kazhdan ( /657) HB , FvDFH 12.1, 12.2, 12.6, 12.7 Marching Cubes, Lorensen et al.
 HB , FvDFH 12.1, 12.2, 12.6, 12.7 Marching Cubes, Lorensen et al.") Solid Modeling Michael Kazhdan (601.457/657) HB 10.15 10.17, 10.22 FvDFH 12.1, 12.2, 12.6, 12.7 Marching Cubes, Lorensen et al. 1987 Announcement OpenGL review session: When: Today @ 9:00 PM Where: Malone
Solid Modeling Michael Kazhdan (601.457/657) HB 10.15 10.17, 10.22 FvDFH 12.1, 12.2, 12.6, 12.7 Marching Cubes, Lorensen et al. 1987 Announcement OpenGL review session: When: Today @ 9:00 PM Where: Malone
Volume visualization. Volume visualization. Volume visualization methods. Sources of volume visualization. Sources of volume visualization
 Volume visualization Volume visualization Volumes are special cases of scalar data: regular 3D grids of scalars, typically interpreted as density values. Each data value is assumed to describe a cubic
Marching Squares Algorithm. Can you summarize the marching squares algorithm based on what we just discussed?
 Marching Squares Algorithm Can you summarize the marching squares algorithm based on what we just discussed? Marching Squares Algorithm Can you summarize the marching squares algorithm based on what we
How do we draw a picture?
 1 How do we draw a picture? Define geometry. Now what? We can draw the edges of the faces. Wireframe. We can only draw the edges of faces that are visible. We can fill in the faces. Giving each object
Reconstruction of complete 3D object model from multi-view range images.
 Header for SPIE use Reconstruction of complete 3D object model from multi-view range images. Yi-Ping Hung *, Chu-Song Chen, Ing-Bor Hsieh, Chiou-Shann Fuh Institute of Information Science, Academia Sinica,
1 Introduction 2. 2 A Simple Algorithm 2. 3 A Fast Algorithm 2
 Polyline Reduction David Eberly, Geometric Tools, Redmond WA 98052 https://www.geometrictools.com/ This work is licensed under the Creative Commons Attribution 4.0 International License. To view a copy
GPU-based Volume Rendering. Michal Červeňanský
 GPU-based Volume Rendering Michal Červeňanský Outline Volume Data Volume Rendering GPU rendering Classification Speed-up techniques Other techniques 2 Volume Data Describe interior structures Liquids,
Advanced 3D-Data Structures
 Advanced 3D-Data Structures Eduard Gröller, Martin Haidacher Institute of Computer Graphics and Algorithms Vienna University of Technology Motivation For different data sources and applications different
Fairing Scalar Fields by Variational Modeling of Contours
 Fairing Scalar Fields by Variational Modeling of Contours Martin Bertram University of Kaiserslautern, Germany Abstract Volume rendering and isosurface extraction from three-dimensional scalar fields are
SURFACE CONSTRUCTION USING TRICOLOR MARCHING CUBES
 SURFACE CONSTRUCTION USING TRICOLOR MARCHING CUBES Shaojun Liu, Jia Li Oakland University Rochester, MI 4839, USA Email: sliu2@oakland.edu, li4@oakland.edu Xiaojun Jing Beijing University of Posts and
Section A Solids Grade E
 Name: Teacher Assessment Section A Solids Grade E 1. Write down the name of each of these 3-D shapes, (i) (ii) (iii) Answer (i)... (ii)... (iii)... (Total 3 marks) 2. (a) On the isometric grid complete
Contours & Implicit Modelling 4
 Brief Recap Contouring & Implicit Modelling Contouring Implicit Functions Visualisation Lecture 8 lecture 6 Marching Cubes lecture 3 visualisation of a Quadric toby.breckon@ed.ac.uk Computer Vision Lab.
Advanced Lighting Techniques Due: Monday November 2 at 10pm
 CMSC 23700 Autumn 2015 Introduction to Computer Graphics Project 3 October 20, 2015 Advanced Lighting Techniques Due: Monday November 2 at 10pm 1 Introduction This assignment is the third and final part
Special Topics in Visualization
 Special Topics in Visualization Final Project Report Dual contouring of Hermite Data Submitted By S M Shahed Nejhum 8589-1199 May 19, 2008 Introduction Iso-surface extraction from 3D volumetric data is
Graphics Hardware and Display Devices
 Graphics Hardware and Display Devices CSE328 Lectures Graphics/Visualization Hardware Many graphics/visualization algorithms can be implemented efficiently and inexpensively in hardware Facilitates interactive
Decimation of 2D Scalar Data with Error Control
 Decimation of 2D Scalar Data with Error Control Daniel R. Schikore Chandrajit L. Bajaj Department of Computer Sciences Purdue University West Lafayette, IN 47907 drs@cs.purdue.edu bajaj@cs.purdue.edu Abstract
A New Approach of Seed-Set Finding for Iso-Surface Extraction
 A New Approach of Seed-Set Finding for Iso-Surface Extraction Chiang-Han Hung Chuan-kai Yang National Taiwan University of Science and Technology Abstract Iso-surface extraction is one of the most important
8. Tensor Field Visualization
 8. Tensor Field Visualization Tensor: extension of concept of scalar and vector Tensor data for a tensor of level k is given by t i1,i2,,ik (x 1,,x n ) Second-order tensor often represented by matrix Examples:
Scalar Data. Alark Joshi
 Scalar Data Alark Joshi Announcements Pick two papers to present Email me your top 3/4 choices. FIFO allotment Contact your clients Blog summaries: http://cs.boisestate.edu/~alark/cs564/participants.html
CS770/870 Spring 2017 Ray Tracing Implementation
 Useful ector Information S770/870 Spring 07 Ray Tracing Implementation Related material:angel 6e: h.3 Ray-Object intersections Spheres Plane/Polygon Box/Slab/Polyhedron Quadric surfaces Other implicit/explicit
Morphological track 1
 Morphological track 1 Shapes Painting of living beings on cave walls at Lascaux [about 1500 th BC] L homme qui marche by Alberto Giacometti, 1948, NOUVELLES IMAGES Editor (1976) Les lutteurs by Honoré
Display. Introduction page 67 2D Images page 68. All Orientations page 69 Single Image page 70 3D Images page 71
 Display Introduction page 67 2D Images page 68 All Orientations page 69 Single Image page 70 3D Images page 71 Intersecting Sections page 71 Cube Sections page 72 Render page 73 1. Tissue Maps page 77
Surface Construction Analysis using Marching Cubes
 Surface Construction Analysis using Marching Cubes Burak Erem Northeastern University erem.b@neu.edu Nicolas Dedual Northeastern University ndedual@ece.neu.edu Abstract This paper presents an analysis
Interactive Isosurface Ray Tracing of Large Octree Volumes
 Interactive Isosurface Ray Tracing of Large Octree Volumes Aaron Knoll, Ingo Wald, Steven Parker, and Charles Hansen Scientific Computing and Imaging Institute University of Utah 2006 IEEE Symposium on
Fast and Exact Fiber Surfaces for Tetrahedral Meshes
 JOURNAL OF L A T E X CLASS FILES, VOL.?, NO.?, JANUARY 20?? 1 Fast and Exact Fiber Surfaces for Tetrahedral Meshes Pavol Klacansky, Julien Tierny, Hamish Carr, and Zhao Geng Abstract Isosurfaces are fundamental
Ray Tracing Acceleration Data Structures
 Ray Tracing Acceleration Data Structures Sumair Ahmed October 29, 2009 Ray Tracing is very time-consuming because of the ray-object intersection calculations. With the brute force method, each ray has
Kent Academic Repository
 Kent Academic Repository Full text document (pdf) Citation for published version Hill, Steve and Roberts, Jonathan C. (1995) Surface Models and the Resolution of N-Dimensional Cell Ambiguity. In: Paeth,
Solid Modeling. Thomas Funkhouser Princeton University C0S 426, Fall Represent solid interiors of objects
 Solid Modeling Thomas Funkhouser Princeton University C0S 426, Fall 2000 Solid Modeling Represent solid interiors of objects Surface may not be described explicitly Visible Human (National Library of Medicine)
Direct Volume Rendering
 Direct Volume Rendering Visualization Torsten Möller Weiskopf/Machiraju/Möller Overview 2D visualization slice images (or multi-planar reformating MPR) Indirect 3D visualization isosurfaces (or surface-shaded
Mesh Decimation Using VTK
 Mesh Decimation Using VTK Michael Knapp knapp@cg.tuwien.ac.at Institute of Computer Graphics and Algorithms Vienna University of Technology Abstract This paper describes general mesh decimation methods
AMCS / CS 247 Scientific Visualization Lecture 4: Data Representation, Pt. 1. Markus Hadwiger, KAUST
 AMCS / CS 247 Scientific Visualization Lecture 4: Data Representation, Pt. 1 Markus Hadwiger, KAUST Reading Assignment #2 (until Sep 1) Read (required): Data Visualization book, finish Chapter 2 Data Visualization
Anno accademico 2006/2007. Davide Migliore
 Robotica Anno accademico 6/7 Davide Migliore migliore@elet.polimi.it Today What is a feature? Some useful information The world of features: Detectors Edges detection Corners/Points detection Descriptors?!?!?
Physically-Based Modeling and Animation. University of Missouri at Columbia
 Overview of Geometric Modeling Overview 3D Shape Primitives: Points Vertices. Curves Lines, polylines, curves. Surfaces Triangle meshes, splines, subdivision surfaces, implicit surfaces, particles. Solids
Spatial Data Structures for Computer Graphics
 Spatial Data Structures for Computer Graphics Page 1 of 65 http://www.cse.iitb.ac.in/ sharat November 2008 Spatial Data Structures for Computer Graphics Page 1 of 65 http://www.cse.iitb.ac.in/ sharat November
Data Visualization (CIS/DSC 468)
") Data Visualization (CIS/DSC 468) Isosurfaces Dr. David Koop Data Wrangling Problem 1: Visualizations need data Solution: The Web: github, gists, cloud services Problem 2: Data has extra information I don't
Data Visualization (CIS/DSC 468) Isosurfaces Dr. David Koop Data Wrangling Problem 1: Visualizations need data Solution: The Web: github, gists, cloud services Problem 2: Data has extra information I don't
Spatial Data Structures
 Spatial Data Structures Hierarchical Bounding Volumes Regular Grids Octrees BSP Trees Constructive Solid Geometry (CSG) [Angel 9.10] Outline Ray tracing review what rays matter? Ray tracing speedup faster
CIS 467/602-01: Data Visualization
 CIS 467/602-01: Data Visualization Vector Field Visualization Dr. David Koop Fields Tables Networks & Trees Fields Geometry Clusters, Sets, Lists Items Items (nodes) Grids Items Items Attributes Links
CSG obj. oper3. obj1 obj2 obj3. obj5. obj4
 Solid Modeling Solid: Boundary + Interior Volume occupied by geometry Solid representation schemes Constructive Solid Geometry (CSG) Boundary representations (B-reps) Space-partition representations Operations
Computer Graphics Prof. Sukhendu Das Dept. of Computer Science and Engineering Indian Institute of Technology, Madras Lecture - 24 Solid Modelling
 Computer Graphics Prof. Sukhendu Das Dept. of Computer Science and Engineering Indian Institute of Technology, Madras Lecture - 24 Solid Modelling Welcome to the lectures on computer graphics. We have
Scientific Visualization
 Scientific Visualization Dr. Ronald Peikert Summer 2007 Ronald Peikert SciVis 2007 - Introduction 1-1 Introduction to Scientific Visualization Ronald Peikert SciVis 2007 - Introduction 1-2 What is Scientific
Fast Interactive Region of Interest Selection for Volume Visualization
 Fast Interactive Region of Interest Selection for Volume Visualization Dominik Sibbing and Leif Kobbelt Lehrstuhl für Informatik 8, RWTH Aachen, 20 Aachen Email: {sibbing,kobbelt}@informatik.rwth-aachen.de
Volume Illumination & Vector Field Visualisation
 Volume Illumination & Vector Field Visualisation Visualisation Lecture 11 Institute for Perception, Action & Behaviour School of Informatics Volume Illumination & Vector Vis. 1 Previously : Volume Rendering