Volume Visualization
|
|
|
- Gerard Miles
- 6 years ago
- Views:
Transcription
1 Volume Visualization Part 1 (out of 3)
2 Overview: Volume Visualization Introduction to volume visualization On volume data Surface vs. volume rendering Overview: Techniques Simple methods Slicing, cuberille Direct volume visualization Introduction, types of combinations Transfer functions Eduard Gröller, Helwig Hauser 2
3 Volume Visualization Introduction: VolVis = visualization of volume data Mapping 3D 2D Projection (e.g., MIP), slicing, vol. rendering, Volume data = 3D 1D data Scalar data, 3D data space, space filling User goals: Gain insight in 3D data Structures of special interest + context Eduard Gröller, Helwig Hauser 3
4 Volume Data Where do the data come from? Medical Application Computed Tomographie (CT) Magnetic Resonance Imaging (MR) Materials testing Industrial-CT Simulation etc. Finite element methods (FEM) Computational fluid dynamics (CFD) Eduard Gröller, Helwig Hauser 4
5 3D Data Space How are volume data organized? Cartesian resp. regular grid: CT/MR: often dx=dy<dz, e.g. 135 slices (z) á 512² values (as x & y pixels in a slice) Data enhancement: iso-stack-calculation = Interpolation of additional slices, so that dx=dy=dz dy dz 512³ Voxel Data: Cells (cuboid), Corner: Voxel Curvi-linear grid resp. unstructured: t Data organized as tetrahedra or hexahedra Often: conversion to tetrahedra Eduard Gröller, Helwig Hauser 5
6 VolVis Challenges Rendering projection, so much information and so few pixels! Large data sizes, e.g voxel á 16 bit = 512 Mbytes Speed, Interaction is very important, >10 fps! Eduard Gröller, Helwig Hauser 6
7 Voxels vs. Cells Two ways to interpret the data: Data: set of voxel voxel = abbreviation for volume element (cf. pixel = "picture elem.) voxel = point sample in 3D Not necessarily interpolated Data: set of cells cell = cube primitive iti (3D) Corners: 8 voxel (see above) Values in cell: interpolation used Eduard Gröller, Helwig Hauser 7
8 Interpolation Eduard Gröller, Helwig Hauser 8
9 Interpolation Results Eduard Gröller, Helwig Hauser 9
10 Gradients as Normal Vector Replacement Gradient f = ( f/ x, f/ y, f/ z) f x0 normal vector to iso-surface f(x 0 )=f 0 Central difference in x-, y- & z-direction (in voxel): f(x 1) f(x 1) f (x,y,z) = 1/2 f(y 1) f(y 1) f(z 1) f(z 1) Then tri-linear interpolation within a cell Alternatives: Forward differencing: f (x)=f(x 1) f(x) f(x) Backwards differencing: f (x)=f(x) f(x 1) Intermediate differencing: f (x 0.5)=f(x 1) f(x) Eduard Gröller, Helwig Hauser 10
11 Concepts and Terms sampled data (measurement) analytical data (modelling) voxel space (discrete) iso-surfacing voxelization geometric surfaces (analytic) (direct) volume rendering pixel space (discrete) surface rendering Eduard Gröller, Helwig Hauser 11
 Surface")
 volume rendering")
 geom.")
12 Concepts and Terms Example 1: CT measurement Iso-surface-surfaccalculation (marching cubes) Surface rendering (OpenGL) sampled data (measurement) Iso-stack- conversion voxel space (discrete) volume rendering iso-surfacing voxelization pixel space (discrete) analytic data (modelling) geom. surfaces (analytic) surface rendering Eduard Gröller, Helwig Hauser 12


 surface rendering")
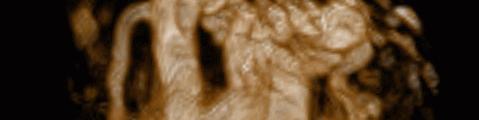
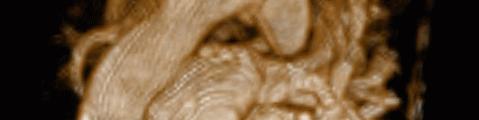
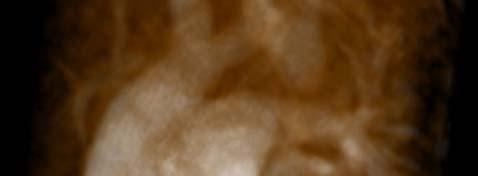
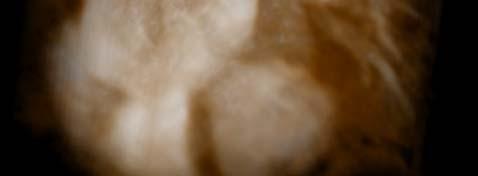
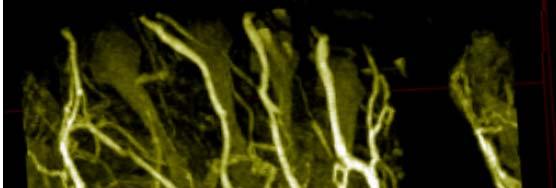
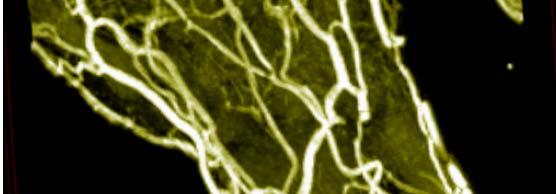
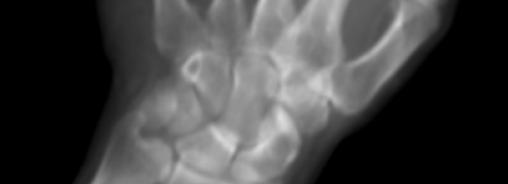
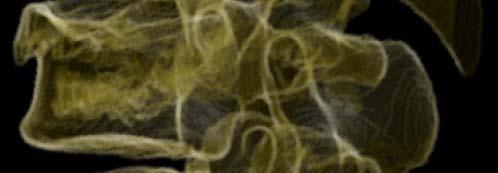
13 Concepts and Terms Example 2: MR measurement Image: bloodvessels in hand sampled data (measurement) Iso-stack- conversion MIP (maximum intensity proj.) voxel space (discrete) volume rendering iso-surfacing voxelization pixel space (discrete) analytic data (modelling) geom. surfaces (analytic) surface rendering Eduard Gröller, Helwig Hauser 13
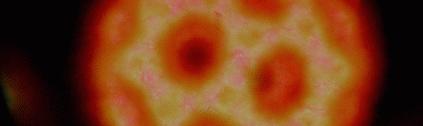
14 Concepts and Terms Example 3: potential ti function (x,y,z) Iso-surface (xyz)= (x,y,z) 0 Surface: ray tracing sampled sata (measurement) voxel space (discrete) volume rendering iso-surfacing voxelization pixel space (discrete) analytic data (modelling) geom. surfaces (analytic) surface rendering Eduard Gröller, Helwig Hauser 14

 voxel")

 surface rendering")
15 Concepts and Terms Example 4: X-Ray Modelling Surface- definition Sampling (voxelization), combination Direct volume rendering sampled data (measurement) voxel space (discrete) volume rendering iso-surfacing voxelization pixel space (discrete) analytical data (modelling) geom. surfaces (analytic) surface rendering Eduard Gröller, Helwig Hauser 15
16 Surfaces vs. Volume Rendering Surface rendering: Indirect volume visualization Intermediate representation: iso-surface, 3D Pros: Shading Shape!, HW-rendering Volume rendering: Direct volume visualization Usage of transfer functions Pros: illustrate t the interior, i semi-transparency Eduard Gröller, Helwig Hauser 16


17 Surfaces vs. Volume Rendering hybrid volume rendering rendering = surfaces +volumes Eduard Gröller, Helwig Hauser 17
18 VolVis-Techniques Overview Simple methods: Slicing, MPR (multi-planar reconstruction) Direct volume visualization: Ray casting Shear-warp factorization Splatting 3D texture t mapping Fourier volume rendering Surface-fitting methods: Marching cubes (marching tetrahedra) Eduard Gröller, Helwig Hauser 18
19 Image-Order vs. Object-Order Image-order: FOR every pixel DO: Cost, complexity image size Example: ray casting (tracing viewing rays) Object-order: FOR every object (voxel) DO: Cost, complexity object size (# of voxels) Examples: splatting ( throwing snow balls") Eduard Gröller, Helwig Hauser 19
20 Image-Order Approach Eduard Gröller, Helwig Hauser 20
21 Object-order approach Eduard Gröller, Helwig Hauser 21
22 Simple Methods Slicing, etc.


23 Slicing Slicing: click! Axes-parallel l slices regular grids: simple without transfer function no color Windowing: adjust contrast white Window black data values Eduard Gröller, Helwig Hauser 23
24 Slicing Slicing: click! Axes-parallel l slices regular grids: simple without transfer function no color Windowing: adjust contrast white Window black data values Eduard Gröller, Helwig Hauser 24


:")
25 klick! Slicing Not so simple: Slicing i through h general grid Interpolation ti necessary Slicing: i well combinable with 3D-visualization Multi-planar reformation (MPR): arbitrary axes, 3D Eduard Gröller, Helwig Hauser 25
26 klick! Slicing Not so simple: Slicing i through h general grid Interpolation ti necessary Slicing: i well combinable with 3D-visualization Multi-planar reformation (MPR): arbitrary axes, 3D Eduard Gröller, Helwig Hauser 26
27 Direct Volume Visualization, Introduction Classification Transfer Functions
28 Direct Volume Visualization Overview: No intermediate t representation ti real 3D Integration of so much information difficult Object-order vs. image-order rendering Various techniques (ray casting, splatting, shear-warp, texture mapping, Fourier volume rendering, etc.) Various types of combinations (compositing, MIP, first-hit, average, etc.) Eduard Gröller, Helwig Hauser 28
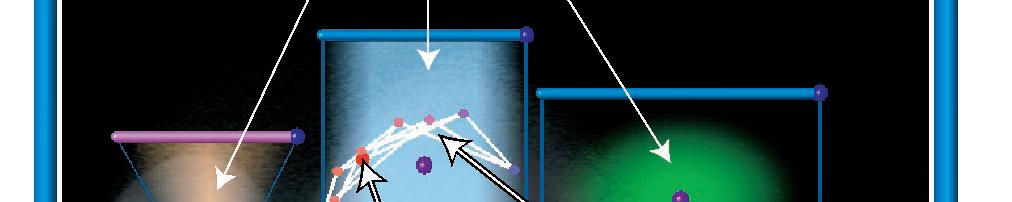
29 Types of Combinations Overview: MIP MaxIntensity Compositing X-Ray First hit Accumulate Average First Depth Eduard Gröller, Helwig Hauser 29
30 First Hit: Iso-Surface Extraction First Depth First: Extracts iso-surfaces (again!), done by Tuy&Tuy 84 Eduard Gröller, Helwig Hauser 30


31 Average: as X-Ray Images Average Depth Average: Produces basically an X-ray picture Eduard Gröller, Helwig Hauser 31


32 MIP: Maximum-Intensity Projection MaxIntensity Depth Max: Maximum Intensity Projection used for Magnetic Resonance Angiograms, for example Eduard Gröller, Helwig Hauser 32


33 Compositing: Semi-Transparency Accumulate Depth Accumulate: Make transparent layers visible! Levoy 88 Eduard Gröller, Helwig Hauser 33


34 Types of Combination Possibilities: -compositing Shaded surface display Maximum-intensity projection X-ray simulation Contour rendering DVR SSD NPR x-ray Eduard Gröller, Helwig Hauser 34 MIP
35 Classification Assignment data semantics: Assignment to objects, e.g., bone, skin, muscle, etc. Usage of data values, gradient, curvature Goal: segmentation Often: semi-automatic resp. manual Automatic approximation: transfer functions (TF) Example Eduard Gröller, Helwig Hauser 35
 data opacity (non-transparency) opacity skin bone yellow, semi-transparent red, opaque color air data values")
36 Transfer Functions (TF) Mapping data renderable quantities : 1.) data color 2.) data opacity (non-transparency) opacity skin bone yellow, semi-transparent red, opaque color air data values Eduard Gröller, Helwig Hauser 36


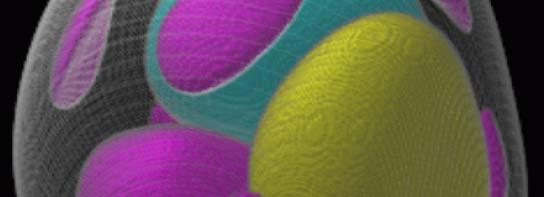
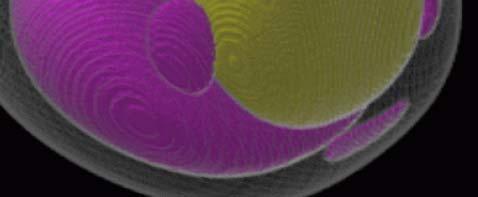
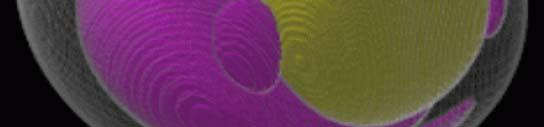
37 Different Transfer Functions Image results: Strong dependence d on transfer functions Non-trivial specification Limited segmentation possibilities Eduard Gröller, Helwig Hauser 37


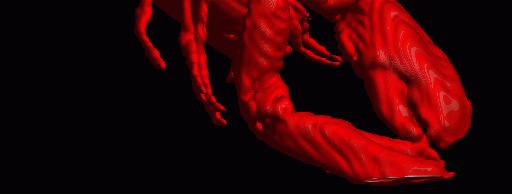

38 Lobster Different Transfer Functions Three objects: media, shell, flesh Eduard Gröller, Helwig Hauser 38
39 Inclusion of the Gradient Emphasis of changes: Special interest often in transitional areas Gradients: measure degree of change (like surface normal) Larger gradient magnitude larger opacity Eduard Gröller, Helwig Hauser 39
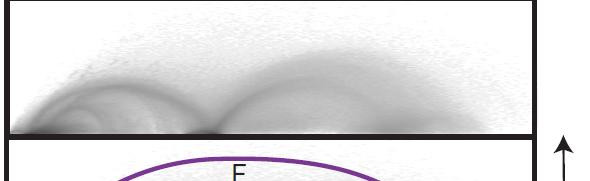
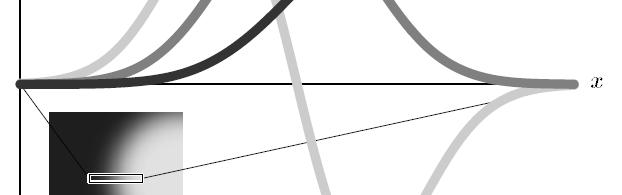
40 Gradient-Based Transfer Functions 2D-Transfer function: Levoy 88 Specific opacity at certain threshold opacity (x) gradient magnitude f(x) but: close-by variation according gradient magnitude highlights transitions (large gradients) dampens homogeneous areas data value f(x) Eduard Gröller, Helwig Hauser 40


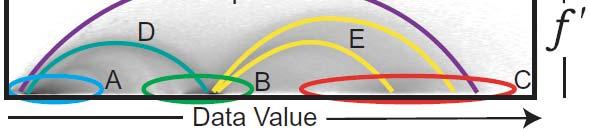


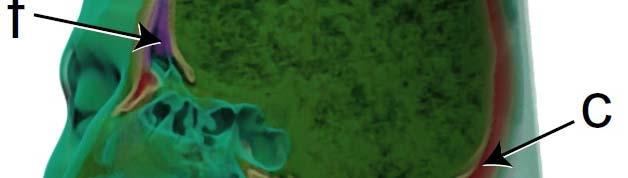

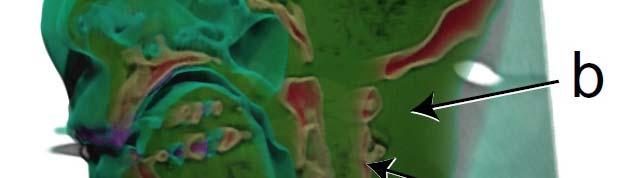


41 Multi-Dimensional Transfer Functions (1) f, f, f histograms to depict material boundaries f (x) f (x) f(x) material histogram f, f histogram f (x) f(x) [Kindlmann, Durkin 1998] x f (x) volume rendering showing materials and boundaries x f(x) Eduard Gröller, Helwig Hauser 41 [Kniss et al. 2002]


42 Multi-Dimensional Transfer Functions (2) Direct manipulation widgets [Kniss et al. 2002] 1D vs. 2D transfer function Eduard Gröller, Helwig Hauser 42
43 Acknowledgments For material for this lecture unit Roberto Scopigno, Claudio Montani (CNR, Pisa) Hans-Georg Pagendarm (DLR, Göttingen) Michael Meißner (GRIS, Tübingen) Torsten Möller Gordon Kindlmann Joe Kniss etc. Eduard Gröller, Helwig Hauser 43
Volume Visualization. Part 1 (out of 3) Volume Data. Where do the data come from? 3D Data Space How are volume data organized?
 Volume Data. Where do the data come from? 3D Data Space How are volume data organized?") Volume Data Volume Visualization Part 1 (out of 3) Where do the data come from? Medical Application Computed Tomographie (CT) Magnetic Resonance Imaging (MR) Materials testing Industrial-CT Simulation
Volume Data Volume Visualization Part 1 (out of 3) Where do the data come from? Medical Application Computed Tomographie (CT) Magnetic Resonance Imaging (MR) Materials testing Industrial-CT Simulation
Data Visualization (CIS/DSC 468)
") Data Visualization (CIS/DSC 46) Volume Rendering Dr. David Koop Visualizing Volume (3D) Data 2D visualization slice images (or multi-planar reformating MPR) Indirect 3D visualization isosurfaces (or surface-shaded
Data Visualization (CIS/DSC 46) Volume Rendering Dr. David Koop Visualizing Volume (3D) Data 2D visualization slice images (or multi-planar reformating MPR) Indirect 3D visualization isosurfaces (or surface-shaded
cs6630 November TRANSFER FUNCTIONS Alex Bigelow University of Utah
 cs6630 November 14 2014 TRANSFER FUNCTIONS Alex Bigelow University of Utah 1 cs6630 November 13 2014 TRANSFER FUNCTIONS Alex Bigelow University of Utah slide acknowledgements: Miriah Meyer, University
Volume Rendering. Lecture 21
 Volume Rendering Lecture 21 Acknowledgements These slides are collected from many sources. A particularly valuable source is the IEEE Visualization conference tutorials. Sources from: Roger Crawfis, Klaus
CIS 467/602-01: Data Visualization
 CIS 467/60-01: Data Visualization Isosurfacing and Volume Rendering Dr. David Koop Fields and Grids Fields: values come from a continuous domain, infinitely many values - Sampled at certain positions to
Scalar Data. Visualization Torsten Möller. Weiskopf/Machiraju/Möller
 Scalar Data Visualization Torsten Möller Weiskopf/Machiraju/Möller Overview Basic strategies Function plots and height fields Isolines Color coding Volume visualization (overview) Classification Segmentation
Data Visualization (DSC 530/CIS )
") Data Visualization (DSC 530/CIS 60-0) Isosurfaces & Volume Rendering Dr. David Koop Fields & Grids Fields: - Values come from a continuous domain, infinitely many values - Sampled at certain positions
Data Visualization (DSC 530/CIS 60-0) Isosurfaces & Volume Rendering Dr. David Koop Fields & Grids Fields: - Values come from a continuous domain, infinitely many values - Sampled at certain positions
Data Visualization (DSC 530/CIS )
") Data Visualization (DSC 530/CIS 60-01) Scalar Visualization Dr. David Koop Online JavaScript Resources http://learnjsdata.com/ Good coverage of data wrangling using JavaScript Fields in Visualization Scalar
Data Visualization (DSC 530/CIS 60-01) Scalar Visualization Dr. David Koop Online JavaScript Resources http://learnjsdata.com/ Good coverage of data wrangling using JavaScript Fields in Visualization Scalar
Scalar Data. CMPT 467/767 Visualization Torsten Möller. Weiskopf/Machiraju/Möller
 Scalar Data CMPT 467/767 Visualization Torsten Möller Weiskopf/Machiraju/Möller Overview Basic strategies Function plots and height fields Isolines Color coding Volume visualization (overview) Classification
Volume visualization. Volume visualization. Volume visualization methods. Sources of volume visualization. Sources of volume visualization
 Volume visualization Volume visualization Volumes are special cases of scalar data: regular 3D grids of scalars, typically interpreted as density values. Each data value is assumed to describe a cubic
Fast Visualization of Object Contours by Non-Photorealistic Volume Rendering
 Fast Visualization of Object Contours by Non-Photorealistic Volume Rendering Balázs Csébfalvi bfalvi,, Lukas Mroz, Helwig Hauser, Andreas König, Eduard Gröller Institute of Computer Graphics and Algorithms
Visualization Computer Graphics I Lecture 20
 15-462 Computer Graphics I Lecture 20 Visualization Height Fields and Contours Scalar Fields Volume Rendering Vector Fields [Angel Ch. 12] April 15, 2003 Frank Pfenning Carnegie Mellon University http://www.cs.cmu.edu/~fp/courses/graphics/
Height Fields and Contours Scalar Fields Volume Rendering Vector Fields [Angel Ch. 12] April 23, 2002 Frank Pfenning Carnegie Mellon University
![Height Fields and Contours Scalar Fields Volume Rendering Vector Fields [Angel Ch. 12] April 23, 2002 Frank Pfenning Carnegie Mellon University](/thumbs/90/102611276.jpg "Height Fields and Contours Scalar Fields Volume Rendering Vector Fields [Angel Ch. 12] April 23, 2002 Frank Pfenning Carnegie Mellon University") 15-462 Computer Graphics I Lecture 21 Visualization Height Fields and Contours Scalar Fields Volume Rendering Vector Fields [Angel Ch. 12] April 23, 2002 Frank Pfenning Carnegie Mellon University http://www.cs.cmu.edu/~fp/courses/graphics/
15-462 Computer Graphics I Lecture 21 Visualization Height Fields and Contours Scalar Fields Volume Rendering Vector Fields [Angel Ch. 12] April 23, 2002 Frank Pfenning Carnegie Mellon University http://www.cs.cmu.edu/~fp/courses/graphics/
11/1/13. Visualization. Scientific Visualization. Types of Data. Height Field. Contour Curves. Meshes
 CSCI 420 Computer Graphics Lecture 26 Visualization Height Fields and Contours Scalar Fields Volume Rendering Vector Fields [Angel Ch. 2.11] Jernej Barbic University of Southern California Scientific Visualization
Visualization. CSCI 420 Computer Graphics Lecture 26
 CSCI 420 Computer Graphics Lecture 26 Visualization Height Fields and Contours Scalar Fields Volume Rendering Vector Fields [Angel Ch. 11] Jernej Barbic University of Southern California 1 Scientific Visualization
Data Visualization (CIS/DSC 468)
") Data Visualization (CIS/DSC 468) Vector Visualization Dr. David Koop Visualizing Volume (3D) Data 2D visualization slice images (or multi-planar reformating MPR) Indirect 3D visualization isosurfaces (or
Data Visualization (CIS/DSC 468) Vector Visualization Dr. David Koop Visualizing Volume (3D) Data 2D visualization slice images (or multi-planar reformating MPR) Indirect 3D visualization isosurfaces (or
First Steps in Hardware Two-Level Volume Rendering
 First Steps in Hardware Two-Level Volume Rendering Markus Hadwiger, Helwig Hauser Abstract We describe first steps toward implementing two-level volume rendering (abbreviated as 2lVR) on consumer PC graphics
Volume Rendering. Computer Animation and Visualisation Lecture 9. Taku Komura. Institute for Perception, Action & Behaviour School of Informatics
 Volume Rendering Computer Animation and Visualisation Lecture 9 Taku Komura Institute for Perception, Action & Behaviour School of Informatics Volume Rendering 1 Volume Data Usually, a data uniformly distributed
Visualization Computer Graphics I Lecture 20
 15-462 Computer Graphics I Lecture 20 Visualization Height Fields and Contours Scalar Fields Volume Rendering Vector Fields [Angel Ch. 12] November 20, 2003 Doug James Carnegie Mellon University http://www.cs.cmu.edu/~djames/15-462/fall03
GPU-based Volume Rendering. Michal Červeňanský
 GPU-based Volume Rendering Michal Červeňanský Outline Volume Data Volume Rendering GPU rendering Classification Speed-up techniques Other techniques 2 Volume Data Describe interior structures Liquids,
Previously... contour or image rendering in 2D
 Volume Rendering Visualisation Lecture 10 Taku Komura Institute for Perception, Action & Behaviour School of Informatics Volume Rendering 1 Previously... contour or image rendering in 2D 2D Contour line
Visualization. Images are used to aid in understanding of data. Height Fields and Contours Scalar Fields Volume Rendering Vector Fields [chapter 26]
![Visualization. Images are used to aid in understanding of data. Height Fields and Contours Scalar Fields Volume Rendering Vector Fields [chapter 26]](/thumbs/74/70771954.jpg "Visualization. Images are used to aid in understanding of data. Height Fields and Contours Scalar Fields Volume Rendering Vector Fields [chapter 26]") Visualization Images are used to aid in understanding of data Height Fields and Contours Scalar Fields Volume Rendering Vector Fields [chapter 26] Tumor SCI, Utah Scientific Visualization Visualize large
Visualization Images are used to aid in understanding of data Height Fields and Contours Scalar Fields Volume Rendering Vector Fields [chapter 26] Tumor SCI, Utah Scientific Visualization Visualize large
Direct Volume Rendering
 Direct Volume Rendering Visualization Torsten Möller Weiskopf/Machiraju/Möller Overview 2D visualization slice images (or multi-planar reformating MPR) Indirect 3D visualization isosurfaces (or surface-shaded
Volume Rendering - Introduction. Markus Hadwiger Visual Computing Center King Abdullah University of Science and Technology
 Volume Rendering - Introduction Markus Hadwiger Visual Computing Center King Abdullah University of Science and Technology Volume Visualization 2D visualization: slice images (or multi-planar reformation:
5. Volume Visualization
 5. Volume Visualization Scalar volume data Medical Applications: CT, MRI, confocal microscopy, ultrasound, etc. 1 5. Volume Visualization 2 5. Volume Visualization 3 5. Volume Visualization Some possible
Scalar Data. Alark Joshi
 Scalar Data Alark Joshi Announcements Pick two papers to present Email me your top 3/4 choices. FIFO allotment Contact your clients Blog summaries: http://cs.boisestate.edu/~alark/cs564/participants.html
Direct Volume Rendering
 Direct Volume Rendering CMPT 467/767 Visualization Torsten Möller Weiskopf/Machiraju/Möller Overview Volume rendering equation Compositing schemes Ray casting Acceleration techniques for ray casting Texture-based
Indirect Volume Rendering
 Indirect Volume Rendering Visualization Torsten Möller Weiskopf/Machiraju/Möller Overview Contour tracing Marching cubes Marching tetrahedra Optimization octree-based range query Weiskopf/Machiraju/Möller
AMCS / CS 247 Scientific Visualization Lecture 4: Data Representation, Pt. 1. Markus Hadwiger, KAUST
 AMCS / CS 247 Scientific Visualization Lecture 4: Data Representation, Pt. 1 Markus Hadwiger, KAUST Reading Assignment #2 (until Sep 1) Read (required): Data Visualization book, finish Chapter 2 Data Visualization
Volume Graphics Introduction
 High-Quality Volume Graphics on Consumer PC Hardware Volume Graphics Introduction Joe Kniss Gordon Kindlmann Markus Hadwiger Christof Rezk-Salama Rüdiger Westermann Motivation (1) Motivation (2) Scientific
Lecture overview. Visualisatie BMT. Transparency. Transparency. Transparency. Transparency. Transparency Volume rendering Assignment
 Visualisatie BMT Lecture overview Assignment Arjan Kok a.j.f.kok@tue.nl 1 Makes it possible to see inside or behind objects Complement of transparency is opacity Opacity defined by alpha value with range
Volume Illumination & Vector Field Visualisation
 Volume Illumination & Vector Field Visualisation Visualisation Lecture 11 Institute for Perception, Action & Behaviour School of Informatics Volume Illumination & Vector Vis. 1 Previously : Volume Rendering
Scientific Visualization. CSC 7443: Scientific Information Visualization
 Scientific Visualization Scientific Datasets Gaining insight into scientific data by representing the data by computer graphics Scientific data sources Computation Real material simulation/modeling (e.g.,
Direct Volume Rendering
 Direct Volume Rendering Balázs Csébfalvi Department of Control Engineering and Information Technology Budapest University of Technology and Economics Classification of Visualization Algorithms Indirect
Volume Illumination, Contouring
 Volume Illumination, Contouring Computer Animation and Visualisation Lecture 0 tkomura@inf.ed.ac.uk Institute for Perception, Action & Behaviour School of Informatics Contouring Scaler Data Overview -
Mirrored LH Histograms for the Visualization of Material Boundaries
 Mirrored LH Histograms for the Visualization of Material Boundaries Petr Šereda 1, Anna Vilanova 1 and Frans A. Gerritsen 1,2 1 Department of Biomedical Engineering, Technische Universiteit Eindhoven,
lecture 21 volume rendering - blending N layers - OpenGL fog (not on final exam) - transfer functions - rendering level surfaces
 - transfer functions - rendering level surfaces") lecture 21 volume rendering - blending N layers - OpenGL fog (not on final exam) - transfer functions - rendering level surfaces - 3D objects Clouds, fire, smoke, fog, and dust are difficult to model with
lecture 21 volume rendering - blending N layers - OpenGL fog (not on final exam) - transfer functions - rendering level surfaces - 3D objects Clouds, fire, smoke, fog, and dust are difficult to model with
Direct Volume Rendering. Overview
 Direct Volume Rendering Department of Computer Science University of New Hampshire Durham, NH 03824 Based on: Brodlie and Wood, Recent Advances in Visualization of Volumetric Data, Eurographics 2000 State
Overview. Direct Volume Rendering. Volume Rendering Integral. Volume Rendering Integral Approximation
 Overview Direct Volume Rendering Department of Computer Science University of New Hampshire Durham, NH 03824 Based on: Brodlie and Wood, Recent Advances in Visualization of Volumetric Data, Eurographics
Computer Graphics. - Volume Rendering - Philipp Slusallek
 Computer Graphics - Volume Rendering - Philipp Slusallek Overview Motivation Volume Representation Indirect Volume Rendering Volume Classification Direct Volume Rendering Applications: Bioinformatics Image
Introduction to Scientific Visualization
 Visualization Definition Introduction to Scientific Visualization Stefan Bruckner visualization: to form a mental vision, image, or picture of (something not visible or present to the sight, or of an abstraction);
Raycasting. Ronald Peikert SciVis Raycasting 3-1
 Raycasting Ronald Peikert SciVis 2007 - Raycasting 3-1 Direct volume rendering Volume rendering (sometimes called direct volume rendering) stands for methods that generate images directly from 3D scalar
Volume Illumination. Visualisation Lecture 11. Taku Komura. Institute for Perception, Action & Behaviour School of Informatics
 Volume Illumination Visualisation Lecture 11 Taku Komura Institute for Perception, Action & Behaviour School of Informatics Taku Komura Volume Illumination & Vector Vis. 1 Previously : Volume Rendering
2. Review of current methods
 Transfer Functions for Direct Volume Rendering Gordon Kindlmann gk@cs.utah.edu http://www.cs.utah.edu/~gk Scientific Computing and Imaging Institute School of Computing University of Utah Contributions:
Geometric Representations. Stelian Coros
 Geometric Representations Stelian Coros Geometric Representations Languages for describing shape Boundary representations Polygonal meshes Subdivision surfaces Implicit surfaces Volumetric models Parametric
Application of Two Rendering Techniques in the Visualization of 3D Geospatial Data
 Available online at www.sciencedirect.com Procedia Environmental Sciences 12 (2012 ) 1432 1439 2011 International Conference on Environmental Science and Engineering (ICESE 2011) Application of Two Rendering
Visualisierung W, VU, 2.0h, 3.0EC
 Visualisierung 1 2014W, VU, 2.0h, 3.0EC 186.827 Eduard Gröller Johanna Schmidt Oana Moraru Institute of Computer Graphics and Algorithms (ICGA), VUT Austria Visualization Examples VolVis InfoVis FlowVis
Scalar Algorithms: Contouring
 Scalar Algorithms: Contouring Computer Animation and Visualisation Lecture tkomura@inf.ed.ac.uk Institute for Perception, Action & Behaviour School of Informatics Contouring Scaler Data Last Lecture...
Display. Introduction page 67 2D Images page 68. All Orientations page 69 Single Image page 70 3D Images page 71
 Display Introduction page 67 2D Images page 68 All Orientations page 69 Single Image page 70 3D Images page 71 Intersecting Sections page 71 Cube Sections page 72 Render page 73 1. Tissue Maps page 77
New Method for Opacity Correction in Oversampled Volume Ray Casting
 New Method for Opacity Correction in Oversampled Volume Ray Casting Jong Kwan Lee Department of Computer Science University of Alabama in Huntsville Huntsville, AL 35899 USA jlee@cs.uah.edu Timothy S.
A Survey of Volumetric Visualization Techniques for Medical Images
 International Journal of Research Studies in Computer Science and Engineering (IJRSCSE) Volume 2, Issue 4, April 2015, PP 34-39 ISSN 2349-4840 (Print) & ISSN 2349-4859 (Online) www.arcjournals.org A Survey
What is visualization? Why is it important?
 What is visualization? Why is it important? What does visualization do? What is the difference between scientific data and information data Cycle of Visualization Storage De noising/filtering Down sampling
1. Interpreting the Results: Visualization 1
 1. Interpreting the Results: Visualization 1 visual/graphical/optical representation of large sets of data: data from experiments or measurements: satellite images, tomography in medicine, microsopy,...
Volume Illumination and Segmentation
 Volume Illumination and Segmentation Computer Animation and Visualisation Lecture 13 Institute for Perception, Action & Behaviour School of Informatics Overview Volume illumination Segmentation Volume
Shear-Warp Volume Rendering. Volume Rendering Overview
 Shear-Warp Volume Rendering R. Daniel Bergeron Department of Computer Science University of New Hampshire Durham, NH 03824 From: Lacroute and Levoy, Fast Volume Rendering Using a Shear-Warp- Factorization
Data Representation in Visualisation
 Data Representation in Visualisation Visualisation Lecture 4 Taku Komura Institute for Perception, Action & Behaviour School of Informatics Taku Komura Data Representation 1 Data Representation We have
CIS 4930/ SCIENTIFICVISUALIZATION
 CIS 4930/6930-902 SCIENTIFICVISUALIZATION ISOSURFACING Paul Rosen Assistant Professor University of South Florida slides credits Tricoche and Meyer ADMINISTRATIVE Read (or watch video): Kieffer et al,
Medical Image Processing: Image Reconstruction and 3D Renderings
 Medical Image Processing: Image Reconstruction and 3D Renderings 김보형 서울대학교컴퓨터공학부 Computer Graphics and Image Processing Lab. 2011. 3. 23 1 Computer Graphics & Image Processing Computer Graphics : Create,
8. Tensor Field Visualization
 8. Tensor Field Visualization Tensor: extension of concept of scalar and vector Tensor data for a tensor of level k is given by t i1,i2,,ik (x 1,,x n ) Second-order tensor often represented by matrix Examples:
Volume Ray Casting Neslisah Torosdagli
 Volume Ray Casting Neslisah Torosdagli Overview Light Transfer Optical Models Math behind Direct Volume Ray Casting Demonstration Transfer Functions Details of our Application References What is Volume
ACGV 2008, Lecture 1 Tuesday January 22, 2008
 Advanced Computer Graphics and Visualization Spring 2008 Ch 1: Introduction Ch 4: The Visualization Pipeline Ch 5: Basic Data Representation Organization, Spring 2008 Stefan Seipel Filip Malmberg Mats
Scalar Visualization
 Scalar Visualization 5-1 Motivation Visualizing scalar data is frequently encountered in science, engineering, and medicine, but also in daily life. Recalling from earlier, scalar datasets, or scalar fields,
Uncertainty Visualization for Multi-resolution Volume Data with Regular Grids Using Volume Ray Casting-based Iso-surface Rendering
 2012 4th International Conference on Computer Research and Development IPCSIT vol.39 (2012) (2012) IACSIT Press, Singapore Uncertainty Visualization for Multi-resolution Volume Data with Regular Grids
Hot Topics in Visualization. Ronald Peikert SciVis Hot Topics 12-1
 Hot Topics in Visualization Ronald Peikert SciVis 2007 - Hot Topics 12-1 Hot Topic 1: Illustrative visualization Illustrative visualization: computer supported interactive and expressive visualizations
AMCS / CS 247 Scientific Visualization Lecture 10: (GPU) Texture Mapping. Markus Hadwiger, KAUST
 Texture Mapping. Markus Hadwiger, KAUST") AMCS / CS 247 Scientific Visualization Lecture 10: (GPU) Texture Mapping Markus Hadwiger, KAUST Reading Assignment #5 (until Oct. 8) Read (required): Real-Time Volume Graphics, Chapter 2 (GPU Programming)
AMCS / CS 247 Scientific Visualization Lecture 10: (GPU) Texture Mapping Markus Hadwiger, KAUST Reading Assignment #5 (until Oct. 8) Read (required): Real-Time Volume Graphics, Chapter 2 (GPU Programming)
Isosurface Rendering. CSC 7443: Scientific Information Visualization
 Isosurface Rendering What is Isosurfacing? An isosurface is the 3D surface representing the locations of a constant scalar value within a volume A surface with the same scalar field value Isosurfaces form
Emissive Clip Planes for Volume Rendering Supplement.
 Emissive Clip Planes for Volume Rendering Supplement. More material than fit on the one page version for the SIGGRAPH 2003 Sketch by Jan Hardenbergh & Yin Wu of TeraRecon, Inc. Left Image: The clipped
Computational Strategies
 Computational Strategies How can the basic ingredients be combined: Image Order Ray casting (many options) Object Order (in world coordinate) splatting, texture mapping Combination (neither) Shear warp,
LAPLACIAN MESH SMOOTHING FOR TETRAHEDRA BASED VOLUME VISUALIZATION 1. INTRODUCTION
 JOURNAL OF MEDICAL INFORMATICS & TECHNOLOGIES Vol.4/2002, ISSN 642-6037 Rafał STĘGIERSKI *, Paweł MIKOŁAJCZAK * volume data,triangle mesh generation, mesh smoothing, marching tetrahedra LAPLACIAN MESH
Medical Visualization - Volume Rendering. J.-Prof. Dr. Kai Lawonn
 Medical Visualization - Volume Rendering J.-Prof. Dr. Kai Lawonn Medical Visualization Pipeline Acquisition Filtering/Enhancement Mapping Rendering Data are given Data are processed e.g., feature extraction
Solid Modeling. Michael Kazhdan ( /657) HB , FvDFH 12.1, 12.2, 12.6, 12.7 Marching Cubes, Lorensen et al.
 HB , FvDFH 12.1, 12.2, 12.6, 12.7 Marching Cubes, Lorensen et al.") Solid Modeling Michael Kazhdan (601.457/657) HB 10.15 10.17, 10.22 FvDFH 12.1, 12.2, 12.6, 12.7 Marching Cubes, Lorensen et al. 1987 Announcement OpenGL review session: When: Today @ 9:00 PM Where: Malone
Solid Modeling Michael Kazhdan (601.457/657) HB 10.15 10.17, 10.22 FvDFH 12.1, 12.2, 12.6, 12.7 Marching Cubes, Lorensen et al. 1987 Announcement OpenGL review session: When: Today @ 9:00 PM Where: Malone
Visualisation : Lecture 1. So what is visualisation? Visualisation
 So what is visualisation? UG4 / M.Sc. Course 2006 toby.breckon@ed.ac.uk Computer Vision Lab. Institute for Perception, Action & Behaviour Introducing 1 Application of interactive 3D computer graphics to
Efficient Volumetric Ray Casting for Isosurface Rendering
 Efficient Volumetric Ray Casting for Isosurface Rendering Jae Jeong Choi 1 Byeong-Seok Shin 2 Yeong Gil Shin 1 Kevin Cleary 3 1. Department of Computer Science, Seoul National University, Seoul, Republic
CS 5630/6630 Scientific Visualization. Volume Rendering I: Overview
 CS 5630/6630 Scientific Visualization Volume Rendering I: Overview Motivation Isosurfacing is limited It is binary A hard, distinct boundary is not always appropriate Slice Isosurface Volume Rendering
Hot Topics in Visualization
 Hot Topic 1: Illustrative visualization 12 Illustrative visualization: computer supported interactive and expressive visualizations through abstractions as in traditional illustrations. Hot Topics in Visualization
Fast Visualization of Object Contours by Non-Photorealistic Volume Rendering
 EUROGRAPHICS 200 / A. Chalmers and T.-M. Rhyne (Guest Editors) Volume 20 (200), Number 3 Fast Visualization of Object Contours by Non-Photorealistic Volume Rendering Balázs Csébfalvi, Vienna University
L1 - Introduction. Contents. Introduction of CAD/CAM system Components of CAD/CAM systems Basic concepts of graphics programming
 L1 - Introduction Contents Introduction of CAD/CAM system Components of CAD/CAM systems Basic concepts of graphics programming 1 Definitions Computer-Aided Design (CAD) The technology concerned with the
The VesselGlyph: Focus & Context Visualization in CT-Angiography
 The VesselGlyph: Focus & Context Visualization in CT-Angiography Matúš Straka M. Šrámek, A. La Cruz E. Gröller, D. Fleischmann Contents Motivation:» Why again a new visualization method for vessel data?
What is visualization? Why is it important?
 What is visualization? Why is it important? What does visualization do? What is the difference between scientific data and information data Visualization Pipeline Visualization Pipeline Overview Data acquisition
A Study of Medical Image Analysis System
 Indian Journal of Science and Technology, Vol 8(25), DOI: 10.17485/ijst/2015/v8i25/80492, October 2015 ISSN (Print) : 0974-6846 ISSN (Online) : 0974-5645 A Study of Medical Image Analysis System Kim Tae-Eun
Medical Image Analysis
 Computer assisted Image Analysis VT04 29 april 2004 Medical Image Analysis Lecture 10 (part 1) Xavier Tizon Medical Image Processing Medical imaging modalities XRay,, CT Ultrasound MRI PET, SPECT Generic
Level of Details in Computer Rendering
 Level of Details in Computer Rendering Ariel Shamir Overview 1. Photo realism vs. Non photo realism (NPR) 2. Objects representations 3. Level of details Photo Realism Vs. Non Pixar Demonstrations Sketching,
CSC Computer Graphics
 // CSC. Computer Graphics Lecture Kasun@dscs.sjp.ac.lk Department of Computer Science University of Sri Jayewardanepura Polygon Filling Scan-Line Polygon Fill Algorithm Span Flood-Fill Algorithm Inside-outside
Interactive Boundary Detection for Automatic Definition of 2D Opacity Transfer Function
 Interactive Boundary Detection for Automatic Definition of 2D Opacity Transfer Function Martin Rauberger, Heinrich Martin Overhoff Medical Engineering Laboratory, University of Applied Sciences Gelsenkirchen,
Ray Tracing. Kjetil Babington
 Ray Tracing Kjetil Babington 21.10.2011 1 Introduction What is Ray Tracing? Act of tracing a ray through some scene Not necessarily for rendering Rendering with Ray Tracing Ray Tracing is a global illumination
Volume Visualiza0on. Today s Class. Grades & Homework feedback on Homework Submission Server
 11/3/14 Volume Visualiza0on h3p://imgur.com/trjonqk h3p://i.imgur.com/zcjc9kp.jpg Today s Class Grades & Homework feedback on Homework Submission Server Everything except HW4 (didn t get to that yet) &
Particle-Based Volume Rendering of Unstructured Volume Data
 Particle-Based Volume Rendering of Unstructured Volume Data Takuma KAWAMURA 1)*) Jorji NONAKA 3) Naohisa SAKAMOTO 2),3) Koji KOYAMADA 2) 1) Graduate School of Engineering, Kyoto University 2) Center for
coding of various parts showing different features, the possibility of rotation or of hiding covering parts of the object's surface to gain an insight
 Three-Dimensional Object Reconstruction from Layered Spatial Data Michael Dangl and Robert Sablatnig Vienna University of Technology, Institute of Computer Aided Automation, Pattern Recognition and Image
Hardware Accelerated Volume Visualization. Leonid I. Dimitrov & Milos Sramek GMI Austrian Academy of Sciences
 Hardware Accelerated Volume Visualization Leonid I. Dimitrov & Milos Sramek GMI Austrian Academy of Sciences A Real-Time VR System Real-Time: 25-30 frames per second 4D visualization: real time input of
Lecture 6: Edge Detection
 #1 Lecture 6: Edge Detection Saad J Bedros sbedros@umn.edu Review From Last Lecture Options for Image Representation Introduced the concept of different representation or transformation Fourier Transform
CS 5630/6630 Scientific Visualization. Volume Rendering III: Unstructured Grid Techniques
 CS 5630/6630 Scientific Visualization Volume Rendering III: Unstructured Grid Techniques Unstructured Grids Image-space techniques Ray-Casting Object-space techniques Projected Tetrahedra Hybrid Incremental
Rendering. Converting a 3D scene to a 2D image. Camera. Light. Rendering. View Plane
 Rendering Pipeline Rendering Converting a 3D scene to a 2D image Rendering Light Camera 3D Model View Plane Rendering Converting a 3D scene to a 2D image Basic rendering tasks: Modeling: creating the world
1 State of The Art for Volume Rendering
 1 State of The Art for Volume Rendering Technical Report Jianlong Zhou and Klaus D. Tönnies Institute for Simulation and Graphics University of Magdeburg, 39106 Magdeburg, Germany Email: {Zhou,Klaus}@isg.cs.uni-magdeburg.de
Medical Imaging and Beyond
 Medical Imaging and Beyond Jesus J. Caban Schedule! Today:! Lecture: Medical Imaging and Beyond! Wednesday:! No Class (Thanksgiving Eve)! Final presentations:! Nov 29 th : W. Griffin, F. Zafar! Dec 1 st
June 05, 2018, Version 3.0.6
 June 05, 2018, Version 3.0.6 VolViCon is an advanced application for reconstruction of computed tomography (CT), magnetic resonance (MR), ultrasound, and x-rays images. It gives features for exporting
Fog and Cloud Effects. Karl Smeltzer Alice Cao John Comstock
 Fog and Cloud Effects Karl Smeltzer Alice Cao John Comstock Goal Explore methods of rendering scenes containing fog or cloud-like effects through a variety of different techniques Atmospheric effects make
Contours & Implicit Modelling 4
 Brief Recap Contouring & Implicit Modelling Contouring Implicit Functions Visualisation Lecture 8 lecture 6 Marching Cubes lecture 3 visualisation of a Quadric toby.breckon@ed.ac.uk Computer Vision Lab.
CIS 467/602-01: Data Visualization
 CIS 467/602-01: Data Visualization Vector Field Visualization Dr. David Koop Fields Tables Networks & Trees Fields Geometry Clusters, Sets, Lists Items Items (nodes) Grids Items Items Attributes Links
Multipass GPU Surface Rendering in 4D Ultrasound
 2012 Cairo International Biomedical Engineering Conference (CIBEC) Cairo, Egypt, December 20-21, 2012 Multipass GPU Surface Rendering in 4D Ultrasound Ahmed F. Elnokrashy 1,2, Marwan Hassan 1, Tamer Hosny
GVF-Based Transfer Functions for Volume Rendering
 GVF-Based Transfer Functions for Volume Rendering Shaorong Wang 1,2 and Hua Li 1 1 National Research Center for Intelligent Computing Systems, Institute of Computing Technology, Chinese Academy of Sciences,