Road Sign Visualization with Principal Component Analysis and Emergent Self-Organizing Map
|
|
|
- Noreen Bradford
- 5 years ago
- Views:
Transcription
1 Road Sign Visualization with Principal Component Analysis and Emergent Self-Organizing Map H6429: Computational Intelligence, Method and Applications Assignment One report Written By Nguwi Yok Yen G J October 2006 School Of Computer Engineering
2 Contents LIST OF FIGURES 3 LIST OF TABLE 4 1. INTRODUCTION 5 2. PRINCIPAL COMPONENT ANALYSIS (PCA) 7 3. EMERGENT SELF-ORGANIZING MAP (ESOM) U-MAP (DISTANCE-BASED VISUALIZATION) P -MAP (DENSITY BASED VISUALIZATION) U* -MAP (DISTANCE AND DISTANCE BASED VISUALIZATION) OTHER VISUALIZATION EXPERIMENTAL RESULTS THE DATASET VISUALIZATION PCA FIRST PRINCIPAL COMPONENT SECOND PRINCIPAL COMPONENT THIRD PRINCIPAL COMPONENT TENTH PRINCIPAL COMPONENT FIRST VERSUS SECOND PRINCIPAL COMPONENT FIRST VERSUS TENTH PRINCIPAL COMPONENT SUMMARY ESOM ESOM WITH FIRST PRINCIPAL COMPONENT ESOM WITH FIRST AND SECOND PRINCIPAL COMPONENT ESOM WITH TEN PRINCIPAL COMPONENT CONCLUSION 30 BIBLIOGRAPHY 31
3 List of Figures Figure 1 Structures of quad and hex grid, and topologies of bounded and boundless...10 Figure 2 Chain Link with ward clustering...13 Figure 3 The corresponding chain link s U-Matrix, P-Matrix, and U* Matrix...13 Figure 4 Stop sign and give way sign...14 Figure 5 Screenshot of the dataset...15 Figure 6 First principal component of dataset...16 Figure 7 Second principal component of dataset...18 Figure 8 Third principal component of dataset...19 Figure 9 Tenth principal component of dataset...20 Figure 10 First versus second principal component...21 Figure 11 First versus tenth principal component...22 Figure 12 Stop sign s box plot of all ten principal components...23 Figure 13 Give way sign s box plot of all ten principal components...23 Figure 14 Tiled U-Map of first principal component...25 Figure 15 Tiled P-Map of first principal component...26 Figure 16 Tiled U-Map of first and second principal component...27 Figure 17 Tiled P-Map of first and second principal component...27 Figure 18 Tiled U-Map of ten principal component...28 Figure 19 U-Map of ten principal component...29 Figure 20 Tiled P-Map of ten principal component...29
4 List of Table Table 1 Summary of ten principal components... 24
5 1. Introduction Data visualization is an important research field. With lots of useful data sets and information, how do we analyze them, and in which dimension that it shows interesting results? Human observation combines with computational software tools can achieve differing views of the same visualization data. This report presents the visualization of road sign images through the use of PCA and ESOM. The observation obtained through the visualization process will be discussed. Two classes of road signs are investigated; they are namely stop sign and give way sign. The focus of this work is to show how well PCA and ESOM work hand in hand to segregate the two classes. This work attempts to study how the data shows better visualization result through the combination of PCA and ESOM rather than using either one of the technique solely. Road sign images are taken on Singapore roads by the author. The gray scaled properties of the training images results in high dimension features. The features are then processed by PCA to shrink down the dimensions and further analyzed by an ESOM tool. PCA is a useful technique that has been widely used in vast applications for reducing dimensionality, visualization, and finding patterns or clusters in high dimension data. The similarities and differences of data can be shown through the use of PCA. The maps used by most SOM applications are usually small and face significant performance degradation when come to large data set. Using small SOM is similar to k-means clustering with k equal to the number of nodes in the map. Emergent SOM is an extension of SOM. Emergent phenomena involve by defining a large number of individualism, where large means at least a few thousands. It has been demonstrated that using ESOM is a significantly different
6 process from using k-means. ESOM is a powerful tool for clustering, visualization, and classification. The next chapter presents some theoretical background of PCA. Chapter 3 discusses the brief details of ESOM. We shall then evaluates and review the test methodology and visualization results. Lastly, we draw the conclusion of this work.
7 2. Principal Component Analysis (PCA) Principal components analysis is a quantitatively rigorous method to simplify the data structure. The method generates a new set of variables, called principal components. Each principal component is a linear combination of the original variables. All the principal components are orthogonal to each other so there is no redundant information. The principal components as a whole form an orthogonal basis for the space of the data. PCA can be used to find patterns in data, and compress the data. Assuming we have a data vector X with p variables. The idea is to locate a linear combination of the variables such that to achieve large variance in new variable. The j-th principal component PCi is the linear combination of the original variables X1, X2, Xp: Under the condition of (1) Where are coefficients assigned to the original p variables for PCj. (2) The following algorithm is the general process of PCA: Data preparation The data is usually in large dimensional or large features. These data must be pre-processed before computing the various matrixes. Mean subtraction The mean for a given sample set X, is computed using the following formula.
8 (3) However, the mean only shows some centre point of the whole dataset. It is not sufficient to show the nature of the data. We have to consider how spread out the data is. Compute co-variance matrix Variance is the spread of data. Variance and standard deviation only show the relationship of data within its own dimension. Covariance matrix shows the variance between dimensions. The covariance can be computed as follows: (4) The result shows how similar or dissimilar the data are. Positive result shows that the dimensions increase together. Negative result shows that the dimensions decrease together. With covariance equals to zero, it shows that two dimensions are independent of each other. Given a matrix with n rows and n columns, and is xth dimension, the covariance matrix is given by: (5) Compute eigenvectors and eigenvalues Eigenvectors of transformation are vectors which are either left unaffected or simply multiplied by a scale factor after the transformation. The eigenvalue of an eigenvector is the scale factor by which it has been multiplied [1]. (6) Where λ is an eigenvalue of C and v is the associated eigenvector of λ. Eigenvector with the highest eigenvalue is generally the principal component of the data set. It is the most significant relationship between the data dimensions. Determine the component(s) and construct feature vector
9 Feature vector is constructed by taking the eigenvectors of interest, and forms a matrix in columns. The feature vector is then multiplied by the original dataset. (7)
![3. Emergent Self-Organizing Map (ESOM) Self-Organizing maps (SOM), or Self-Organizing Feature Maps (SOFM), are popular tool for clustering and visualization of high dimensional data [2].](/docs-images/88/116484494/images/10-0.jpg "It implements an orderly mapping from a high dimensional data distribution onto a regularly low-dimensional grid of neurons.")

10 3. Emergent Self-Organizing Map (ESOM) Self-Organizing maps (SOM), or Self-Organizing Feature Maps (SOFM), are popular tool for clustering and visualization of high dimensional data [2]. It implements an orderly mapping from a high dimensional data distribution onto a regularly low-dimensional grid of neurons. The goodness of its topological and metric relationship of the input data set is preserved. The ability of self-organizing according to neuron s neighbourhood Euclidean distance is the key feature of SOM. However, the power of self-organizing that allows the emergence of structure in data is often neglected [3]. The maps used in most SOM research are usually very small. The concept of boundless maps (eg toroids map) to avoid border effect is rarely used. These capture great interest by the Data Bionics Research Group who developed the Emergent Self-Organizing Map (ESOM) tool [4]. Emergent Self-Organizing Map may be regarded as a non-linear projection technique using neurons arranged on a map. There are mainly two types of ESOM grid structures in use: hexgrid (honeycomb like) and quadgrid (trellis like) maps. Figure 1 shows the above mentioned grid and topology. Figure 1 Structures of quad and hex grid, and topologies of bounded and boundless [5]
11 ESOM forms a low dimensional grid of high dimensional prototype vectors. The height and distances between matrices are taken into account generally for better visualization. ESOM map consists of U-Map (from U-Matrix), P-Map (from P-Matrix) and U*-Map(combines U and P map). The three maps show the floor space layout for a landscape like visualization o distance and density structure of the high dimensional data space. Structures emerge on top of the map by the cooperation of many neurons. These emerging structures are the main concept of ESOM. How the different maps of ESOM achieve visualization is described below: 3.1 U-Map (Distance-based Visualization) The U-height for each neuron ni is the average distance of ni s weight vectors to the weight vectors of its immediate neighbors N(i). The U-height uh(i) is calculated as follows: A display of all U-heights on top of the map is called a U-Matrix [6]. (8) The height value will be large in area where no or few data points reside, creating mountain ranges for cluster boundaries. The sum will be small in area of high densities.u-map is a visualization of distance measure. The local distance structure is displayed at each neuron as a height value creating a 3D landscape of high dimensional data space. 3.2 P -Map (Density based Visualization) The P-height ph(i) for a neuron ni is a measure of the density of data points in the vicinity of wi: ph(i) = {x E d(x, wj) < r >0, r R}. A display of all P-heights on top of the grid G is called a P-Matrix [7]. Distance based methods usually work well for clearly separated clusters, problems can occur with slowly changing densities and overlapping clusters. Density-based methods more directly
12 measure the density in the data space sampled at the prototype vectors. The P- matrix displays the local density measures with Pareto Density Estimation (PDE) [8]. 3.3 U* -Map (Distance and Distance based Visualization) U*-matrix combines the distance-based U-matrix and the density-based P-matrix. The U*-matrix shows significant improvement over U-matrix in dataset with clusters that are not clearly separated in the high dimensional space. 3.4 Other Visualization The Databionic ESOM tool provides several other visualization functions like Topology-based visualization, Bestmatch visualization, Component visualization and etc. Topology-based visualization shows the topographical errors, like forward projection error and backward projection error. Bestmatch visualization shows each neuron that is the bestmatch for a data point. For demonstration purpose, we adopt chain-link problem set. The chain-link data set [9] consists of 1000 points in A^3 space arranged such that they form the shape of two intertwined three-dimensional rings. The two rings can be thought of as two links of a chain with each one consisting of 500 data objects. This problem illustrates the capabilities of finding the structure of the data even for non-spherical, complex shaped and non-linearly separable clusters. Figure 2 shows the SOM disentangle cluster structures that are not linearly separable. Figure 3 shows the corresponding distance and density measures. Take U*- matrix for example, the chain link data now shows two disentangled clusters.


13 Figure 2 Chain Link with ward clustering Figure 3 The corresponding chain link s U-Matrix, P-Matrix, and U* Matrix
14 4. Experimental Results 4.1 The Dataset The efficiency of PCA and ESOM are tested using road sign images. The images are collected by the author. The dataset consists of two classes of road signs, namely stop sign and give way sign as shown in Figure 4. The images are extracted from road scene images; they are processed manually using image processing applications to make them appear differently. The processes are listed below: Apply different lighting conditions to the images. Add brightness or contrast to the images. In this way, neurons learn to recognise images under varying weather. Rotate the images from the angle of 1 degree to 30 degree. And rotate images in both clockwise and anti-clockwise directions. This allows neuron to recognise tilted road signs. Add different levels of noise to the image. Apply different colours to the background of road sign images. Apply different threshold values to the images. Add some blurring or motion effect on to the images. Sharpen or enhance the pixel values. The dataset contains 157 stop signs and 135 give way signs. They are normalized to the size of 30x30. The gray scaled properties of the image are used. The snapshot of the dataset is shown in Figure 5. Figure 4 Stop sign and give way sign

15 Figure 5 Screenshot of the dataset. 4.2 Visualization The dataset is processed by PCA first to extract ten principal components that correspond to ten dimensions. The aim is to show how many major principal components are sufficient to solve this two class problem PCA First principal component The PCA has been developed under Matlab environment. Figure 6 shows the result of first principal component of the dataset. The first box subplot shows the Quantiles of the data. It shows that the median of give way and stop signs are and respectively. Main distribution of give way sign (within 25%~75% quantiles) falls between to Main distribution of stop sign (within 25%~75% quantiles) falls between to For PC1 (Principal Component 1) function, most
16 of the data points of give away sign is higher than most of the data points of stop sign. The stop sign has a much better distribution comparing to give way sign as the standard deviation for stop sign is smaller. From the second normal subplot, the blue reference line of stop sign fits the data point much better than give way sign. The last plot shows the T-test result. The two circles are very far apart that shows that the two classes get separated very well; very significant different in statistic. Figure 6 First principal component of dataset
17 Second principal component Figure 7 shows the result of second principal component of the dataset. It shows that the median of give way and stop signs are and respectively. From the second sub-plot, it shows that ~10% of the data points for give way sign and stop sign overlap with each other. However, Main distribution of give way sign (within 25%~75% quantiles) falls between the value of to Main distribution of stop sign (within 25%~75% quantiles) falls between to Thus, these two distributions are still significantly different for PC2 (Second Principal Component). The give way sign has a much better distribution comparing to stop sign as the standard deviation for give way sign is smaller. From the second normal subplot, the blue reference line of stop sign fits is steeper than the blue reference line of give way sign. This implies that data points from stop sign are higher than the data points from give way sign. The last plot shows the T- test result. The two circles are still quite far apart that shows that the two classes get separated well but not as far apart as the first principal component result.
18 Figure 7 Second principal component of dataset
19 Third principal component Figure 8 shows the result of third principal component of the dataset. It shows that the median of give way and stop signs are and respectively. From the second sub-plot, the blue reference line of give way sign crosses over the blue reference line of stop sign at 50% quantitles. In the last T-test result, the two circles are not far apart that shows that the two classes are comparable to each others and they are inseparable. Figure 8 Third principal component of dataset
20 Tenth principal component Figure 9 shows the result of last principal component of the dataset. It shows that the median of give way and stop signs are and respectively. From the second sub-plot, it shows that most of the data points are give way sign is comparable to stop sign. In the last T-test result, the two circles overlap with each other. Thus, these two classes are comparable to each other and inseparable. Figure 9 Tenth principal component of dataset
21 First versus second principal component Figure 10 shows the relationship of first and second principal components. It can be seen that there are some red data point crossing over to the green boundary. The green data point of stop sign has wider spread. For give way sign, F1 function showed strong positive correlation to F2 function; the R square is Their fit model can be explained by the equation, F1 = F2. For stop sign, F1 function showed minor positive correlation to F2 function; the R square is quite low, Their fit model can be explained by the equation, F1 = F2. Figure 10 First versus second principal component
22 First versus tenth principal component Figure 11 shows the relationship of first and tenth principal components. The figure shows that there is no correlation for PC1 and PC10 for both give way and stop sign as both their R square values are very low. Figure 11 First versus tenth principal component Summary Figure 13 and Figure 13 give an overview of all the ten principal components for stop sign and give way sign respectively. It is significant from the plots that the first two components show larger variation comparing to the rest which vary very narrowly. They are generated using the software GhostMiner [10]. Table 1 summarizes all the related statistics figures for the ten principal components.


23 Figure 12 Stop sign s box plot of all ten principal components Figure 13 Give way sign s box plot of all ten principal components
24 Table 1 Summary of ten principal components ESOM To investigate the behavior of different principal components when apply to ESOM, we will first look at ESOM with first principal component, ESOM with first and second principal components, and lastly ESOM with all the ten principal components ESOM with first principal component As shown in Figure 14 is the training result of applying first principal component result to ESOM after 200 epochs. Yellow color shows the distribution of stop sign, red color corresponds to give way sign. It can be shown that there exist many give way sign data points that are position in the stop sign area which confuses the result. The mis-classify data points are circled in black in the figure. U-Map shows the distance measure between data points. Large U-Matrix corresponds to dark colour (blue in the earth colour scheme adopted), it
, it means that there are very few data points surrounding that area.")
25 means that there are many data points surrounding that area. Small U-Matrix corresponds to light colour (white in the earth colour scheme adopted), it means that there are very few data points surrounding that area. Figure 15 shows the density measure, the P-Map. It works in the similar manner as in U-Map. Figure 14 Tiled U-Map of first principal component

26 Figure 15 Tiled P-Map of first principal component ESOM with first and second principal component As shown in Figure 16 is the training result of applying first and second principal component result to ESOM after 200 epochs. Yellow colour shows the distribution of stop sign, red colour corresponds to give way sign. The mis-classify data points as circled in black are significantly reduced comparing to the result of previous section. There are eight circled outliers in the figure, but this map is a tiled version of four grids so the actual outlier points are two. Figure 17 shows the density measure, the P-Map.

27 Figure 16 Tiled U-Map of first and second principal component Figure 17 Tiled P-Map of first and second principal component

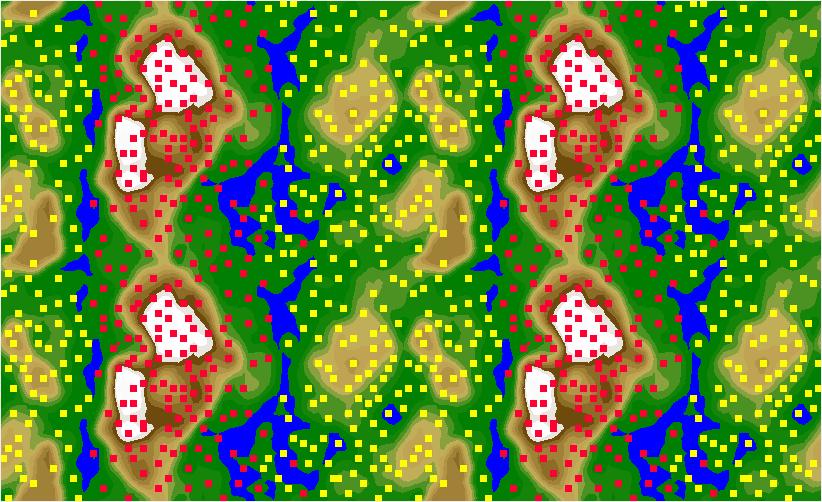
28 ESOM with ten principal component As shown in Figure 18 is the training result of applying ten principal component results to ESOM after 200 epochs. Yellow colour shows the distribution of stop sign, red colour corresponds to give way sign. The result is very encouraging; it clearly shows the clusters of the two classes without a single outlier. The two classes are separated successfully with the use of ten principal components with ESOM. Figure 19 displays the original U-Map without tiled. The borderless map which tiled four copies of the grid can show better visualization because clusters stretching over the edge of the grid image can be seen connected. Figure 20 shows the density measure, the P-Map. It can be seen that most of the yellow stop sign data points are very densely on top. Figure 18 Tiled U-Map of ten principal component


29 Figure 19 U-Map of ten principal component Figure 20 Tiled P-Map of ten principal component
30 5. Conclusion This assignment presents the visualization of using PCA and ESOM. The basic theory of PCA and ESOM was described in Chapter 2 and 3. The visualization result was presented in the previous chapter. This work uses a two class road sign problem set as data which consists of a total of 292 stop sign and give way sign images. Principal components analysis is a quantitatively rigorous method to simplify the data structure. The method generates a new set of variables, called principal components. Each principal component is a linear combination of the original variables. In this work, we have seen the visualization result of PCA on its own. Also, the visualization result of applying PCA prior to ESOM was reviewed. ESOM is an extension of SOM which is significantly different from the concept of K-Means clustering. Emergent phenomena involve by defining a large number of individual, it allows the emergence of intrinsic structural features of the data space. ESOM overcomes the finite border effect of general SOM. ESOM achieve the finite but borderless map by connecting the top row of the map to the bottom row of the map, and left to right within the lattice. We have seen in the last section of Chapter 4 that the result of applying ten principal components to ESOM in tiled U-Map and P-Map. The tiled U-map shows the linking border which is hard to visualize without tiling. ESOM results demonstrate that the first and first two principal components are insufficient to segregate the two class road sign problem set. With ten principal components, U-Map and P-Map show excellent clustering picture as shown in Figure 18 and Figure 20.
31 Bibliography [1] Wikipedia, [Online]. Available: [2] T. Kohonen, The self-organizing map, Neurocomput., vol. 21, pp. 1 6, [3] Ultsch, A. & Mörchen F., ESOM-Maps: tools for clustering, visualization, and classification with Emergent SOM, Technichal Report No. 46, Dept. of Mathematics and Computer Science, University of Marburg, Germany [4] Databionics ESOM Tools. [Online]. Available: [5] Databionics Research Group, Emergent Self-Organizing Map [Online]. Available: [6] A.Ultsch, H.P.Siemon, Kohonen's Self Organizing Feature Maps for Exploratory Data Analysis, Proc. Intern. Neural Networks, Kluwer Academic Press, Paris, , [7] A.Ultsch, Maps for the Visualization of high-dimensional Data Spaces, Proc. WSOM, Kyushu, Japan, , 2006 [8] Ultsch, A.: Pareto Density Estimation: A Density Estimation for Knowledge Discovery, Baier D., Wernecke K.D. (Eds), In Innovations in Classification, Data Science, and Information Systems - Proceedings 27th Annual Conference of the German Classification Society (GfKL) 2003, Berlin, Heidelberg, Springer, pp , 2003 [9] Ultsch, A. Self-Organizing Neural Networks for Visualization and Classification. In: O. Opitz et al. (Eds). Information and Classification. Springer, Berlin, pp , [10] Fujitsu, Ghost Miner, [Online]. Available:
ESOM-Maps: tools for clustering, visualization, and classification with Emergent SOM
 ESOM-Maps: tools for clustering, visualization, and classification with Emergent SOM Alfred Ultsch, Fabian Mörchen Data Bionics Research Group, University of Marburg D-35032 Marburg, Germany March 17,
Package Umatrix. December 18, 2017
 Type Package Package Umatrix December 18, 2017 Title Visualization of Structures in High-Dimensional Data Version 3.1 Date 2017-12-06 Author Florian Lerch[aut,cre], Michael Thrun[aut], Felix Pape[ctb],
COMBINED METHOD TO VISUALISE AND REDUCE DIMENSIONALITY OF THE FINANCIAL DATA SETS
 COMBINED METHOD TO VISUALISE AND REDUCE DIMENSIONALITY OF THE FINANCIAL DATA SETS Toomas Kirt Supervisor: Leo Võhandu Tallinn Technical University Toomas.Kirt@mail.ee Abstract: Key words: For the visualisation
CIE L*a*b* color model
 CIE L*a*b* color model To further strengthen the correlation between the color model and human perception, we apply the following non-linear transformation: with where (X n,y n,z n ) are the tristimulus
Visualization and Clustering of Tagged Music Data
 Visualization and Clustering of Tagged Music Data Pascal Lehwark 1, Sebastian Risi 2, and Alfred Ultsch 3 1 Databionics Research Group, Philipps University Marburg pascal@indiji.com 2 Databionics Research
Clustering and Visualisation of Data
 Clustering and Visualisation of Data Hiroshi Shimodaira January-March 28 Cluster analysis aims to partition a data set into meaningful or useful groups, based on distances between data points. In some
Advanced visualization techniques for Self-Organizing Maps with graph-based methods
 Advanced visualization techniques for Self-Organizing Maps with graph-based methods Georg Pölzlbauer 1, Andreas Rauber 1, and Michael Dittenbach 2 1 Department of Software Technology Vienna University
Artificial Neural Networks Unsupervised learning: SOM
 Artificial Neural Networks Unsupervised learning: SOM 01001110 01100101 01110101 01110010 01101111 01101110 01101111 01110110 01100001 00100000 01110011 01101011 01110101 01110000 01101001 01101110 01100001
Graph projection techniques for Self-Organizing Maps
 Graph projection techniques for Self-Organizing Maps Georg Pölzlbauer 1, Andreas Rauber 1, Michael Dittenbach 2 1- Vienna University of Technology - Department of Software Technology Favoritenstr. 9 11
U*-Matrix: a Tool to visualize Clusters in high dimensional Data.
 U*Matrix 1 U*-Matrix: a Tool to visualize Clusters in high dimensional Data. Alfred Ultsch DataBionics Research Lab, Department of Computer Science University of Marburg, D-35032 Marburg, Germany ultsch@informatik.uni-marburg.de
Network Traffic Measurements and Analysis
 DEIB - Politecnico di Milano Fall, 2017 Introduction Often, we have only a set of features x = x 1, x 2,, x n, but no associated response y. Therefore we are not interested in prediction nor classification,
Biometrics Technology: Image Processing & Pattern Recognition (by Dr. Dickson Tong)
") Biometrics Technology: Image Processing & Pattern Recognition (by Dr. Dickson Tong) References: [1] http://homepages.inf.ed.ac.uk/rbf/hipr2/index.htm [2] http://www.cs.wisc.edu/~dyer/cs540/notes/vision.html
Biometrics Technology: Image Processing & Pattern Recognition (by Dr. Dickson Tong) References: [1] http://homepages.inf.ed.ac.uk/rbf/hipr2/index.htm [2] http://www.cs.wisc.edu/~dyer/cs540/notes/vision.html
Color Space Projection, Feature Fusion and Concurrent Neural Modules for Biometric Image Recognition
 Proceedings of the 5th WSEAS Int. Conf. on COMPUTATIONAL INTELLIGENCE, MAN-MACHINE SYSTEMS AND CYBERNETICS, Venice, Italy, November 20-22, 2006 286 Color Space Projection, Fusion and Concurrent Neural
Figure (5) Kohonen Self-Organized Map
 Kohonen Self-Organized Map") 2- KOHONEN SELF-ORGANIZING MAPS (SOM) - The self-organizing neural networks assume a topological structure among the cluster units. - There are m cluster units, arranged in a one- or two-dimensional array;
2- KOHONEN SELF-ORGANIZING MAPS (SOM) - The self-organizing neural networks assume a topological structure among the cluster units. - There are m cluster units, arranged in a one- or two-dimensional array;
Dimension reduction : PCA and Clustering
 Dimension reduction : PCA and Clustering By Hanne Jarmer Slides by Christopher Workman Center for Biological Sequence Analysis DTU The DNA Array Analysis Pipeline Array design Probe design Question Experimental
Regression on SAT Scores of 374 High Schools and K-means on Clustering Schools
 Regression on SAT Scores of 374 High Schools and K-means on Clustering Schools Abstract In this project, we study 374 public high schools in New York City. The project seeks to use regression techniques
PATTERN RECOGNITION USING NEURAL NETWORKS
 PATTERN RECOGNITION USING NEURAL NETWORKS Santaji Ghorpade 1, Jayshree Ghorpade 2 and Shamla Mantri 3 1 Department of Information Technology Engineering, Pune University, India santaji_11jan@yahoo.co.in,
Inf2B assignment 2. Natural images classification. Hiroshi Shimodaira and Pol Moreno. Submission due: 4pm, Wednesday 30 March 2016.
 Inf2B assignment 2 (Ver. 1.2) Natural images classification Submission due: 4pm, Wednesday 30 March 2016 Hiroshi Shimodaira and Pol Moreno This assignment is out of 100 marks and forms 12.5% of your final
UNIVERSITY OF OSLO. Faculty of Mathematics and Natural Sciences
 UNIVERSITY OF OSLO Faculty of Mathematics and Natural Sciences Exam: INF 4300 / INF 9305 Digital image analysis Date: Thursday December 21, 2017 Exam hours: 09.00-13.00 (4 hours) Number of pages: 8 pages
COMPUTER AND ROBOT VISION
 VOLUME COMPUTER AND ROBOT VISION Robert M. Haralick University of Washington Linda G. Shapiro University of Washington A^ ADDISON-WESLEY PUBLISHING COMPANY Reading, Massachusetts Menlo Park, California
Comparison of supervised self-organizing maps using Euclidian or Mahalanobis distance in classification context
 6 th. International Work Conference on Artificial and Natural Neural Networks (IWANN2001), Granada, June 13-15 2001 Comparison of supervised self-organizing maps using Euclidian or Mahalanobis distance
CSC 411: Lecture 14: Principal Components Analysis & Autoencoders
 CSC 411: Lecture 14: Principal Components Analysis & Autoencoders Raquel Urtasun & Rich Zemel University of Toronto Nov 4, 2015 Urtasun & Zemel (UofT) CSC 411: 14-PCA & Autoencoders Nov 4, 2015 1 / 18
Sobel Edge Detection Algorithm
 Sobel Edge Detection Algorithm Samta Gupta 1, Susmita Ghosh Mazumdar 2 1 M. Tech Student, Department of Electronics & Telecom, RCET, CSVTU Bhilai, India 2 Reader, Department of Electronics & Telecom, RCET,
Texture Classification by Combining Local Binary Pattern Features and a Self-Organizing Map
 Texture Classification by Combining Local Binary Pattern Features and a Self-Organizing Map Markus Turtinen, Topi Mäenpää, and Matti Pietikäinen Machine Vision Group, P.O.Box 4500, FIN-90014 University
A Fast Personal Palm print Authentication based on 3D-Multi Wavelet Transformation
 A Fast Personal Palm print Authentication based on 3D-Multi Wavelet Transformation * A. H. M. Al-Helali, * W. A. Mahmmoud, and * H. A. Ali * Al- Isra Private University Email: adnan_hadi@yahoo.com Abstract:
Extract an Essential Skeleton of a Character as a Graph from a Character Image
 Extract an Essential Skeleton of a Character as a Graph from a Character Image Kazuhisa Fujita University of Electro-Communications 1-5-1 Chofugaoka, Chofu, Tokyo, 182-8585 Japan k-z@nerve.pc.uec.ac.jp
Unsupervised Learning
 Networks for Pattern Recognition, 2014 Networks for Single Linkage K-Means Soft DBSCAN PCA Networks for Kohonen Maps Linear Vector Quantization Networks for Problems/Approaches in Machine Learning Supervised
Introduction to Machine Learning Prof. Anirban Santara Department of Computer Science and Engineering Indian Institute of Technology, Kharagpur
 Introduction to Machine Learning Prof. Anirban Santara Department of Computer Science and Engineering Indian Institute of Technology, Kharagpur Lecture 14 Python Exercise on knn and PCA Hello everyone,
Principal Component Image Interpretation A Logical and Statistical Approach
 Principal Component Image Interpretation A Logical and Statistical Approach Md Shahid Latif M.Tech Student, Department of Remote Sensing, Birla Institute of Technology, Mesra Ranchi, Jharkhand-835215 Abstract
SYDE Winter 2011 Introduction to Pattern Recognition. Clustering
 SYDE 372 - Winter 2011 Introduction to Pattern Recognition Clustering Alexander Wong Department of Systems Design Engineering University of Waterloo Outline 1 2 3 4 5 All the approaches we have learned
Recognizing Handwritten Digits Using the LLE Algorithm with Back Propagation
 Recognizing Handwritten Digits Using the LLE Algorithm with Back Propagation Lori Cillo, Attebury Honors Program Dr. Rajan Alex, Mentor West Texas A&M University Canyon, Texas 1 ABSTRACT. This work is
Facial Expression Detection Using Implemented (PCA) Algorithm
 Algorithm") Facial Expression Detection Using Implemented (PCA) Algorithm Dileep Gautam (M.Tech Cse) Iftm University Moradabad Up India Abstract: Facial expression plays very important role in the communication with
Facial Expression Detection Using Implemented (PCA) Algorithm Dileep Gautam (M.Tech Cse) Iftm University Moradabad Up India Abstract: Facial expression plays very important role in the communication with
Clustering CS 550: Machine Learning
 Clustering CS 550: Machine Learning This slide set mainly uses the slides given in the following links: http://www-users.cs.umn.edu/~kumar/dmbook/ch8.pdf http://www-users.cs.umn.edu/~kumar/dmbook/dmslides/chap8_basic_cluster_analysis.pdf
An Intelligent Clustering Algorithm for High Dimensional and Highly Overlapped Photo-Thermal Infrared Imaging Data
 An Intelligent Clustering Algorithm for High Dimensional and Highly Overlapped Photo-Thermal Infrared Imaging Data Nian Zhang and Lara Thompson Department of Electrical and Computer Engineering, University
An Adaptive Approach for Image Contrast Enhancement using Local Correlation
 Global Journal of Pure and Applied Mathematics. ISSN 0973-1768 Volume 12, Number 6 (2016), pp. 4893 4899 Research India Publications http://www.ripublication.com/gjpam.htm An Adaptive Approach for Image
Practice Exam Sample Solutions
 CS 675 Computer Vision Instructor: Marc Pomplun Practice Exam Sample Solutions Note that in the actual exam, no calculators, no books, and no notes allowed. Question 1: out of points Question 2: out of
Unsupervised Learning : Clustering
 Unsupervised Learning : Clustering Things to be Addressed Traditional Learning Models. Cluster Analysis K-means Clustering Algorithm Drawbacks of traditional clustering algorithms. Clustering as a complex
CHAPTER 3 IMAGE ENHANCEMENT IN THE SPATIAL DOMAIN
 CHAPTER 3 IMAGE ENHANCEMENT IN THE SPATIAL DOMAIN CHAPTER 3: IMAGE ENHANCEMENT IN THE SPATIAL DOMAIN Principal objective: to process an image so that the result is more suitable than the original image
An adaptive container code character segmentation algorithm Yajie Zhu1, a, Chenglong Liang2, b
 6th International Conference on Machinery, Materials, Environment, Biotechnology and Computer (MMEBC 2016) An adaptive container code character segmentation algorithm Yajie Zhu1, a, Chenglong Liang2, b
IMAGE PROCESSING AND IMAGE REGISTRATION ON SPIRAL ARCHITECTURE WITH salib
 IMAGE PROCESSING AND IMAGE REGISTRATION ON SPIRAL ARCHITECTURE WITH salib Stefan Bobe 1 and Gerald Schaefer 2,* 1 University of Applied Sciences, Bielefeld, Germany. 2 School of Computing and Informatics,
CSC 411: Lecture 14: Principal Components Analysis & Autoencoders
 CSC 411: Lecture 14: Principal Components Analysis & Autoencoders Richard Zemel, Raquel Urtasun and Sanja Fidler University of Toronto Zemel, Urtasun, Fidler (UofT) CSC 411: 14-PCA & Autoencoders 1 / 18
Principal Component Analysis (PCA) is a most practicable. statistical technique. Its application plays a major role in many
 is a most practicable. statistical technique. Its application plays a major role in many") CHAPTER 3 PRINCIPAL COMPONENT ANALYSIS ON EIGENFACES 2D AND 3D MODEL 3.1 INTRODUCTION Principal Component Analysis (PCA) is a most practicable statistical technique. Its application plays a major role
CHAPTER 3 PRINCIPAL COMPONENT ANALYSIS ON EIGENFACES 2D AND 3D MODEL 3.1 INTRODUCTION Principal Component Analysis (PCA) is a most practicable statistical technique. Its application plays a major role
AUTOMATIC IMAGE ORIENTATION BY USING GIS DATA
 AUTOMATIC IMAGE ORIENTATION BY USING GIS DATA Jeffrey J. SHAN Geomatics Engineering, School of Civil Engineering Purdue University IN 47907-1284, West Lafayette, U.S.A. jshan@ecn.purdue.edu Working Group
CS 195-5: Machine Learning Problem Set 5
 CS 195-5: Machine Learning Problem Set 5 Douglas Lanman dlanman@brown.edu 26 November 26 1 Clustering and Vector Quantization Problem 1 Part 1: In this problem we will apply Vector Quantization (VQ) to
Robust Kernel Methods in Clustering and Dimensionality Reduction Problems
 Robust Kernel Methods in Clustering and Dimensionality Reduction Problems Jian Guo, Debadyuti Roy, Jing Wang University of Michigan, Department of Statistics Introduction In this report we propose robust
Visual object classification by sparse convolutional neural networks
 Visual object classification by sparse convolutional neural networks Alexander Gepperth 1 1- Ruhr-Universität Bochum - Institute for Neural Dynamics Universitätsstraße 150, 44801 Bochum - Germany Abstract.
Classification. Vladimir Curic. Centre for Image Analysis Swedish University of Agricultural Sciences Uppsala University
 Classification Vladimir Curic Centre for Image Analysis Swedish University of Agricultural Sciences Uppsala University Outline An overview on classification Basics of classification How to choose appropriate
Dimension Reduction CS534
 Dimension Reduction CS534 Why dimension reduction? High dimensionality large number of features E.g., documents represented by thousands of words, millions of bigrams Images represented by thousands of
A SOM-view of oilfield data: A novel vector field visualization for Self-Organizing Maps and its applications in the petroleum industry
 A SOM-view of oilfield data: A novel vector field visualization for Self-Organizing Maps and its applications in the petroleum industry Georg Pölzlbauer, Andreas Rauber (Department of Software Technology
Lecture 4: Spatial Domain Transformations
 # Lecture 4: Spatial Domain Transformations Saad J Bedros sbedros@umn.edu Reminder 2 nd Quiz on the manipulator Part is this Fri, April 7 205, :5 AM to :0 PM Open Book, Open Notes, Focus on the material
Seismic facies analysis using generative topographic mapping
 Satinder Chopra + * and Kurt J. Marfurt + Arcis Seismic Solutions, Calgary; The University of Oklahoma, Norman Summary Seismic facies analysis is commonly carried out by classifying seismic waveforms based
WORD Creating Objects: Tables, Charts and More
 WORD 2007 Creating Objects: Tables, Charts and More Microsoft Office 2007 TABLE OF CONTENTS TABLES... 1 TABLE LAYOUT... 1 TABLE DESIGN... 2 CHARTS... 4 PICTURES AND DRAWINGS... 8 USING DRAWINGS... 8 Drawing
Reduced Image Noise on Shape Recognition Using Singular Value Decomposition for Pick and Place Robotic Systems
 Reduced Image Noise on Shape Recognition Using Singular Value Decomposition for Pick and Place Robotic Systems Angelo A. Beltran Jr. 1, Christian Deus T. Cayao 2, Jay-K V. Delicana 3, Benjamin B. Agraan
Redundant Data Elimination for Image Compression and Internet Transmission using MATLAB
 Redundant Data Elimination for Image Compression and Internet Transmission using MATLAB R. Challoo, I.P. Thota, and L. Challoo Texas A&M University-Kingsville Kingsville, Texas 78363-8202, U.S.A. ABSTRACT
CHAPTER 6 MODIFIED FUZZY TECHNIQUES BASED IMAGE SEGMENTATION
 CHAPTER 6 MODIFIED FUZZY TECHNIQUES BASED IMAGE SEGMENTATION 6.1 INTRODUCTION Fuzzy logic based computational techniques are becoming increasingly important in the medical image analysis arena. The significant
Lecture 8 Object Descriptors
 Lecture 8 Object Descriptors Azadeh Fakhrzadeh Centre for Image Analysis Swedish University of Agricultural Sciences Uppsala University 2 Reading instructions Chapter 11.1 11.4 in G-W Azadeh Fakhrzadeh
Cluster Analysis and Visualization. Workshop on Statistics and Machine Learning 2004/2/6
 Cluster Analysis and Visualization Workshop on Statistics and Machine Learning 2004/2/6 Outlines Introduction Stages in Clustering Clustering Analysis and Visualization One/two-dimensional Data Histogram,
EXAM SOLUTIONS. Image Processing and Computer Vision Course 2D1421 Monday, 13 th of March 2006,
 School of Computer Science and Communication, KTH Danica Kragic EXAM SOLUTIONS Image Processing and Computer Vision Course 2D1421 Monday, 13 th of March 2006, 14.00 19.00 Grade table 0-25 U 26-35 3 36-45
Scott Foresman Investigations in Number, Data, and Space Content Scope & Sequence Correlated to Academic Language Notebooks The Language of Math
 Scott Foresman Investigations in Number, Data, and Space Content Scope & Sequence Correlated to Academic Language Notebooks The Language of Math Grade 5 Content Scope & Sequence Unit 1: Number Puzzles
DESIGNING ALGORITHMS FOR SEARCHING FOR OPTIMAL/TWIN POINTS OF SALE IN EXPANSION STRATEGIES FOR GEOMARKETING TOOLS
 X MODELLING WEEK DESIGNING ALGORITHMS FOR SEARCHING FOR OPTIMAL/TWIN POINTS OF SALE IN EXPANSION STRATEGIES FOR GEOMARKETING TOOLS FACULTY OF MATHEMATICS PARTICIPANTS: AMANDA CABANILLAS (UCM) MIRIAM FERNÁNDEZ
Scott Foresman Investigations in Number, Data, and Space Content Scope & Sequence
 Scott Foresman Investigations in Number, Data, and Space Content Scope & Sequence Correlated to Academic Language Notebooks The Language of Math Grade 4 Content Scope & Sequence Unit 1: Factors, Multiples,
Face detection and recognition. Detection Recognition Sally
 Face detection and recognition Detection Recognition Sally Face detection & recognition Viola & Jones detector Available in open CV Face recognition Eigenfaces for face recognition Metric learning identification
Affine Arithmetic Self Organizing Map
 Affine Arithmetic Self Organizing Map Tony Bazzi Department of Electrical and Systems Engineering Oakland University Rochester, MI 48309, USA Email: tbazzi [AT] oakland.edu Jasser Jasser Department of
Design and Performance Improvements for Fault Detection in Tightly-Coupled Multi-Robot Team Tasks
 Design and Performance Improvements for Fault Detection in Tightly-Coupled Multi-Robot Team Tasks Xingyan Li and Lynne E. Parker Distributed Intelligence Laboratory, Department of Electrical Engineering
Workload Characterization Techniques
 Workload Characterization Techniques Raj Jain Washington University in Saint Louis Saint Louis, MO 63130 Jain@cse.wustl.edu These slides are available on-line at: http://www.cse.wustl.edu/~jain/cse567-08/
MSA220 - Statistical Learning for Big Data
 MSA220 - Statistical Learning for Big Data Lecture 13 Rebecka Jörnsten Mathematical Sciences University of Gothenburg and Chalmers University of Technology Clustering Explorative analysis - finding groups
Exploratory Data Analysis using Self-Organizing Maps. Madhumanti Ray
 Exploratory Data Analysis using Self-Organizing Maps Madhumanti Ray Content Introduction Data Analysis methods Self-Organizing Maps Conclusion Visualization of high-dimensional data items Exploratory data
Gradient visualization of grouped component planes on the SOM lattice
 Gradient visualization of grouped component planes on the SOM lattice Gradient visualization of grouped component planes on the SOM lattice Georg Pölzlbauer 1, Michael Dittenbach 2, Andreas Rauber 1 1
Machine Learning : Clustering, Self-Organizing Maps
 Machine Learning Clustering, Self-Organizing Maps 12/12/2013 Machine Learning : Clustering, Self-Organizing Maps Clustering The task: partition a set of objects into meaningful subsets (clusters). The
Linear Discriminant Analysis in Ottoman Alphabet Character Recognition
 Linear Discriminant Analysis in Ottoman Alphabet Character Recognition ZEYNEB KURT, H. IREM TURKMEN, M. ELIF KARSLIGIL Department of Computer Engineering, Yildiz Technical University, 34349 Besiktas /
Exploratory data analysis for microarrays
 Exploratory data analysis for microarrays Jörg Rahnenführer Computational Biology and Applied Algorithmics Max Planck Institute for Informatics D-66123 Saarbrücken Germany NGFN - Courses in Practical DNA
5.6 Self-organizing maps (SOM) [Book, Sect. 10.3]
![5.6 Self-organizing maps (SOM) [Book, Sect. 10.3]](/thumbs/88/116484380.jpg "5.6 Self-organizing maps (SOM) [Book, Sect. 10.3]") Ch.5 Classification and Clustering 5.6 Self-organizing maps (SOM) [Book, Sect. 10.3] The self-organizing map (SOM) method, introduced by Kohonen (1982, 2001), approximates a dataset in multidimensional
Ch.5 Classification and Clustering 5.6 Self-organizing maps (SOM) [Book, Sect. 10.3] The self-organizing map (SOM) method, introduced by Kohonen (1982, 2001), approximates a dataset in multidimensional
This research aims to present a new way of visualizing multi-dimensional data using generalized scatterplots by sensitivity coefficients to highlight
 This research aims to present a new way of visualizing multi-dimensional data using generalized scatterplots by sensitivity coefficients to highlight local variation of one variable with respect to another.
INF 4300 Classification III Anne Solberg The agenda today:
 INF 4300 Classification III Anne Solberg 28.10.15 The agenda today: More on estimating classifier accuracy Curse of dimensionality and simple feature selection knn-classification K-means clustering 28.10.15
CPSC 340: Machine Learning and Data Mining. Multi-Dimensional Scaling Fall 2017
 CPSC 340: Machine Learning and Data Mining Multi-Dimensional Scaling Fall 2017 Assignment 4: Admin 1 late day for tonight, 2 late days for Wednesday. Assignment 5: Due Monday of next week. Final: Details
Mapping of Hierarchical Activation in the Visual Cortex Suman Chakravartula, Denise Jones, Guillaume Leseur CS229 Final Project Report. Autumn 2008.
 Mapping of Hierarchical Activation in the Visual Cortex Suman Chakravartula, Denise Jones, Guillaume Leseur CS229 Final Project Report. Autumn 2008. Introduction There is much that is unknown regarding
A novel firing rule for training Kohonen selforganising
 A novel firing rule for training Kohonen selforganising maps D. T. Pham & A. B. Chan Manufacturing Engineering Centre, School of Engineering, University of Wales Cardiff, P.O. Box 688, Queen's Buildings,
Gray-Level Reduction Using Local Spatial Features
 Computer Vision and Image Understanding 78, 336 350 (2000) doi:10.1006/cviu.2000.0838, available online at http://www.idealibrary.com on Gray-Level Reduction Using Local Spatial Features Nikos Papamarkos
Training-Free, Generic Object Detection Using Locally Adaptive Regression Kernels
 Training-Free, Generic Object Detection Using Locally Adaptive Regression Kernels IEEE TRANSACTIONS ON PATTERN ANALYSIS AND MACHINE INTELLIENCE, VOL.32, NO.9, SEPTEMBER 2010 Hae Jong Seo, Student Member,
Spectral Classification
 Spectral Classification Spectral Classification Supervised versus Unsupervised Classification n Unsupervised Classes are determined by the computer. Also referred to as clustering n Supervised Classes
Image Processing. Image Features
 Image Processing Image Features Preliminaries 2 What are Image Features? Anything. What they are used for? Some statements about image fragments (patches) recognition Search for similar patches matching
Feature Selection Using Principal Feature Analysis
 Feature Selection Using Principal Feature Analysis Ira Cohen Qi Tian Xiang Sean Zhou Thomas S. Huang Beckman Institute for Advanced Science and Technology University of Illinois at Urbana-Champaign Urbana,
Lecture Topic Projects
 Lecture Topic Projects 1 Intro, schedule, and logistics 2 Applications of visual analytics, basic tasks, data types 3 Introduction to D3, basic vis techniques for non-spatial data Project #1 out 4 Data
Establishing Virtual Private Network Bandwidth Requirement at the University of Wisconsin Foundation
 Establishing Virtual Private Network Bandwidth Requirement at the University of Wisconsin Foundation by Joe Madden In conjunction with ECE 39 Introduction to Artificial Neural Networks and Fuzzy Systems
Unsupervised Learning
 Unsupervised Learning Learning without a teacher No targets for the outputs Networks which discover patterns, correlations, etc. in the input data This is a self organisation Self organising networks An
Cartographic Selection Using Self-Organizing Maps
 1 Cartographic Selection Using Self-Organizing Maps Bin Jiang 1 and Lars Harrie 2 1 Division of Geomatics, Institutionen för Teknik University of Gävle, SE-801 76 Gävle, Sweden e-mail: bin.jiang@hig.se
PROBLEM FORMULATION AND RESEARCH METHODOLOGY
 PROBLEM FORMULATION AND RESEARCH METHODOLOGY ON THE SOFT COMPUTING BASED APPROACHES FOR OBJECT DETECTION AND TRACKING IN VIDEOS CHAPTER 3 PROBLEM FORMULATION AND RESEARCH METHODOLOGY The foregoing chapter
Spatial Enhancement Definition
 Spatial Enhancement Nickolas Faust The Electro- Optics, Environment, and Materials Laboratory Georgia Tech Research Institute Georgia Institute of Technology Definition Spectral enhancement relies on changing
Performance Degradation Assessment and Fault Diagnosis of Bearing Based on EMD and PCA-SOM
 Performance Degradation Assessment and Fault Diagnosis of Bearing Based on EMD and PCA-SOM Lu Chen and Yuan Hang PERFORMANCE DEGRADATION ASSESSMENT AND FAULT DIAGNOSIS OF BEARING BASED ON EMD AND PCA-SOM.
CSE 547: Machine Learning for Big Data Spring Problem Set 2. Please read the homework submission policies.
 CSE 547: Machine Learning for Big Data Spring 2019 Problem Set 2 Please read the homework submission policies. 1 Principal Component Analysis and Reconstruction (25 points) Let s do PCA and reconstruct
MRT based Adaptive Transform Coder with Classified Vector Quantization (MATC-CVQ)
") 5 MRT based Adaptive Transform Coder with Classified Vector Quantization (MATC-CVQ) Contents 5.1 Introduction.128 5.2 Vector Quantization in MRT Domain Using Isometric Transformations and Scaling.130 5.2.1
5 MRT based Adaptive Transform Coder with Classified Vector Quantization (MATC-CVQ) Contents 5.1 Introduction.128 5.2 Vector Quantization in MRT Domain Using Isometric Transformations and Scaling.130 5.2.1
Statistical Analysis of Metabolomics Data. Xiuxia Du Department of Bioinformatics & Genomics University of North Carolina at Charlotte
 Statistical Analysis of Metabolomics Data Xiuxia Du Department of Bioinformatics & Genomics University of North Carolina at Charlotte Outline Introduction Data pre-treatment 1. Normalization 2. Centering,
Schedule for Rest of Semester
 Schedule for Rest of Semester Date Lecture Topic 11/20 24 Texture 11/27 25 Review of Statistics & Linear Algebra, Eigenvectors 11/29 26 Eigenvector expansions, Pattern Recognition 12/4 27 Cameras & calibration
Analysis of Functional MRI Timeseries Data Using Signal Processing Techniques
 Analysis of Functional MRI Timeseries Data Using Signal Processing Techniques Sea Chen Department of Biomedical Engineering Advisors: Dr. Charles A. Bouman and Dr. Mark J. Lowe S. Chen Final Exam October
DIGITAL SURFACE MODELS OF CITY AREAS BY VERY HIGH RESOLUTION SPACE IMAGERY
 DIGITAL SURFACE MODELS OF CITY AREAS BY VERY HIGH RESOLUTION SPACE IMAGERY Jacobsen, K. University of Hannover, Institute of Photogrammetry and Geoinformation, Nienburger Str.1, D30167 Hannover phone +49
Cluster Analysis using Spherical SOM
 Cluster Analysis using Spherical SOM H. Tokutaka 1, P.K. Kihato 2, K. Fujimura 2 and M. Ohkita 2 1) SOM Japan Co-LTD, 2) Electrical and Electronic Department, Tottori University Email: {tokutaka@somj.com,
Nonlinear dimensionality reduction of large datasets for data exploration
 Data Mining VII: Data, Text and Web Mining and their Business Applications 3 Nonlinear dimensionality reduction of large datasets for data exploration V. Tomenko & V. Popov Wessex Institute of Technology,
OBJECT SORTING IN MANUFACTURING INDUSTRIES USING IMAGE PROCESSING
 OBJECT SORTING IN MANUFACTURING INDUSTRIES USING IMAGE PROCESSING Manoj Sabnis 1, Vinita Thakur 2, Rujuta Thorat 2, Gayatri Yeole 2, Chirag Tank 2 1 Assistant Professor, 2 Student, Department of Information
Image Classification Using Wavelet Coefficients in Low-pass Bands
 Proceedings of International Joint Conference on Neural Networks, Orlando, Florida, USA, August -7, 007 Image Classification Using Wavelet Coefficients in Low-pass Bands Weibao Zou, Member, IEEE, and Yan
[10] Industrial DataMatrix barcodes recognition with a random tilt and rotating the camera
![[10] Industrial DataMatrix barcodes recognition with a random tilt and rotating the camera](/thumbs/84/90637441.jpg "[10] Industrial DataMatrix barcodes recognition with a random tilt and rotating the camera") [10] Industrial DataMatrix barcodes recognition with a random tilt and rotating the camera Image processing, pattern recognition 865 Kruchinin A.Yu. Orenburg State University IntBuSoft Ltd Abstract The
[10] Industrial DataMatrix barcodes recognition with a random tilt and rotating the camera Image processing, pattern recognition 865 Kruchinin A.Yu. Orenburg State University IntBuSoft Ltd Abstract The