Artificial Neural Networks Unsupervised learning: SOM
|
|
|
- Dylan Matthew Ford
- 5 years ago
- Views:
Transcription


1 Artificial Neural Networks Unsupervised learning: SOM Jan Drchal Computational Intelligence Group Department of Computer Science and Engineering Faculty of Electrical Engineering Czech Technical University in Prague
2 Outline Competitive learning. Self-organization, Vector Quantization, Cluster Analysis. SOM architecture and learning. SOM visualizations. SOM evaluation.
3 Competitive Learning Nature inspired. No arbiter needed unsupervised learning. Individuals (units, neurons) learn from examples. System self-organizes. Now we are going to apply this to cluster analysis.

4 SOM SOM = Self Organizing Maps. Prof. Teuvo Kohonen, Finsko, TU Helsinki, 1981, several thousands scientific publications since...

5 SOM Kohonen's Application Original application: phonetic typewriter : Finish language.
6 SOM Inspiration Brain represents the world in a topological way. Exterior spatial relations are mapped to similar spatial relations in the brain: i.e. signals from hand and arm are processed nearby.
. Neuroscience: Exploring The Brain. Pg.")
7 SOM Inspiration II Bear, Connors & Paradiso (2001). Neuroscience: Exploring The Brain. Pg. 474.
8 SOM Overview Single layer, feed-forward. Unsupervised, self-organization. No output, instead Winner-takes-all. Used for cluster analysis. Performs vector quantization. Not a classifier! But can be simply transformed into one by adding another layer.
9 What is Self-Organization? Self-organization of a system is a process which leads to a rise of a quality of its inner configuration while not using any information from outside. Self-organization clears up relationships between parts of a system.
10 What is Cluster Analysis Assignment of a set of observations into subsets (clusters). A measure of similarity is defined: observations in the same cluster are similar, observations between two clusters are dissimilar. Classic cluster analysis works with Rn input space observations. See:
11 What is Vector Quantization The goal of Vector Quantization is to approximate the probability density p(x) of real input vectors x Rn distribution using finite number of representatives wi Rn. The representative vectors tend to drift there where the data is dense, while there tends to be only a few of them where data is sparsely located. In this manner, the net tends to approximate the probability density of the input data. Hollmen '96
12 Vector Quantization Example Blue points are the input vectors. Red points are the representatives.
13 VQ by SOM 1D SOM of 4 neurons
14 Why the Different Result? SOM works with neighbourhood. Representatives influence each other. They form elastic : chain for 1D SOM, mesh for higher dimensions. g(x) x

15 SOM Architecture 1/3 Representative Typically: 2D mesh of representatives (neurons)
16 SOM Architecture 2/3 Arrangements: 1D linear quite often, 2D mesh most frequently, 3D (and higher dimensions) exceptionally problematic visualization. The arrangement defines neighbourhood of a neuron. Kohonen suggests: rectangular SOM!
17 SOM Architecture 3/3 Input vector x has a dimension N. Each neuron has a weight vector w of the same dimension N. Weight vectors of all neurons are compared to x. The most similar is chosen BMU (Best Matching Unit). BMU becomes a representative of vector x. neuron i Kohonen layer wi winning neuron: BMU
18 SOM Neuron 1/2 Evaluates the similarity of input vector x and weight vector wi. Similarity: i.e. Euclidean The most similar neuron to a input vector is chosen (BMU): j =argmin { x w i }, * i SOM neuron is a representative of a cluster.
19 SOM Neuron 2/2 Note, we don't have to use Euclidean distance. We can use directional similarity expressed by the dot product: * T j =arg max { x ( t ) w i ( t ) }. i Why max here? Note: A.B A B cos =
20 Learning SOM Initialization (random weights). Apply input pattern x = (x1, x2, xn). Compute distances. Select BMU neuron j. Adjust weights for all neurons i: w i t 1 =w i t ij t [ x t w i t ] Continue with next pattern. Neighbourhood function
![Example [ ] W = 0.27 [ 0.81 ] X = 0.52 0.12 1 [ ] W 2= 0.](/docs-images/91/104751424/images/21-1.jpg "42 0.70 [ ] W 3= 0.43 0.")
21 Example [ ] W = 0.27 [ 0.81 ] X = [ ] W 2= [ ] W 3= The third vector is the winner (BMU).
22 Example contd. Let's move the neuron closer to the input pattern: w ij t 1 =w ij t t [ xi t w ij t ] Δw 13=η( t )( x 1 w13 )=0. 1( )= Δw 23=η( t )( x 2 w23 )=0. 1( )= [ ][ ][ ] W 3 ( t +1)=W 3 ( t )+ ΔW 3 ( t )= = We adjusted only BMU weights. Here, the winner takes all.

23 What About Updating Also Neurons in the Neighbourhood?
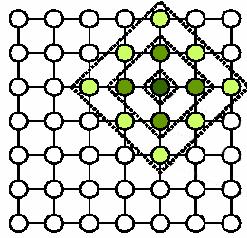
24 Neighbourhood for SOM Timo Honkela (Description of Kohonen's Self-Organizing Map)
25 Common Neighbourhoods square hexagonal T. Kohonen: Self Organizing Maps
26 Learning SOM II The neighbourhood plays important role when learning SOM: topological arrangement, neighbour distances. Neighbourhood changes in time: its diameter decreases (to zero). The change is realised by neighbourhood function η(t).
27 Gaussian Neighbourhood Neighbourhood function for neuron i. ( 2 r j r i ηij ( t ) =α ( t ). exp 2 2σ (t ) * * ) Where j* is the BMU, r the position of neuron in map, and function α(t): learning rate. The exp expression represents neighbourhood shape.
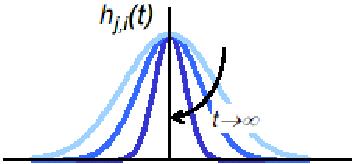
28 Gaussian Neighbourhood Distance related learning
29 Neighbourhood Related Functions Hollmen '96, MSc.

30 Learning Process During the learning the BMU (and its neighbours) is adapted to get closer to the input pattern which have caused its activation. Neurons are moving towards the input pattern. What influences the magnitude of the approach?


31 SOM Applications To visualize data. To cover the input space by representatives. 1D 2D

32 Or Slide by Johan Everts
33 Example: Learning Dot-Product SOM
34 More Examples Covering a triangle by 1D SOM. T. Kohonen: Self Organizing Maps

35 More Examples contd. Covering a square by 2D SOM. T. Kohonen: Self Organizing Maps

36 Possible Problem: Knots This problem is not likely to be corrected by further learning if the plasticity is low: Rojas: Neural Networks - A Systematic Introduction
37 What is the Cause? There are many: Random initialization of weights we are unable the change bad initial orientation of vectors. Choice of a neighbourhood function. Scheduling of neighbourhood modification in time. Input data of course...
38 What Can Help? Same weights for all neurons initially each neuron has a same chance to represent a pattern. Add random noise to input patterns at start. Lateral inhibition...
39 Lateral Inhibition When choosing the BMU we do not pick isolated winner. The choice does not depend on an activation of a single neuron but also on activity of its neighbours...
40 Lateral Inhibition II I j =I I =d j k g jk I k l j f j neighbours j-th neuron response neighbourhood response local response lateral inhibition interaction distance from input vector
41 Lateral Inhibition Functions g(x) g(x) biological 1 - x 0 x simplified
42 SOM Visualization How to visualize representatives? Weight dimension = input vector dimension. How to show in 2D? U-matrix, P-matrix, PCA (linear projection), Sammon's projection (non-linear).
43 U-matrix (UMAT) Visualizes distances between neurons: Dark coloring between neurons large distance. Light close in input space. Dark gaps separate clusters. Neuron colour reflects the distance of its weight vector to all other weight vectors, again: dark large distance, light close distance.
44 U-matrix Example data neurons distance between adjacent neurons
45 P-matrix (Pareto Density Estimation) Shows the number of input space vectors which belong to a sphere centered in the neuron's weight vector. Visualizes data density. Neurons with high value belong to dense areas of input space. Neurons with low value are lonesome. Valleys separate clusters ( plateaus ).

46 Feature Plots clustering UMAP feature plot shows a value of a single component (feature) of a weight vector can be used to check if two components correlate
47 Drawbacks of UMAT, PMAT Only distances between neighbours. New learning on the same data may give different results: (i.e. 90 degrees rotation) Not intuitive. How can we show high-dimensional data in 2D(3D) keeping notion of original distances?
48 PCA Principal Component Analysis. Linear transformation to a new coordinate system such that: 1st coordinate (principal component) greatest variance by any projection of the data 2nd coordinate 2nd greatest variance etc. Dimension reduction use only N first coordinates, throw the rest away...
49 Principal Components Example 2nd PC 1st PC new coordinate system original coordinate system
50 Sammon's Projection Non-linear reduction of higher-dimensional space to lower-dimensional space. d (i, j ) Tries to preserve distances. distance in high dim. space energy function low for similar distances in both spaces. E = N 1 N 1 1 N N d (i, j ) i=1 j=i+1 ( d (i, j ) d distance in low dim. space (i, j )) d (i, j ) * x2 x1 2 y2 3D to 2D d * (i, j ) i=1 j=i+1 x3 Energy function is a subject to minimization (originally using gradient descent). y1
51 Standard SOM Visualizations UMAT Sammon neuron weights projected to 2D, neighbours connected

52 SOM Applications Detection of similar images.


53 ReefSOM SOM visualization for non-experts. UMAT + glyphs.
54 SOM Evaluation VQ vector quantization, more input vectors mapped into a single neuron quantization error or distortion. Compression of an input space dimension. Preserves data topology neighbour vectors (from an input space) are mapped to neighbour neurons (in the mesh) topographic error.
55 SOM Quantization Error & Distortion Quantization Error average distance between input vector and its BMU (computed over all input vectors). precision of mapping. Distortion count with neighbours: E= i N j I i, bmu j w i x j 2 neurons input vectors Energy function again!
56 Topographic Error of SOM # of input vectors, for which the winner (BMU) and the second best neuron are not adjacent in the mesh.
57 Next Lecture Universal approximation. Kolmogorov's theorem. RBF networks. GMDH networks.
Function approximation using RBF network. 10 basis functions and 25 data points.
 1 Function approximation using RBF network F (x j ) = m 1 w i ϕ( x j t i ) i=1 j = 1... N, m 1 = 10, N = 25 10 basis functions and 25 data points. Basis function centers are plotted with circles and data
Self-Organizing Map. presentation by Andreas Töscher. 19. May 2008
 19. May 2008 1 Introduction 2 3 4 5 6 (SOM) aka Kohonen Network introduced by Teuvo Kohonen implements a discrete nonlinear mapping unsupervised learning Structure of a SOM Learning Rule Introduction
Figure (5) Kohonen Self-Organized Map
 Kohonen Self-Organized Map") 2- KOHONEN SELF-ORGANIZING MAPS (SOM) - The self-organizing neural networks assume a topological structure among the cluster units. - There are m cluster units, arranged in a one- or two-dimensional array;
2- KOHONEN SELF-ORGANIZING MAPS (SOM) - The self-organizing neural networks assume a topological structure among the cluster units. - There are m cluster units, arranged in a one- or two-dimensional array;
Chapter 7: Competitive learning, clustering, and self-organizing maps
 Chapter 7: Competitive learning, clustering, and self-organizing maps António R. C. Paiva EEL 6814 Spring 2008 Outline Competitive learning Clustering Self-Organizing Maps What is competition in neural
Slide07 Haykin Chapter 9: Self-Organizing Maps
 Slide07 Haykin Chapter 9: Self-Organizing Maps CPSC 636-600 Instructor: Yoonsuck Choe Spring 2012 Introduction Self-organizing maps (SOM) is based on competitive learning, where output neurons compete
Unsupervised Learning
 Networks for Pattern Recognition, 2014 Networks for Single Linkage K-Means Soft DBSCAN PCA Networks for Kohonen Maps Linear Vector Quantization Networks for Problems/Approaches in Machine Learning Supervised
Supervised vs.unsupervised Learning
 Supervised vs.unsupervised Learning In supervised learning we train algorithms with predefined concepts and functions based on labeled data D = { ( x, y ) x X, y {yes,no}. In unsupervised learning we are
5.6 Self-organizing maps (SOM) [Book, Sect. 10.3]
![5.6 Self-organizing maps (SOM) [Book, Sect. 10.3]](/thumbs/88/116484380.jpg "5.6 Self-organizing maps (SOM) [Book, Sect. 10.3]") Ch.5 Classification and Clustering 5.6 Self-organizing maps (SOM) [Book, Sect. 10.3] The self-organizing map (SOM) method, introduced by Kohonen (1982, 2001), approximates a dataset in multidimensional
Ch.5 Classification and Clustering 5.6 Self-organizing maps (SOM) [Book, Sect. 10.3] The self-organizing map (SOM) method, introduced by Kohonen (1982, 2001), approximates a dataset in multidimensional
Unsupervised Learning
 Unsupervised Learning Unsupervised learning Until now, we have assumed our training samples are labeled by their category membership. Methods that use labeled samples are said to be supervised. However,
Unsupervised Learning
 Unsupervised Learning Learning without a teacher No targets for the outputs Networks which discover patterns, correlations, etc. in the input data This is a self organisation Self organising networks An
Neuro-Fuzzy Comp. Ch. 8 May 12, 2005
 Neuro-Fuzzy Comp. Ch. 8 May, 8 Self-Organizing Feature Maps Self-Organizing Feature Maps (SOFM or SOM) also known as Kohonen maps or topographic maps were first introduced by von der Malsburg (97) and
Artificial Neural Networks MLP, RBF & GMDH
 Artificial Neural Networks MLP, RBF & GMDH Jan Drchal drchajan@fel.cvut.cz Computational Intelligence Group Department of Computer Science and Engineering Faculty of Electrical Engineering Czech Technical
Exploratory Data Analysis using Self-Organizing Maps. Madhumanti Ray
 Exploratory Data Analysis using Self-Organizing Maps Madhumanti Ray Content Introduction Data Analysis methods Self-Organizing Maps Conclusion Visualization of high-dimensional data items Exploratory data
Machine Learning : Clustering, Self-Organizing Maps
 Machine Learning Clustering, Self-Organizing Maps 12/12/2013 Machine Learning : Clustering, Self-Organizing Maps Clustering The task: partition a set of objects into meaningful subsets (clusters). The
COMBINED METHOD TO VISUALISE AND REDUCE DIMENSIONALITY OF THE FINANCIAL DATA SETS
 COMBINED METHOD TO VISUALISE AND REDUCE DIMENSIONALITY OF THE FINANCIAL DATA SETS Toomas Kirt Supervisor: Leo Võhandu Tallinn Technical University Toomas.Kirt@mail.ee Abstract: Key words: For the visualisation
Introduction to Machine Learning
 Department of Computer Science, University of Helsinki Autumn 2009, second term Session 8, November 27 th, 2009 1 2 3 Multiplicative Updates for L1-Regularized Linear and Logistic Last time I gave you
DESIGN OF KOHONEN SELF-ORGANIZING MAP WITH REDUCED STRUCTURE
 DESIGN OF KOHONEN SELF-ORGANIZING MAP WITH REDUCED STRUCTURE S. Kajan, M. Lajtman Institute of Control and Industrial Informatics, Faculty of Electrical Engineering and Information Technology, Slovak University
What is a receptive field? Why a sensory neuron has such particular RF How a RF was developed?
 What is a receptive field? Why a sensory neuron has such particular RF How a RF was developed? x 1 x 2 x 3 y f w 1 w 2 w 3 T x y = f (wx i i T ) i y x 1 x 2 x 3 = = E (y y) (y f( wx T)) 2 2 o o i i i
Methods for Intelligent Systems
 Methods for Intelligent Systems Lecture Notes on Clustering (II) Davide Eynard eynard@elet.polimi.it Department of Electronics and Information Politecnico di Milano Davide Eynard - Lecture Notes on Clustering
11/14/2010 Intelligent Systems and Soft Computing 1
 Lecture 8 Artificial neural networks: Unsupervised learning Introduction Hebbian learning Generalised Hebbian learning algorithm Competitive learning Self-organising computational map: Kohonen network
Nonlinear projections. Motivation. High-dimensional. data are. Perceptron) ) or RBFN. Multi-Layer. Example: : MLP (Multi(
 ) or RBFN. Multi-Layer. Example: : MLP (Multi(") Nonlinear projections Université catholique de Louvain (Belgium) Machine Learning Group http://www.dice.ucl ucl.ac.be/.ac.be/mlg/ 1 Motivation High-dimensional data are difficult to represent difficult
Nonlinear projections Université catholique de Louvain (Belgium) Machine Learning Group http://www.dice.ucl ucl.ac.be/.ac.be/mlg/ 1 Motivation High-dimensional data are difficult to represent difficult
PATTERN RECOGNITION USING NEURAL NETWORKS
 PATTERN RECOGNITION USING NEURAL NETWORKS Santaji Ghorpade 1, Jayshree Ghorpade 2 and Shamla Mantri 3 1 Department of Information Technology Engineering, Pune University, India santaji_11jan@yahoo.co.in,
Advanced visualization techniques for Self-Organizing Maps with graph-based methods
 Advanced visualization techniques for Self-Organizing Maps with graph-based methods Georg Pölzlbauer 1, Andreas Rauber 1, and Michael Dittenbach 2 1 Department of Software Technology Vienna University
Review: Final Exam CPSC Artificial Intelligence Michael M. Richter
 Review: Final Exam Model for a Learning Step Learner initially Environm ent Teacher Compare s pe c ia l Information Control Correct Learning criteria Feedback changed Learner after Learning Learning by
Autoorganised Structures for Extraction of Perceptual Primitives
 Autoorganised Structures for Extraction of Perceptual Primitives M. Penas, M.G.Penedo Dept. Computer Science Univ. of A Coruña, SPAIN M.J.Carreira Dept. Electronics and Computer Science Univ. of Santiago
Two-step Modified SOM for Parallel Calculation
 Two-step Modified SOM for Parallel Calculation Two-step Modified SOM for Parallel Calculation Petr Gajdoš and Pavel Moravec Petr Gajdoš and Pavel Moravec Department of Computer Science, FEECS, VŠB Technical
CSE 6242 A / CS 4803 DVA. Feb 12, Dimension Reduction. Guest Lecturer: Jaegul Choo
 CSE 6242 A / CS 4803 DVA Feb 12, 2013 Dimension Reduction Guest Lecturer: Jaegul Choo CSE 6242 A / CS 4803 DVA Feb 12, 2013 Dimension Reduction Guest Lecturer: Jaegul Choo Data is Too Big To Do Something..
Self-Organizing Maps for cyclic and unbounded graphs
 Self-Organizing Maps for cyclic and unbounded graphs M. Hagenbuchner 1, A. Sperduti 2, A.C. Tsoi 3 1- University of Wollongong, Wollongong, Australia. 2- University of Padova, Padova, Italy. 3- Hong Kong
Artificial neural networks are the paradigm of connectionist systems (connectionism vs. symbolism)
") Artificial Neural Networks Analogy to biological neural systems, the most robust learning systems we know. Attempt to: Understand natural biological systems through computational modeling. Model intelligent
Artificial Neural Networks Analogy to biological neural systems, the most robust learning systems we know. Attempt to: Understand natural biological systems through computational modeling. Model intelligent
Cluster analysis of 3D seismic data for oil and gas exploration
 Data Mining VII: Data, Text and Web Mining and their Business Applications 63 Cluster analysis of 3D seismic data for oil and gas exploration D. R. S. Moraes, R. P. Espíndola, A. G. Evsukoff & N. F. F.
Growing Neural Gas A Parallel Approach
 Growing Neural Gas A Parallel Approach Lukáš Vojáček 1 and JiříDvorský 2 1 IT4Innovations Centre of Excellence Ostrava, Czech Republic lukas.vojacek@vsb.cz 2 Department of Computer Science, VŠB Technical
Neural Networks. CE-725: Statistical Pattern Recognition Sharif University of Technology Spring Soleymani
 Neural Networks CE-725: Statistical Pattern Recognition Sharif University of Technology Spring 2013 Soleymani Outline Biological and artificial neural networks Feed-forward neural networks Single layer
Seismic regionalization based on an artificial neural network
 Seismic regionalization based on an artificial neural network *Jaime García-Pérez 1) and René Riaño 2) 1), 2) Instituto de Ingeniería, UNAM, CU, Coyoacán, México D.F., 014510, Mexico 1) jgap@pumas.ii.unam.mx
Inductive Modelling of Temporal Sequences by Means of Self-organization
 Inductive Modelling of Temporal Sequences by Means of Self-organization Jan Koutnik 1 1 Computational Intelligence Group, Dept. of Computer Science and Engineering, Faculty of Electrical Engineering, Czech
arxiv: v1 [physics.data-an] 27 Sep 2007
![arxiv: v1 [physics.data-an] 27 Sep 2007](/thumbs/95/126120556.jpg "arxiv: v1 [physics.data-an] 27 Sep 2007") Classification of Interest Rate Curves Using Self-Organising Maps arxiv:0709.4401v1 [physics.data-an] 27 Sep 2007 M.Kanevski a,, M.Maignan b, V.Timonin a,1, A.Pozdnoukhov a,1 a Institute of Geomatics and
Classification of Interest Rate Curves Using Self-Organising Maps arxiv:0709.4401v1 [physics.data-an] 27 Sep 2007 M.Kanevski a,, M.Maignan b, V.Timonin a,1, A.Pozdnoukhov a,1 a Institute of Geomatics and
CHAPTER 6 COUNTER PROPAGATION NEURAL NETWORK FOR IMAGE RESTORATION
 135 CHAPTER 6 COUNTER PROPAGATION NEURAL NETWORK FOR IMAGE RESTORATION 6.1 INTRODUCTION Neural networks have high fault tolerance and potential for adaptive training. A Full Counter Propagation Neural
Segmentation: Clustering, Graph Cut and EM
 Segmentation: Clustering, Graph Cut and EM Ying Wu Electrical Engineering and Computer Science Northwestern University, Evanston, IL 60208 yingwu@northwestern.edu http://www.eecs.northwestern.edu/~yingwu
Road Sign Visualization with Principal Component Analysis and Emergent Self-Organizing Map
 Road Sign Visualization with Principal Component Analysis and Emergent Self-Organizing Map H6429: Computational Intelligence, Method and Applications Assignment One report Written By Nguwi Yok Yen (nguw0001@ntu.edu.sg)
Reducing topological defects in self-organizing maps using multiple scale neighborhood functions
 Reducing topological defects in self-organizing maps using multiple scale neighborhood functions Kazushi Murakoshi,YuichiSato Department of Knowledge-based Information Engineering, Toyohashi University
Cluster Analysis and Visualization. Workshop on Statistics and Machine Learning 2004/2/6
 Cluster Analysis and Visualization Workshop on Statistics and Machine Learning 2004/2/6 Outlines Introduction Stages in Clustering Clustering Analysis and Visualization One/two-dimensional Data Histogram,
A Population Based Convergence Criterion for Self-Organizing Maps
 A Population Based Convergence Criterion for Self-Organizing Maps Lutz Hamel and Benjamin Ott Department of Computer Science and Statistics, University of Rhode Island, Kingston, RI 02881, USA. Email:
Clustering with Reinforcement Learning
 Clustering with Reinforcement Learning Wesam Barbakh and Colin Fyfe, The University of Paisley, Scotland. email:wesam.barbakh,colin.fyfe@paisley.ac.uk Abstract We show how a previously derived method of
Unsupervised Learning
 Unsupervised Learning Chapter 14: The Elements of Statistical Learning Presented for 540 by Len Tanaka Objectives Introduction Techniques: Association Rules Cluster Analysis Self-Organizing Maps Projective
CHAPTER FOUR NEURAL NETWORK SELF- ORGANIZING MAP
 96 CHAPTER FOUR NEURAL NETWORK SELF- ORGANIZING MAP 97 4.1 INTRODUCTION Neural networks have been successfully applied by many authors in solving pattern recognition problems. Unsupervised classification
Lecture Topic Projects
 Lecture Topic Projects 1 Intro, schedule, and logistics 2 Applications of visual analytics, basic tasks, data types 3 Introduction to D3, basic vis techniques for non-spatial data Project #1 out 4 Data
Machine Learning Methods in Visualisation for Big Data 2018
 Machine Learning Methods in Visualisation for Big Data 2018 Daniel Archambault1 Ian Nabney2 Jaakko Peltonen3 1 Swansea University 2 University of Bristol 3 University of Tampere, Aalto University Evaluating
ECG782: Multidimensional Digital Signal Processing
 ECG782: Multidimensional Digital Signal Processing Object Recognition http://www.ee.unlv.edu/~b1morris/ecg782/ 2 Outline Knowledge Representation Statistical Pattern Recognition Neural Networks Boosting
The Traveling Salesman
 Neural Network Approach To Solving The Traveling Salesman Problem The Traveling Salesman The shortest route for a salesman to visit every city, without stopping at the same city twice. 1 Random Methods
Data Warehousing and Machine Learning
 Data Warehousing and Machine Learning Preprocessing Thomas D. Nielsen Aalborg University Department of Computer Science Spring 2008 DWML Spring 2008 1 / 35 Preprocessing Before you can start on the actual
Instance-based Learning
 Instance-based Learning Machine Learning 10701/15781 Carlos Guestrin Carnegie Mellon University February 19 th, 2007 2005-2007 Carlos Guestrin 1 Why not just use Linear Regression? 2005-2007 Carlos Guestrin
Neural Networks for unsupervised learning From Principal Components Analysis to Autoencoders to semantic hashing
 Neural Networks for unsupervised learning From Principal Components Analysis to Autoencoders to semantic hashing feature 3 PC 3 Beate Sick Many slides are taken form Hinton s great lecture on NN: https://www.coursera.org/course/neuralnets
CPSC 340: Machine Learning and Data Mining. Multi-Dimensional Scaling Fall 2017
 CPSC 340: Machine Learning and Data Mining Multi-Dimensional Scaling Fall 2017 Assignment 4: Admin 1 late day for tonight, 2 late days for Wednesday. Assignment 5: Due Monday of next week. Final: Details
Preprocessing DWML, /33
 Preprocessing DWML, 2007 1/33 Preprocessing Before you can start on the actual data mining, the data may require some preprocessing: Attributes may be redundant. Values may be missing. The data contains
A Topography-Preserving Latent Variable Model with Learning Metrics
 A Topography-Preserving Latent Variable Model with Learning Metrics Samuel Kaski and Janne Sinkkonen Helsinki University of Technology Neural Networks Research Centre P.O. Box 5400, FIN-02015 HUT, Finland
Machine Learning Reliability Techniques for Composite Materials in Structural Applications.
 Machine Learning Reliability Techniques for Composite Materials in Structural Applications. Roberto d Ippolito, Keiichi Ito, Silvia Poles, Arnaud Froidmont Noesis Solutions Optimus by Noesis Solutions
Performance Degradation Assessment and Fault Diagnosis of Bearing Based on EMD and PCA-SOM
 Performance Degradation Assessment and Fault Diagnosis of Bearing Based on EMD and PCA-SOM Lu Chen and Yuan Hang PERFORMANCE DEGRADATION ASSESSMENT AND FAULT DIAGNOSIS OF BEARING BASED ON EMD AND PCA-SOM.
/00/$10.00 (C) 2000 IEEE
 2000 IEEE") A SOM based cluster visualization and its application for false coloring Johan Himberg Helsinki University of Technology Laboratory of Computer and Information Science P.O. Box 54, FIN-215 HUT, Finland
A SOM based cluster visualization and its application for false coloring Johan Himberg Helsinki University of Technology Laboratory of Computer and Information Science P.O. Box 54, FIN-215 HUT, Finland
Radial Basis Function Networks: Algorithms
 Radial Basis Function Networks: Algorithms Neural Computation : Lecture 14 John A. Bullinaria, 2015 1. The RBF Mapping 2. The RBF Network Architecture 3. Computational Power of RBF Networks 4. Training
Application of genetic algorithms and Kohonen networks to cluster analysis
 Application of genetic algorithms and Kohonen networks to cluster analysis Marian B. Gorza lczany and Filip Rudziński Department of Electrical and Computer Engineering Kielce University of Technology Al.
Initialization of Self-Organizing Maps: Principal Components Versus Random Initialization. A Case Study
 Initialization of Self-Organizing Maps: Principal Components Versus Random Initialization. A Case Study Ayodeji A. Akinduko 1 and Evgeny M. Mirkes 2 1 University of Leicester, UK, aaa78@le.ac.uk 2 Siberian
A Dendrogram. Bioinformatics (Lec 17)
") A Dendrogram 3/15/05 1 Hierarchical Clustering [Johnson, SC, 1967] Given n points in R d, compute the distance between every pair of points While (not done) Pick closest pair of points s i and s j and
A Dendrogram 3/15/05 1 Hierarchical Clustering [Johnson, SC, 1967] Given n points in R d, compute the distance between every pair of points While (not done) Pick closest pair of points s i and s j and
Affine Arithmetic Self Organizing Map
 Affine Arithmetic Self Organizing Map Tony Bazzi Department of Electrical and Systems Engineering Oakland University Rochester, MI 48309, USA Email: tbazzi [AT] oakland.edu Jasser Jasser Department of
1 Training/Validation/Testing
 CPSC 340 Final (Fall 2015) Name: Student Number: Please enter your information above, turn off cellphones, space yourselves out throughout the room, and wait until the official start of the exam to begin.
Markov chain Monte Carlo methods
 Markov chain Monte Carlo methods (supplementary material) see also the applet http://www.lbreyer.com/classic.html February 9 6 Independent Hastings Metropolis Sampler Outline Independent Hastings Metropolis
Pattern Recognition. Kjell Elenius. Speech, Music and Hearing KTH. March 29, 2007 Speech recognition
 Pattern Recognition Kjell Elenius Speech, Music and Hearing KTH March 29, 2007 Speech recognition 2007 1 Ch 4. Pattern Recognition 1(3) Bayes Decision Theory Minimum-Error-Rate Decision Rules Discriminant
Richard S. Zemel 1 Georey E. Hinton North Torrey Pines Rd. Toronto, ONT M5S 1A4. Abstract
 Developing Population Codes By Minimizing Description Length Richard S Zemel 1 Georey E Hinton University oftoronto & Computer Science Department The Salk Institute, CNL University oftoronto 0 North Torrey
CPSC 340: Machine Learning and Data Mining. Principal Component Analysis Fall 2016
 CPSC 340: Machine Learning and Data Mining Principal Component Analysis Fall 2016 A2/Midterm: Admin Grades/solutions will be posted after class. Assignment 4: Posted, due November 14. Extra office hours:
Multiresponse Sparse Regression with Application to Multidimensional Scaling
 Multiresponse Sparse Regression with Application to Multidimensional Scaling Timo Similä and Jarkko Tikka Helsinki University of Technology, Laboratory of Computer and Information Science P.O. Box 54,
Extract an Essential Skeleton of a Character as a Graph from a Character Image
 Extract an Essential Skeleton of a Character as a Graph from a Character Image Kazuhisa Fujita University of Electro-Communications 1-5-1 Chofugaoka, Chofu, Tokyo, 182-8585 Japan k-z@nerve.pc.uec.ac.jp
Introduction to Neural Networks
 Introduction to Neural Networks What are connectionist neural networks? Connectionism refers to a computer modeling approach to computation that is loosely based upon the architecture of the brain Many
A novel firing rule for training Kohonen selforganising
 A novel firing rule for training Kohonen selforganising maps D. T. Pham & A. B. Chan Manufacturing Engineering Centre, School of Engineering, University of Wales Cardiff, P.O. Box 688, Queen's Buildings,
Fuzzy-Kernel Learning Vector Quantization
 Fuzzy-Kernel Learning Vector Quantization Daoqiang Zhang 1, Songcan Chen 1 and Zhi-Hua Zhou 2 1 Department of Computer Science and Engineering Nanjing University of Aeronautics and Astronautics Nanjing
6. NEURAL NETWORK BASED PATH PLANNING ALGORITHM 6.1 INTRODUCTION
 6 NEURAL NETWORK BASED PATH PLANNING ALGORITHM 61 INTRODUCTION In previous chapters path planning algorithms such as trigonometry based path planning algorithm and direction based path planning algorithm
CPSC 340: Machine Learning and Data Mining. Principal Component Analysis Fall 2017
 CPSC 340: Machine Learning and Data Mining Principal Component Analysis Fall 2017 Assignment 3: 2 late days to hand in tonight. Admin Assignment 4: Due Friday of next week. Last Time: MAP Estimation MAP
Machine Learning for OR & FE
 Machine Learning for OR & FE Unsupervised Learning: Clustering Martin Haugh Department of Industrial Engineering and Operations Research Columbia University Email: martin.b.haugh@gmail.com (Some material
ESANN'2006 proceedings - European Symposium on Artificial Neural Networks Bruges (Belgium), April 2006, d-side publi., ISBN
, April 2006, d-side publi., ISBN") ESANN'26 proceedings - European Symposium on Artificial Neural Networks Bruges (Belgium), 26-28 April 26, d-side publi., ISBN 2-9337-6-4. Visualizing the trustworthiness of a projection Michaël Aupetit
ESANN'26 proceedings - European Symposium on Artificial Neural Networks Bruges (Belgium), 26-28 April 26, d-side publi., ISBN 2-9337-6-4. Visualizing the trustworthiness of a projection Michaël Aupetit
DS504/CS586: Big Data Analytics Big Data Clustering II
 Welcome to DS504/CS586: Big Data Analytics Big Data Clustering II Prof. Yanhua Li Time: 6pm 8:50pm Thu Location: AK 232 Fall 2016 More Discussions, Limitations v Center based clustering K-means BFR algorithm
Controlling the spread of dynamic self-organising maps
 Neural Comput & Applic (2004) 13: 168 174 DOI 10.1007/s00521-004-0419-y ORIGINAL ARTICLE L. D. Alahakoon Controlling the spread of dynamic self-organising maps Received: 7 April 2004 / Accepted: 20 April
Unsupervised learning
 Unsupervised learning Enrique Muñoz Ballester Dipartimento di Informatica via Bramante 65, 26013 Crema (CR), Italy enrique.munoz@unimi.it Enrique Muñoz Ballester 2017 1 Download slides data and scripts:
Free Projection SOM: A New Method For SOM-Based Cluster Visualization
 Free Projection SOM: A New Method For SOM-Based Cluster Visualization 1 ABDEL-BADEEH M. SALEM 1, EMAD MONIER, KHALED NAGATY Computer Science Department Ain Shams University Faculty of Computer & Information
Neuro-Fuzzy Computing
 CSE53 Neuro-Fuzzy Computing Tutorial/Assignment 3: Unsupervised Learning About this tutorial The objective of this tutorial is to study unsupervised learning, in particular: (Generalized) Hebbian learning.
Markov Random Fields and Gibbs Sampling for Image Denoising
 Markov Random Fields and Gibbs Sampling for Image Denoising Chang Yue Electrical Engineering Stanford University changyue@stanfoed.edu Abstract This project applies Gibbs Sampling based on different Markov
Finding Clusters 1 / 60
 Finding Clusters Types of Clustering Approaches: Linkage Based, e.g. Hierarchical Clustering Clustering by Partitioning, e.g. k-means Density Based Clustering, e.g. DBScan Grid Based Clustering 1 / 60
Online Learning for Object Recognition with a Hierarchical Visual Cortex Model
 Online Learning for Object Recognition with a Hierarchical Visual Cortex Model Stephan Kirstein, Heiko Wersing, and Edgar Körner Honda Research Institute Europe GmbH Carl Legien Str. 30 63073 Offenbach
Artificial Neural Networks
 Artificial Neural Networks If you try and take a cat apart to see how it works, the first thing you have on your hands is a non-working cat. Life is a level of complexity that almost lies outside our vision.
DS504/CS586: Big Data Analytics Big Data Clustering II
 Welcome to DS504/CS586: Big Data Analytics Big Data Clustering II Prof. Yanhua Li Time: 6pm 8:50pm Thu Location: KH 116 Fall 2017 Updates: v Progress Presentation: Week 15: 11/30 v Next Week Office hours
2D image segmentation based on spatial coherence
 2D image segmentation based on spatial coherence Václav Hlaváč Czech Technical University in Prague Center for Machine Perception (bridging groups of the) Czech Institute of Informatics, Robotics and Cybernetics
SGN (4 cr) Chapter 11
 Chapter 11") SGN-41006 (4 cr) Chapter 11 Clustering Jussi Tohka & Jari Niemi Department of Signal Processing Tampere University of Technology February 25, 2014 J. Tohka & J. Niemi (TUT-SGN) SGN-41006 (4 cr) Chapter
SGN-41006 (4 cr) Chapter 11 Clustering Jussi Tohka & Jari Niemi Department of Signal Processing Tampere University of Technology February 25, 2014 J. Tohka & J. Niemi (TUT-SGN) SGN-41006 (4 cr) Chapter
SOM+EOF for Finding Missing Values
 SOM+EOF for Finding Missing Values Antti Sorjamaa 1, Paul Merlin 2, Bertrand Maillet 2 and Amaury Lendasse 1 1- Helsinki University of Technology - CIS P.O. Box 5400, 02015 HUT - Finland 2- Variances and
Unsupervised Learning
 Unsupervised Learning Learning without Class Labels (or correct outputs) Density Estimation Learn P(X) given training data for X Clustering Partition data into clusters Dimensionality Reduction Discover
Tight Clusters and Smooth Manifolds with the Harmonic Topographic Map.
 Proceedings of the th WSEAS Int. Conf. on SIMULATION, MODELING AND OPTIMIZATION, Corfu, Greece, August -9, (pp8-) Tight Clusters and Smooth Manifolds with the Harmonic Topographic Map. MARIAN PEÑA AND
CS325 Artificial Intelligence Ch. 20 Unsupervised Machine Learning
 CS325 Artificial Intelligence Cengiz Spring 2013 Unsupervised Learning Missing teacher No labels, y Just input data, x What can you learn with it? Unsupervised Learning Missing teacher No labels, y Just
Learning a Manifold as an Atlas Supplementary Material
 Learning a Manifold as an Atlas Supplementary Material Nikolaos Pitelis Chris Russell School of EECS, Queen Mary, University of London [nikolaos.pitelis,chrisr,lourdes]@eecs.qmul.ac.uk Lourdes Agapito
Bioinformatics - Lecture 07
 Bioinformatics - Lecture 07 Bioinformatics Clusters and networks Martin Saturka http://www.bioplexity.org/lectures/ EBI version 0.4 Creative Commons Attribution-Share Alike 2.5 License Learning on profiles
Self-Organizing Sparse Codes
 Self-Organizing Sparse Codes Yangqing Jia Sergey Karayev 2010-12-16 Abstract Sparse coding as applied to natural image patches learns Gabor-like components that resemble those found in the lower areas
Cluster Analysis. Mu-Chun Su. Department of Computer Science and Information Engineering National Central University 2003/3/11 1
 Cluster Analysis Mu-Chun Su Department of Computer Science and Information Engineering National Central University 2003/3/11 1 Introduction Cluster analysis is the formal study of algorithms and methods
CLASSIFICATION WITH RADIAL BASIS AND PROBABILISTIC NEURAL NETWORKS
 CLASSIFICATION WITH RADIAL BASIS AND PROBABILISTIC NEURAL NETWORKS CHAPTER 4 CLASSIFICATION WITH RADIAL BASIS AND PROBABILISTIC NEURAL NETWORKS 4.1 Introduction Optical character recognition is one of
Unsupervised Recursive Sequence Processing
 Unsupervised Recursive Sequence Processing Marc Strickert, Barbara Hammer Dept. of Math./Comp. Science, University of Osnabrück, Germany e-mail: {marc,hammer}@informatik.uni-osnabrueck.de Abstract. We
CSC321: Neural Networks. Lecture 13: Learning without a teacher: Autoencoders and Principal Components Analysis. Geoffrey Hinton
 CSC321: Neural Networks Lecture 13: Learning without a teacher: Autoencoders and Principal Components Analysis Geoffrey Hinton Three problems with backpropagation Where does the supervision come from?
Support Vector Machines
 Support Vector Machines RBF-networks Support Vector Machines Good Decision Boundary Optimization Problem Soft margin Hyperplane Non-linear Decision Boundary Kernel-Trick Approximation Accurancy Overtraining