Introduction to MODE
|
|
|
- Annabella Richard
- 5 years ago
- Views:
Transcription
1 Introduction to MODE Verifying with Objects Presenter: Tara Jensen copyright 2017, UCAR, all rights reserved
 Accumulation threshold (in mm) * User-defined parameters in configuration")
2 MODE Object Identification Source: Davis 2006 (Intensity presented as vertical dimension) Smoothing radius (in grid squares) Accumulation threshold (in mm) * User-defined parameters in configuration file

3 MODE Example Matched Object 1 Matched Object 2 Unmatched Object ENS FCST Radius=5 ObjectThresh >0.25 MergingThresh >0.20 Merging No false alarms OBS Radius=5 ObjectThresh >0.25 MergingThresh >0.20 Matching then Merging Misses Matching
4 Example REFC > 30 dbz Impact of smooting radius Convolution Radius Increases 3 gs Total Interest: 0.96 Area Ratio: 0.53 Centroid Distance: 92km P90 Intensity Ratio: 1.04 Total Interest: 0.96 Area Ratio: 0.57 Centroid Distance: 95km P90 Intensity Ratio: gs Total Interest: 0.96 Area Ratio: 0.57 Centroid Distance: 94km P90 Intensity Ratio: gs FSS = 0.64
5 MODE Input and Usage Input Files Gridded forecast and observation files GRIB1 output of Unified Post-Processor (or other) GRIB2 from NCEP (or other) NetCDF from PCP-Combine, wrf_interp, or CF-compliant Usage: mode fcst_file obs_file config_file [-config_merge merge_config_file] [-outdir path] [-log file] [-v level] Copyright 2017, University Corporation for Atmospheric Research, all rights reserved
6 Config File Config_default
7 Config File Config_default
8 MODE Output PostScript object pictures, definitions matching/merging strategy total interest for each object pair ASCII Text attributes of simple, paired objects and clusters size, shape, position, separation, total interest verification scores (CSI, bias, etc.) for objectified fields netcdf gridded object fields view with ncview copyright 2015, UCAR, all rights reserved

9 Total Interest of object pairs object pictures Pairs above dashed line have high enough Interest to be processed further Field names model description Weight of object attributes Definition of objects smoothing radius intensity threshold area threshold matching and/or merging # and area of objects Median Max. Interest (MMI) copyright 2015, UCAR, all rights reserved


 False Alarm Matched (FY_OY) Hit")
10 Page 2 and 3 of PostScript: Band shows which Simple Objects are merged (aka Cluster) Colors show matching between Fcst and Obs. Raw Fcst Field Raw Obs Field Cluster merged by Fuzzy Logic Simple Obj. not merged by Fuzzy Logic Unmatched (FY_ON) False Alarm Matched (FY_OY) Hit copyright 2015, UCAR, all rights reserved
11 Page 4 of PostScript Objects overlapped In two different views Which do you prefer? copyright 2015, UCAR, all rights reserved
12 Page 5 of PostScript - Summary information for clusters in the domain copyright 2014, UCAR, all rights reserved
 Double Thresholding Value (>=22.")
13 Page 6 & 7 of PostScript Raw Field and Double Thresholding For Merging Process Convolution Threshold (>=25.4mm) Double Thresholding Value (>=22.5mm) copyright 2015, UCAR, all rights reserved
14 Use of Pair Attributes defined by MODE Forecast Field Observed Field Centroid Distance: Provides a quantitative sense of spatial displacement of forecast. Small is good Area Ratio = Fcst Area Obs Area Obs Area Fcst Area copyright 2015, UCAR, all rights reserved Axis Angle: For non-circular objects gives measure of orientation errors. Small is good Area Ratio: Provides an objective measure of whether there is an over- or underprediction of areal extent of forecast. Close to 1 is good
15 Use of Pair Attributes defined by MODE Forecast Field Symmetric Difference: Non-Intersecting Area Obs Value P50 = 26.6 P90 = 31.5 Observed Field Fcst Value P50 = 29.0 P90 = 33.4 Symmetric Diff: May be a good summary statistic for how well Forecast and Observed objects match. Small is good P50 P90 Int: Provides objective measures of Median (50 th percentile) and near-peak (90 th percentile) intensities found in objects. Ratio close To 1 is good Total Interest 0.75 Total Interest: Summary statistic derived from fuzzy logic engine with user-defined Interest Maps for all these attributes plus some others. Close to 1 is good copyright 2015, UCAR, all rights reserved
16 Use of Pair Attributes defined by MODE Forecast Field Symmetric Difference: Non-Intersecting Area Obs Value P50 = 26.6 P90 = 31.5 Observed Field Fcst Value P50 = 29.0 P90 = 33.4 Symmetric Diff: May be a good summary statistic for how well Forecast and Observed objects match. Small is good P50 P90 Int: Provides objective measures of Median (50 th percentile) and near-peak (90 th percentile) intensities found in objects. Ratio close To 1 is good Angle_diff & Sym_diff less so Total Int. higher Total Interest 0.90 Total Interest: Summary statistic derived from fuzzy logic engine with user-defined Interest Maps for all these attributes plus some others. Close to 1 is good copyright 2015, UCAR, all rights reserved
17 Summary Score for Forecast Median of the Max. Interest (MMI*) obs Interest Matrix A 1 fcst observed A B B 2 3 forecast * Davis et al., 2009: The Method for Object-based Diagnostic Evaluation (MODE) Applied to WRF Forecasts from the 2005 SPC Spring Program. Weather and Forecasting maximum interest MMI = median { 0.90, 0.80, 0.90, 0.80, 0.55 } = 0.80 copyright 2015, UCAR, all rights reserved
 obs Interest Matrix A 1 fcst observed A B B 2 3 forecast 1 0.90 0.65 2 0.50 0.80 3 0.40 0.")
 Applied to WRF Forecasts from the 2005")
18 Summary Score for Forecast Median of the Max. Interest (MMI*) obs Interest Matrix A 1 fcst observed A B B 2 3 forecast * Davis et al., 2009: The Method for Object-based Diagnostic Evaluation (MODE) Applied to WRF Forecasts from the 2005 SPC Spring Program. Weather and Forecasting maximum interest MMI = median { 0.90, 0.80, 0.90, 0.80, 0.55 } = 0.80 copyright 2015, UCAR, all rights reserved
 Quilt Plot MMI MMI as a function of convolution radius (grid squares) and threshold (mm) for 24-h forecast of 1-h rainfall")
19 Median of the Max. Interest (MMI) Quilt Plot MMI MMI as a function of convolution radius (grid squares) and threshold (mm) for 24-h forecast of 1-h rainfall Each pixel is a MODE run. This graphic is not in MET, but R code on MET website. copyright 2015, UCAR, all rights reserved
20 Scoring MODE Object Forecasts use total interest threshold to separate matched objects, or hits from false alarms and misses Traditional Categorical Statistics Forecast False Alarm critical success index (CSI) = Hit Hit + Miss + False Alarm Hit fcst Hit obs bias = Hit + False Alarm Hit + Miss Miss sometimes area-weighted Observation copyright 2015, UCAR, all rights reserved

 netcdf gridded object fields view with ncview copyright 2015, UCAR, all rights")
21 MODE Output PostScript object pictures, definitions matching/merging strategy total interest for each object pair ASCII Text attributes of simple, paired objects and clusters size, shape, position, separation, total interest verification scores on smoothed and thresholded fields (objects) netcdf gridded object fields view with ncview copyright 2015, UCAR, all rights reserved
22 ASCII Output Object Attribute file (*.obj) Header with fields names and object definition info Object ID and Category Simple Object Attributes such as Simple Obj. Centroid info, Length, Width, Area, etc Matched Pair/Composite information including Centroid Distance, Angle Difference, Symmetric Difference, etc Contingency Table Stat file (*.cts) Header with fields names and object definition info Contingency Table counts such as number of hits, false alarms, misses and correct negs (in FY FN_OY ON notation) Contingency Table statistics such as BASER, FBIAS, GSS, CSI, PODY, FAR etc copyright 2015, UCAR, all rights reserved
 Plots generated using NCL copyright 2015, UCAR, all")
23 How netcdf could be used Employ a different plotting approach to show matched clusters Display actual intensities inside objects (in this case Reflectivity) Plots generated using NCL copyright 2015, UCAR, all rights reserved

24 Example May 11, 2013 No Ensemble Mean Matched Ensemble Mean Matched Forecast Object Matched Observed Object DTC SREF Tests ARW Members Unmatched Forecast Object Unmatched Observed Object
25 Spread increases With Time

26 MODE Analysis Tool mode_analysis copyright 2015, UCAR, all rights reserved
27 MODE_Analysis Usage Usage: mode_analysis -lookin path -summary or -bycase [-column name] [-dump_row filename] [-out filename] [-log filename] [-v level] [-help] [MODE FILE LIST] [-config config_file] or [MODE LINE OPTIONS] MODE LINE OPTIONS Object Toggles -fcst versus -obs Selects lines pertaining to forecast objects or observation objects -single versus -pair Selects single object lines or pair lines -simple versus -cluster Selects simple object lines or cluster -matched versus -unmatched Selects matched simple object lines or unmatched simple object lines. Other Options (each option followed by value) -model, -fcst obs_thr, -fcst_var, etc -area_min max, -intersection_area_min max, etc -centroid_x_min max, -centroid_y_min max, -axis_ang_min max, -int10_min max, -centroid_dist_min max, -angle_diff_min max, etc copyright 2015, UCAR, all rights reserved
28 MODE Analysis Tool -summary Example Command Line mode_analysis -summary \ -lookin mode_output/wrf4ncep/40km/ge03.\ -fcst -cluster \ -area_min 100 \ -column centroid_lat -column centroid_lon \ -column area \ -column axis_ang \ -column length Provides summary statistics for Forecast Clusters with minimum area of 100 grid-sq for the specified MODE output columns Output Total mode lines read = 393 Total mode lines kept = 17 Field N Min Max Mean StdDev P10 P25 P50 P75 P90 Sum centroid_lat centroid_lon area axis_ang length copyright 2015, UCAR, all rights reserved
29 MODE Analysis Tool -bycase Example Command Line mode_analysis -bycase -lookin mode_output/wrf4ncep/40km/ge03. -single -simple Output Total mode lines read = 393 Total mode lines kept = 141 Fcst Valid Time Area Matched Area Unmatched # Fcst Matched # Fcst Unmatched # Obs Matched # Obs Unmatched Apr 26, :00: May 13, :00: May 14, :00: May 18, :00: May 19, :00: May 25, :00: Jun 1, :00: Jun 3, :00: Jun 4, :00: copyright 2015, UCAR, all rights reserved Provides tallied information for all Simple Objects for each case in directory

30 Introduction to MODE-TD
31 Interpretation Cool colors Warm colors West East X-Y shows geographical location of objects T shows timeline Objects anchored to map are at time T=0 Y X T T=21 T=15 T=0 T=0 T=30 T=23 Obj1B? Longest Duration: Obj2 Shortest Duration: Obj3 T=22 T=17 Merge with Obj 1B NOTE: Need rotation of field or attribute info to know when 1B appeared
 End Velocity Duration Centroid")
32 Attributes (Think of object as 2D slice) End Velocity Duration Centroid Start
33 MODE-TD Input/Output Input Files Gridded forecast and observation files GRIB1 output of Unified Post-Processor (or other) GRIB2 from NCEP (or other) NetCDF from PCP-Combine, wrf_interp, or CF-compliant Output: Single attributes for 2D simple objects (_2d.txt) Single attributes for 3D composite objects (_3d_sc.txt) Pair attributes for 3D simple objects (_3d_ss.txt) Pair attributes for 3D composite objects (_3d_pc.txt) Pair attributes for 3D simple objects (_3d_ps.txt) Object NetCDF file (_obj.nc) Copyright 2017, University Corporation for Atmospheric Research, all rights reserved

34 MODE-TD Usage Usage: mtd -fcst file_1... file_n file_list -obs file_1... file_n file_list -config config_file [-outdir path] [-log file] [-v level] mtd -fcst fcst_files/*.grb \ -obs obs_files/*.grb \ -config MTDConfig_default \ -outdir out_dir/mtd \
35 Examples

36 MODE Time Represented by Animation GFS vs Analysis f000 to f240 every 6 hours High Pressure Objects >= 1025mb Regions Forecast Analysis


37 Forecast MODE Time-Domain Analysis

38 MODE Time-Domain f000 f240 Max Inten Volume Centroid(x,y,t) Velocity Fcst Object , 57, Analysis Object , 59,
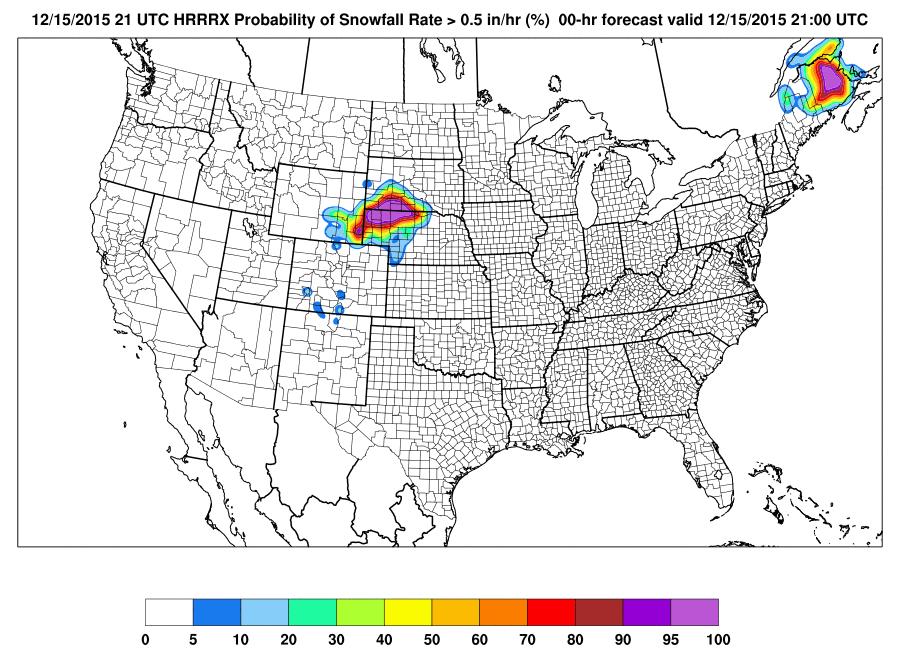


39 MTD on probability fields Objects formed on Prob > 0% Probability of Snowfall Rate > 0.5 per hour from HRRR-TLE

40 MODE-TD applied to drought index for NSF EaSM project Simulation Analysis
41 Comparison Between Methods 2D MODE ERRORS Location Intensity Shape Size Orientation MTD ERRORS Timing Velocity Duration Buildup and Decay 2D MODE Output NetCDF with 2D objects Text with 2D object attributes Postscript file with Objects 3D MODE Output NetCDF with 2D and 3D objects Text with 3D object attributes Text with 2D object attributes
42 MCS in Texas during March 2007 Modeled Observed Slide Courtesy of Andreas Prein, NCAR/MMM
43 JJA Storm tracks Observed Modeled Track density difference Realistic representation of storm tracks Underestimation of storms in Central U.S. by up to - 70 % Slide Courtesy of Andreas Prein, NCAR/MMM

44 Storm Tracks Present Climate Future PresentClimate Climate Observation Storms systems increase in intensity and frequency Slide Courtesy of Andreas Prein, NCAR/MMM
Model Evaluation Tools (MET)
") 1 Model Evaluation Tools (MET) MET Development Team Developmental Testbed Center 16 July 2008 MET Development Team 2 Dave Ahijevych (scientist) Barbara Brown (scientist/statistician) Randy Bullock (software
1 Model Evaluation Tools (MET) MET Development Team Developmental Testbed Center 16 July 2008 MET Development Team 2 Dave Ahijevych (scientist) Barbara Brown (scientist/statistician) Randy Bullock (software
Stat Analysis Tool. Filtering Summarizing Aggregating. of Grid-Stat, Point-Stat, & Wavelet-Stat output
 Stat Analysis Tool Filtering Summarizing Aggregating of Grid-Stat, Point-Stat, & Wavelet-Stat output Presenter: Tara Jensen What can Stat Analysis do for you? Can I get Q: Overall statistics for all gridded
Model Evaluation Tools (MET)
") 1 Model Evaluation Tools (MET) MET Development Team Developmental Testbed Center 27 June 2008 MET Development Team 2 Dave Ahijevych (scientist) Barbara Brown (scientist/statistician) Randy Bullock (software
1 Model Evaluation Tools (MET) MET Development Team Developmental Testbed Center 27 June 2008 MET Development Team 2 Dave Ahijevych (scientist) Barbara Brown (scientist/statistician) Randy Bullock (software
Unifying Verification through a Python-wrapped Suite of Tools
 Support for MET is provided by NOAA, US Air Force, NSF and NCAR through the Developmental Testbed Center (DTC) Unifying Verification through a Python-wrapped Suite of Tools Tara Jensen, John Halley Gotway,
Spatial verification activities at ARPA-SIMC: first results on MesoVICT cases. Maria Stefania Tesini
 Spatial verification activities at ARPA-SIMC: first results on MesoVICT cases Maria Stefania Tesini Andrea Montani, Chiara Marsigli, and Tiziana Paccagnella ARPA-SIMC, Hydro-Meteo-Climate Regional Service,
Frequency Distributions
 Displaying Data Frequency Distributions After collecting data, the first task for a researcher is to organize and summarize the data so that it is possible to get a general overview of the results. Remember,
Model Evaluation Tools Version 3.0 (METv3.0) User s Guide 3.0.2
 User s Guide 3.0.2") Model Evaluation Tools Version 3.0 (METv3.0) User s Guide 3.0.2 Developmental Testbed Center Boulder, Colorado, USA January 2011 ii Contents Section Page Foreword: A note to MET users... vii New for MET
Model Evaluation Tools Version 3.0 (METv3.0) User s Guide 3.0.2 Developmental Testbed Center Boulder, Colorado, USA January 2011 ii Contents Section Page Foreword: A note to MET users... vii New for MET
Method for Object- Based Diagnostic Evaluation
 Method for Object- Based Diagnostic Evaluation Randy Bullock Barbara Brown Tressa Fowler NCAR Technical Notes NCAR/TN-532+STR National Center for Atmospheric Research P. O. Box 3000 Boulder, Colorado 80307-3000
Statistics Lecture 6. Looking at data one variable
 Statistics 111 - Lecture 6 Looking at data one variable Chapter 1.1 Moore, McCabe and Craig Probability vs. Statistics Probability 1. We know the distribution of the random variable (Normal, Binomial)
STA Rev. F Learning Objectives. Learning Objectives (Cont.) Module 3 Descriptive Measures
 Module 3 Descriptive Measures") STA 2023 Module 3 Descriptive Measures Learning Objectives Upon completing this module, you should be able to: 1. Explain the purpose of a measure of center. 2. Obtain and interpret the mean, median, and
STA 2023 Module 3 Descriptive Measures Learning Objectives Upon completing this module, you should be able to: 1. Explain the purpose of a measure of center. 2. Obtain and interpret the mean, median, and
FAA EDR Performance Standards
 FAA EDR Performance Standards Project Summary and Recommendations Presented To: Turbulence Workshop - 2 Presented by: Michael Emanuel Advanced Concepts & Technology Development, Aviation Weather Division,
Chapter 1. Looking at Data-Distribution
 Chapter 1. Looking at Data-Distribution Statistics is the scientific discipline that provides methods to draw right conclusions: 1)Collecting the data 2)Describing the data 3)Drawing the conclusions Raw
MET+ MET+ Unified Package. Python wrappers around MET and METViewer: Python wrappers
 MET+ Overview MET+ Unified Package Python wrappers around MET and METViewer: 2 Simple to set-up and run Automated plotting of 2D fields and statistics Initial system - Global deterministic with plans to
Tuning an Algorithm for Identifying and Tracking Cells
 Tuning an Algorithm for Identifying and Tracking Cells VA L L I A P PA L A K S H M A N A N N AT I O N A L S E V E R E S T O R M S L A B O R AT O R Y / U N I V E R S I T Y O F O K L A H O M A J U LY, 2
STA Module 2B Organizing Data and Comparing Distributions (Part II)
") STA 2023 Module 2B Organizing Data and Comparing Distributions (Part II) Learning Objectives Upon completing this module, you should be able to 1 Explain the purpose of a measure of center 2 Obtain and
STA 2023 Module 2B Organizing Data and Comparing Distributions (Part II) Learning Objectives Upon completing this module, you should be able to 1 Explain the purpose of a measure of center 2 Obtain and
STA Learning Objectives. Learning Objectives (cont.) Module 2B Organizing Data and Comparing Distributions (Part II)
 Module 2B Organizing Data and Comparing Distributions (Part II)") STA 2023 Module 2B Organizing Data and Comparing Distributions (Part II) Learning Objectives Upon completing this module, you should be able to 1 Explain the purpose of a measure of center 2 Obtain and
STA 2023 Module 2B Organizing Data and Comparing Distributions (Part II) Learning Objectives Upon completing this module, you should be able to 1 Explain the purpose of a measure of center 2 Obtain and
Univariate Statistics Summary
 Further Maths Univariate Statistics Summary Types of Data Data can be classified as categorical or numerical. Categorical data are observations or records that are arranged according to category. For example:
Data Mining Storm Attributes
 Data Mining Storm Attributes VA L L I A P PA L A K S H M A N A N N AT I O N A L S E V E R E S T O R M S L A B O R AT O R Y / U N I V E R S I T Y O F O K L A H O M A L A K S H M A N @ O U. E D U AT C I
Syed RH Rizvi.
 Community Tools: gen_be Syed RH Rizvi National Center For Atmospheric Research NCAR/ESSL/MMM, Boulder, CO-80307, USA rizvi@ucar.edu 0 Talk overview What is gen_be? How it works? Some technical details
Using the GOES-16 GLM
 Using the GOES-16 GLM First and Foremost: Find it here! https://github.com/deeplycloudy/glmtools The hard stuff first! Gridding Data GLM pixel grid: -Geostationary Projection (rads) Gridding Data GLM pixel
Anno accademico 2006/2007. Davide Migliore
 Robotica Anno accademico 6/7 Davide Migliore migliore@elet.polimi.it Today What is a feature? Some useful information The world of features: Detectors Edges detection Corners/Points detection Descriptors?!?!?
Local Features: Detection, Description & Matching
 Local Features: Detection, Description & Matching Lecture 08 Computer Vision Material Citations Dr George Stockman Professor Emeritus, Michigan State University Dr David Lowe Professor, University of British
1. Interpreting the Results: Visualization 1
 1. Interpreting the Results: Visualization 1 visual/graphical/optical representation of large sets of data: data from experiments or measurements: satellite images, tomography in medicine, microsopy,...
GSI fundamentals (4): Background Error Covariance and Observation Error
: Background Error Covariance and Observation Error") 27 GSI Community Tutorial July 2, 27, College Park, MD GSI fundamentals (4): Background Error Covariance and Observation Error Ming Hu Developmental Testbed Center Outline GSI fundamentals (): Setup and
27 GSI Community Tutorial July 2, 27, College Park, MD GSI fundamentals (4): Background Error Covariance and Observation Error Ming Hu Developmental Testbed Center Outline GSI fundamentals (): Setup and
Points Lines Connected points X-Y Scatter. X-Y Matrix Star Plot Histogram Box Plot. Bar Group Bar Stacked H-Bar Grouped H-Bar Stacked
 Plotting Menu: QCExpert Plotting Module graphs offers various tools for visualization of uni- and multivariate data. Settings and options in different types of graphs allow for modifications and customizations
2.1 Objectives. Math Chapter 2. Chapter 2. Variable. Categorical Variable EXPLORING DATA WITH GRAPHS AND NUMERICAL SUMMARIES
 EXPLORING DATA WITH GRAPHS AND NUMERICAL SUMMARIES Chapter 2 2.1 Objectives 2.1 What Are the Types of Data? www.managementscientist.org 1. Know the definitions of a. Variable b. Categorical versus quantitative
Topic 6 Representation and Description
 Topic 6 Representation and Description Background Segmentation divides the image into regions Each region should be represented and described in a form suitable for further processing/decision-making Representation
Big Ideas. Objects can be transferred in an infinite number of ways. Transformations can be described and analyzed mathematically.
 Big Ideas Numbers, measures, expressions, equations, and inequalities can represent mathematical situations and structures in many equivalent forms. Objects can be transferred in an infinite number of
Beyond The Vector Data Model - Part Two
 Beyond The Vector Data Model - Part Two Introduction Spatial Analyst Extension (Spatial Analysis) What is your question? Selecting a method of analysis Map Algebra Who is the audience? What is Spatial
CHAPTER 1. Introduction. Statistics: Statistics is the science of collecting, organizing, analyzing, presenting and interpreting data.
 1 CHAPTER 1 Introduction Statistics: Statistics is the science of collecting, organizing, analyzing, presenting and interpreting data. Variable: Any characteristic of a person or thing that can be expressed
Multimedia Computing: Algorithms, Systems, and Applications: Edge Detection
 Multimedia Computing: Algorithms, Systems, and Applications: Edge Detection By Dr. Yu Cao Department of Computer Science The University of Massachusetts Lowell Lowell, MA 01854, USA Part of the slides
AND NUMERICAL SUMMARIES. Chapter 2
 EXPLORING DATA WITH GRAPHS AND NUMERICAL SUMMARIES Chapter 2 2.1 What Are the Types of Data? 2.1 Objectives www.managementscientist.org 1. Know the definitions of a. Variable b. Categorical versus quantitative
Moving Weather Model Ensembles To A Geospatial Database For The Aviation Weather Center
 Moving Weather Model Ensembles To A Geospatial Database For The Aviation Weather Center Presented by Jeff Smith April 2, 2013 NOAA's Earth System Research Lab in Boulder, CO Background -1 NCEP is NOAA
ECE 176 Digital Image Processing Handout #14 Pamela Cosman 4/29/05 TEXTURE ANALYSIS
 ECE 176 Digital Image Processing Handout #14 Pamela Cosman 4/29/ TEXTURE ANALYSIS Texture analysis is covered very briefly in Gonzalez and Woods, pages 66 671. This handout is intended to supplement that
Spatial Distributions of Precipitation Events from Regional Climate Models
 Spatial Distributions of Precipitation Events from Regional Climate Models N. Lenssen September 2, 2010 1 Scientific Reason The Institute of Mathematics Applied to Geosciences (IMAGe) and the National
Chapter 2 Modeling Distributions of Data
 Chapter 2 Modeling Distributions of Data Section 2.1 Describing Location in a Distribution Describing Location in a Distribution Learning Objectives After this section, you should be able to: FIND and
Lab Practical - Limit Equilibrium Analysis of Engineered Slopes
 Lab Practical - Limit Equilibrium Analysis of Engineered Slopes Part 1: Planar Analysis A Deterministic Analysis This exercise will demonstrate the basics of a deterministic limit equilibrium planar analysis
6. Object Identification L AK S H M O U. E D U
 6. Object Identification L AK S H M AN @ O U. E D U Objects Information extracted from spatial grids often need to be associated with objects not just an individual pixel Group of pixels that form a real-world
Types of Edges. Why Edge Detection? Types of Edges. Edge Detection. Gradient. Edge Detection
 Why Edge Detection? How can an algorithm extract relevant information from an image that is enables the algorithm to recognize objects? The most important information for the interpretation of an image
CRA method application for MesoVICT cases. A. Bundel and A. Muraviev, Hydrometcentre of Russia, Roshydromet
 CRA method application for MesoVICT cases A. Bundel and A. Muraviev, Hydrometcentre of Russia, Roshydromet Setup of experiments Mesovict core case: 20-22 June 2007 1-h precipitation accumulations Obs:
SUPPLEMENTARY FILE S1: 3D AIRWAY TUBE RECONSTRUCTION AND CELL-BASED MECHANICAL MODEL. RELATED TO FIGURE 1, FIGURE 7, AND STAR METHODS.
 SUPPLEMENTARY FILE S1: 3D AIRWAY TUBE RECONSTRUCTION AND CELL-BASED MECHANICAL MODEL. RELATED TO FIGURE 1, FIGURE 7, AND STAR METHODS. 1. 3D AIRWAY TUBE RECONSTRUCTION. RELATED TO FIGURE 1 AND STAR METHODS
Computer Vision I. Announcements. Fourier Tansform. Efficient Implementation. Edge and Corner Detection. CSE252A Lecture 13.
 Announcements Edge and Corner Detection HW3 assigned CSE252A Lecture 13 Efficient Implementation Both, the Box filter and the Gaussian filter are separable: First convolve each row of input image I with
Name: Date: Per: WARM UP
 Name: Date: Per: 6.1.1-6.1.3 WARM UP 6-23. In the last three lessons, you have investigated rigid transformations: reflections, rotations, and translations. 1. What happens to a shape when you perform
HOUGH TRANSFORM CS 6350 C V
 HOUGH TRANSFORM CS 6350 C V HOUGH TRANSFORM The problem: Given a set of points in 2-D, find if a sub-set of these points, fall on a LINE. Hough Transform One powerful global method for detecting edges
Stat 528 (Autumn 2008) Density Curves and the Normal Distribution. Measures of center and spread. Features of the normal distribution
 Density Curves and the Normal Distribution. Measures of center and spread. Features of the normal distribution") Stat 528 (Autumn 2008) Density Curves and the Normal Distribution Reading: Section 1.3 Density curves An example: GRE scores Measures of center and spread The normal distribution Features of the normal
Stat 528 (Autumn 2008) Density Curves and the Normal Distribution Reading: Section 1.3 Density curves An example: GRE scores Measures of center and spread The normal distribution Features of the normal
Vocabulary. 5-number summary Rule. Area principle. Bar chart. Boxplot. Categorical data condition. Categorical variable.
 5-number summary 68-95-99.7 Rule Area principle Bar chart Bimodal Boxplot Case Categorical data Categorical variable Center Changing center and spread Conditional distribution Context Contingency table
Parallel Coordinate Plots
 Page 1 of 6 Parallel Coordinate Plots Parallel coordinates plots are a technique used for representing high dimensional data. To show a set of points in an n dimensional space onto a 2D surface (the computer
Edge and local feature detection - 2. Importance of edge detection in computer vision
 Edge and local feature detection Gradient based edge detection Edge detection by function fitting Second derivative edge detectors Edge linking and the construction of the chain graph Edge and local feature
Digital Image Processing
 Digital Image Processing Part 9: Representation and Description AASS Learning Systems Lab, Dep. Teknik Room T1209 (Fr, 11-12 o'clock) achim.lilienthal@oru.se Course Book Chapter 11 2011-05-17 Contents
Clustering & Classification (chapter 15)
") Clustering & Classification (chapter 5) Kai Goebel Bill Cheetham RPI/GE Global Research goebel@cs.rpi.edu cheetham@cs.rpi.edu Outline k-means Fuzzy c-means Mountain Clustering knn Fuzzy knn Hierarchical
Clustering & Classification (chapter 5) Kai Goebel Bill Cheetham RPI/GE Global Research goebel@cs.rpi.edu cheetham@cs.rpi.edu Outline k-means Fuzzy c-means Mountain Clustering knn Fuzzy knn Hierarchical
Uniform Resource Locator Wide Area Network World Climate Research Programme Coupled Model Intercomparison
 Glossary API Application Programming Interface AR5 IPCC Assessment Report 4 ASCII American Standard Code for Information Interchange BUFR Binary Universal Form for the Representation of meteorological
Distributed Online Data Access and Analysis
 Distributed Online Data Access and Analysis Ruixin Yang George Mason University Slides from SIESIP Partners and from NOMADS PI, Glenn K. Rutledge of US NCDC on NOMADS SIESIP: Seasonal-to-Interannual Earth
3. Data Structures for Image Analysis L AK S H M O U. E D U
 3. Data Structures for Image Analysis L AK S H M AN @ O U. E D U Different formulations Can be advantageous to treat a spatial grid as a: Levelset Matrix Markov chain Topographic map Relational structure
Colorado School of Mines. Computer Vision. Professor William Hoff Dept of Electrical Engineering &Computer Science.
 Professor William Hoff Dept of Electrical Engineering &Computer Science http://inside.mines.edu/~whoff/ 1 Image Segmentation Some material for these slides comes from https://www.csd.uwo.ca/courses/cs4487a/
Mosaics. Today s Readings
 Mosaics VR Seattle: http://www.vrseattle.com/ Full screen panoramas (cubic): http://www.panoramas.dk/ Mars: http://www.panoramas.dk/fullscreen3/f2_mars97.html Today s Readings Szeliski and Shum paper (sections
Unit #13 : Integration to Find Areas and Volumes, Volumes of Revolution
 Unit #13 : Integration to Find Areas and Volumes, Volumes of Revolution Goals: Beabletoapplyaslicingapproachtoconstructintegralsforareasandvolumes. Be able to visualize surfaces generated by rotating functions
Instituting an observation database (ODB) capability in the GSI
 capability in the GSI") Instituting an observation database (ODB) capability in the GSI Jeff Whitaker, Scott Gregory, and Tom Hamill NOAA / ESRL Physical Sciences Division Presentation to Blueprints for Next-Generation Data Assimilation
Instituting an observation database (ODB) capability in the GSI Jeff Whitaker, Scott Gregory, and Tom Hamill NOAA / ESRL Physical Sciences Division Presentation to Blueprints for Next-Generation Data Assimilation
Terms and definitions * keep definitions of processes and terms that may be useful for tests, assignments
 Lecture 1 Core of GIS Thematic layers Terms and definitions * keep definitions of processes and terms that may be useful for tests, assignments Lecture 2 What is GIS? Info: value added data Data to solve
LAB 1 INSTRUCTIONS DESCRIBING AND DISPLAYING DATA
 LAB 1 INSTRUCTIONS DESCRIBING AND DISPLAYING DATA This lab will assist you in learning how to summarize and display categorical and quantitative data in StatCrunch. In particular, you will learn how to
CS4670: Computer Vision
 CS4670: Computer Vision Noah Snavely Lecture 6: Feature matching and alignment Szeliski: Chapter 6.1 Reading Last time: Corners and blobs Scale-space blob detector: Example Feature descriptors We know
Downloading and Compiling MET
 Downloading and Compiling MET John Halley Gotway Release History METv0.9: Beta release July, 2007 METv1.0: First official release January, 2008 METv1.1: Incremental upgrades July, 2008 METv2.0: Probabilistic
Minimizing Noise and Bias in 3D DIC. Correlated Solutions, Inc.
 Minimizing Noise and Bias in 3D DIC Correlated Solutions, Inc. Overview Overview of Noise and Bias Digital Image Correlation Background/Tracking Function Minimizing Noise Focus Contrast/Lighting Glare
Analysis of Image and Video Using Color, Texture and Shape Features for Object Identification
 IOSR Journal of Computer Engineering (IOSR-JCE) e-issn: 2278-0661,p-ISSN: 2278-8727, Volume 16, Issue 6, Ver. VI (Nov Dec. 2014), PP 29-33 Analysis of Image and Video Using Color, Texture and Shape Features
Homework Packet Week #3
 Lesson 8.1 Choose the term that best completes statements # 1-12. 10. A data distribution is if the peak of the data is in the middle of the graph. The left and right sides of the graph are nearly mirror
Image Sampling and Quantisation
 Image Sampling and Quantisation Introduction to Signal and Image Processing Prof. Dr. Philippe Cattin MIAC, University of Basel 1 of 46 22.02.2016 09:17 Contents Contents 1 Motivation 2 Sampling Introduction
UTIA 3.0 Ultrasonic Imaging and Analysis (1)
") UTIA 3.0 Ultrasonic Imaging and Analysis (1) Advanced Automated UT data presentation C-Scan images for single or multi-scan (combine many scans in a single area representation). Data (thickness, amplitude)
UTIA 3.0 Ultrasonic Imaging and Analysis (1) Advanced Automated UT data presentation C-Scan images for single or multi-scan (combine many scans in a single area representation). Data (thickness, amplitude)
Study Guide and Review - Chapter 10
 State whether each sentence is true or false. If false, replace the underlined word, phrase, expression, or number to make a true sentence. 1. A triangle with sides having measures of 3, 4, and 6 is a
Large and Sparse Mass Spectrometry Data Processing in the GPU Jose de Corral 2012 GPU Technology Conference
 Large and Sparse Mass Spectrometry Data Processing in the GPU Jose de Corral 2012 GPU Technology Conference 2012 Waters Corporation 1 Agenda Overview of LC/IMS/MS 3D Data Processing 4D Data Processing
Study Guide and Review - Chapter 10
 State whether each sentence is true or false. If false, replace the underlined word, phrase, expression, or number to make a true sentence. 1. A triangle with sides having measures of 3, 4, and 6 is a
Image Sampling & Quantisation
 Image Sampling & Quantisation Biomedical Image Analysis Prof. Dr. Philippe Cattin MIAC, University of Basel Contents 1 Motivation 2 Sampling Introduction and Motivation Sampling Example Quantisation Example
Object detection using Region Proposals (RCNN) Ernest Cheung COMP Presentation
 Ernest Cheung COMP Presentation") Object detection using Region Proposals (RCNN) Ernest Cheung COMP790-125 Presentation 1 2 Problem to solve Object detection Input: Image Output: Bounding box of the object 3 Object detection using CNN
Object detection using Region Proposals (RCNN) Ernest Cheung COMP790-125 Presentation 1 2 Problem to solve Object detection Input: Image Output: Bounding box of the object 3 Object detection using CNN
Edge Detection (with a sidelight introduction to linear, associative operators). Images
. Images") Images (we will, eventually, come back to imaging geometry. But, now that we know how images come from the world, we will examine operations on images). Edge Detection (with a sidelight introduction to
Images (we will, eventually, come back to imaging geometry. But, now that we know how images come from the world, we will examine operations on images). Edge Detection (with a sidelight introduction to
CSE 5243 INTRO. TO DATA MINING
 CSE 5243 INTRO. TO DATA MINING Cluster Analysis: Basic Concepts and Methods Huan Sun, CSE@The Ohio State University 09/25/2017 Slides adapted from UIUC CS412, Fall 2017, by Prof. Jiawei Han 2 Chapter 10.
Enhanced material contrast by dual-energy microct imaging
 Enhanced material contrast by dual-energy microct imaging Method note Page 1 of 12 2 Method note: Dual-energy microct analysis 1. Introduction 1.1. The basis for dual energy imaging Micro-computed tomography
Theory of Robotics and Mechatronics
 Theory of Robotics and Mechatronics Final Exam 19.12.2016 Question: 1 2 3 Total Points: 18 32 10 60 Score: Name: Legi-Nr: Department: Semester: Duration: 120 min 1 A4-sheet (double sided) of notes allowed
Chapter 4. Clustering Core Atoms by Location
 Chapter 4. Clustering Core Atoms by Location In this chapter, a process for sampling core atoms in space is developed, so that the analytic techniques in section 3C can be applied to local collections
number Understand the equivalence between recurring decimals and fractions
 number Understand the equivalence between recurring decimals and fractions Using and Applying Algebra Calculating Shape, Space and Measure Handling Data Use fractions or percentages to solve problems involving
Chapter 5. Normal. Normal Curve. the Normal. Curve Examples. Standard Units Standard Units Examples. for Data
 curve Approximation Part II Descriptive Statistics The Approximation Approximation The famous normal curve can often be used as an 'ideal' histogram, to which histograms for data can be compared. Its equation
Age Related Maths Expectations
 Step 1 Times Tables Addition Subtraction Multiplication Division Fractions Decimals Percentage & I can count in 2 s, 5 s and 10 s from 0 to 100 I can add in 1 s using practical resources I can add in 1
Segmentation and Grouping
 Segmentation and Grouping How and what do we see? Fundamental Problems ' Focus of attention, or grouping ' What subsets of pixels do we consider as possible objects? ' All connected subsets? ' Representation
University of Florida CISE department Gator Engineering. Clustering Part 2
 Clustering Part 2 Dr. Sanjay Ranka Professor Computer and Information Science and Engineering University of Florida, Gainesville Partitional Clustering Original Points A Partitional Clustering Hierarchical
Ms Nurazrin Jupri. Frequency Distributions
 Frequency Distributions Frequency Distributions After collecting data, the first task for a researcher is to organize and simplify the data so that it is possible to get a general overview of the results.
Table of Contents (As covered from textbook)
") Table of Contents (As covered from textbook) Ch 1 Data and Decisions Ch 2 Displaying and Describing Categorical Data Ch 3 Displaying and Describing Quantitative Data Ch 4 Correlation and Linear Regression
Table of Contents (As covered from textbook) Ch 1 Data and Decisions Ch 2 Displaying and Describing Categorical Data Ch 3 Displaying and Describing Quantitative Data Ch 4 Correlation and Linear Regression
Lecture 9: Hough Transform and Thresholding base Segmentation
 #1 Lecture 9: Hough Transform and Thresholding base Segmentation Saad Bedros sbedros@umn.edu Hough Transform Robust method to find a shape in an image Shape can be described in parametric form A voting
Image Processing. Bilkent University. CS554 Computer Vision Pinar Duygulu
 Image Processing CS 554 Computer Vision Pinar Duygulu Bilkent University Today Image Formation Point and Blob Processing Binary Image Processing Readings: Gonzalez & Woods, Ch. 3 Slides are adapted from
Vector Visualization
 Vector Visualization Vector Visulization Divergence and Vorticity Vector Glyphs Vector Color Coding Displacement Plots Stream Objects Texture-Based Vector Visualization Simplified Representation of Vector
CoE4TN4 Image Processing
 CoE4TN4 Image Processing Chapter 11 Image Representation & Description Image Representation & Description After an image is segmented into regions, the regions are represented and described in a form suitable
Downloaded from
 UNIT 2 WHAT IS STATISTICS? Researchers deal with a large amount of data and have to draw dependable conclusions on the basis of data collected for the purpose. Statistics help the researchers in making
How and what do we see? Segmentation and Grouping. Fundamental Problems. Polyhedral objects. Reducing the combinatorics of pose estimation
 Segmentation and Grouping Fundamental Problems ' Focus of attention, or grouping ' What subsets of piels do we consider as possible objects? ' All connected subsets? ' Representation ' How do we model
Comparative Visualization and Trend Analysis Techniques for Time-Varying Data
 Comparative Visualization and Trend Analysis Techniques for Time-Varying Data I was just noticing Problem Statement Time varying visualization for scientific data has typically been done with animation
PSoC 4 Capacitive Sensing (CapSense Gesture)
") PSoC Creator Component Datasheet PSoC 4 Capacitive Sensing (CapSense Gesture) 2.10 Features The CapSense Gesture Component provides the full functionality of CapSense Sigma-Delta Modulator (CapSense CSD)
PSoC Creator Component Datasheet PSoC 4 Capacitive Sensing (CapSense Gesture) 2.10 Features The CapSense Gesture Component provides the full functionality of CapSense Sigma-Delta Modulator (CapSense CSD)
Introduction to scientific visualization with ParaView
 Introduction to scientific visualization with ParaView Tijs de Kler SURFsara Visualization group Tijs.dekler@surfsara.nl (some slides courtesy of Robert Belleman, UvA) Outline Pipeline and data model (10
Local Patch Descriptors
 Local Patch Descriptors Slides courtesy of Steve Seitz and Larry Zitnick CSE 803 1 How do we describe an image patch? How do we describe an image patch? Patches with similar content should have similar
Automated Particle Size & Shape Analysis System
 Biovis PSA2000 Automated Particle Size & Shape Analysis System Biovis PSA2000 is an automated imaging system used to detect, characterize, categorize and report, the individual and cumulative particle
CSE 5243 INTRO. TO DATA MINING
 CSE 5243 INTRO. TO DATA MINING Cluster Analysis: Basic Concepts and Methods Huan Sun, CSE@The Ohio State University Slides adapted from UIUC CS412, Fall 2017, by Prof. Jiawei Han 2 Chapter 10. Cluster
Instituting an observation database
 Instituting an observation database capability in the NCEP GSI Tom Hamill, Jeff Whitaker, Scott Gregory NOAA / ESRL Physical Sciences Division Presentation to DAOS, Exeter England, April 2016 Our intent:
Geographic Information System and its Application in Hydro-Meteorology Exercises using SavGIS
 Geographic Information System and its Application in Hydro-Meteorology Exercises using SavGIS Jothiganesh Shanmugasundaram Decision Support Tool Development Specialist COPY DATABASE FOLDER BHUTAN in to
Spectral Classification
 Spectral Classification Spectral Classification Supervised versus Unsupervised Classification n Unsupervised Classes are determined by the computer. Also referred to as clustering n Supervised Classes
Fitting: The Hough transform
 Fitting: The Hough transform Voting schemes Let each feature vote for all the models that are compatible with it Hopefully the noise features will not vote consistently for any single model Missing data
Gain familiarity with factors and multiples. Use place value understanding and properties of operations to perform multi-digit arithmetic.
 Prairie-Hills Elementary School District 144 4 th Grade ~ MATH Curriculum Map Quarter 1 Month: August, September, October Domain(s): Operations and Algebraic Thinking Number Base Ten (NBT) Cluster(s):