Comparative Visualization and Trend Analysis Techniques for Time-Varying Data
|
|
|
- Ambrose Warren
- 5 years ago
- Views:
Transcription

1 Comparative Visualization and Trend Analysis Techniques for Time-Varying Data
2 I was just noticing
3 Problem Statement Time varying visualization for scientific data has typically been done with animation and/or time step still renders Animation or frame comparison may not be the only way to understand time-varying data Perceptual, visual, and cognitive issues Lack of knowledge of temporal trends Hard to make a transfer function for time data

4 Locating Differences The Worst Case
5 Animation Short Term Visual Memory

6 Count the Passes
7 Lack of Quantitative Knowledge Classifying Time Data What values does the time series have over time? What are the value ranges over a time period? What data points or features share similar value trends or are different? Transfer functions (classifying data/features) are hard Tons of literature for just for making transfer functions for single time steps Lack of knowledge of changing values and trends What values and data points should we classify? How to classify them over time?
8 Approaches Comparative Visualization Single frame fused comparisons of multiple time steps Visually compare changes over time in space and value to find temporal features Trend Analysis Visualize temporal value trends in a data set for quantitative assessment Computationally analyze temporal trends to extract features for classification

9 Comparative Visualization


10 Comparative Visualization Combine multiple time steps into a single static data set


11 Trend Analysis Value activity representation allows for quantitative trend knowledge
12 Trend Analysis Computationally analyze value trends for classification and feature definition
13 Outline Comparative Visualization Chronovolumes Trend Analysis Multi-scale temporal trend spreadsheet Time histograms Semi-automatic temporal transfer functions


14 Comparative Visualization - Chronovolumes
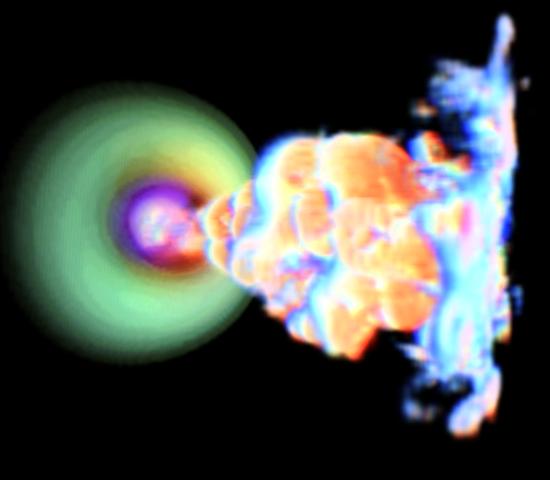
15 Chronovolumes Visually compare time series data by visually fusing several time steps into one volume Provides temporal context into the frame Full 3D comparison, not image composition Image pixel comparison is not the same as data point comparison Spatial position preservation in the comparison Compare per data point over time basis, not per projected point
16 Chronovolumes rendering comparison comparison rendering


17 More Chronovolume Examples Alpha composition Average Min Additive color XOR OUT
18 Comparison Implementations High Dimensional Projection (reduction) Treat the time-varying data as 4D (space + time) data and project down to 3D, apply operations per data point over time Composition (arbitrary comparison) Compose several 3D volumes together into one volume, with operation trees (kernels) per data point Both of these are massively data parallel operations can be easily implemented in a volume renderer/shader (GLSL, OpenCL, Cuda, MPI, C/C++ threads, etc.)


19 2D Analogy Arrow is operations applied in parallel per point project/reduce over time compose multiple time steps
20 Example Comparison Operations Post-classification (color then compare) Alpha Composition (evolution) Color Addition (spatial overlap) Pre-classification (compare then color) Numerical operations (integrated data analysis) Min, max, mean, median, etc. Sum, product, difference, etc. Inner product, outer product, etc. Set operations using composition notation (in, out, xor, atop, over, pass, clear) (spatial overlap)
21 Implementation Chronovolumes: for p in all points for t in all time steps in some order output p = reduction operation(output p, p at t) Composition: for p in all points output p = apply kernel program at point p (arbitrary selection and composition of time steps) Example chronovolume code is provided in chrono.cpp
22 Trend Analysis and Visualization Time Series/Activity Curve (TAC) Quantitative visualization of time-varying data by representing data points as values over time Represent data points as time series (activity) curves Coined as TAC vectors by Fang et al. A TAC vector is a data point (point in space) representing data values over time at that point t=0 t=1 t=2


23 Classifying Features by Trend Our assumption is that features are defined by data points that have similar temporal behavior, (the value change over time is similar) meaning they have a similar TAC This can be found computationally through vector clustering of TACs

24 Animation Rescaling by TAC
25 Classes across Time Scales Temporal activity can happen at different time scales Short term scale: daily or monthly weather Long term scale: yearly or decadal weather Activity classes are clustered by time scale Use filter banks to pass-band filter the TACs into different time scales and then cluster by scale Data points are separately classified in each time scale, thus different trends are identified

26 Trend Visualization Visualization Spreadsheet <- longer time scale <- longer time scale different clusters Low frequency curves DC/mean component High frequency curves Differences
 5 similarity to a selected")
27 A Cell in the Spreadsheet 1 thumbnail 2 centroid TAC 3 one stddev value variance from the centroid 4 cluster size (number of points) 5 similarity to a selected cell
 Similar trend")

28 Selection and Resorting the Spreadsheet by Relevance When a cell is selected, rows and columns are resorted to show relevance to a picked cell (trend cluster) Similar trend clusters are moved closer to the row of a picked cell (doesn t move out of column) based on various distance metrics (centroid, spatial overlap, etc.) Before selecting cell 1 After selecting cell 1

29 Spreadsheet Cell Merging and Culling
30 Implementation Represent data as a vector field: rather than scalars of (x, y, z, t) = v, as TAC vectors of (x, y, z) = <v 0, v 1, v 2, > Pass-band filter the vectors into different time scales (the paper implementation used wavelets) Cluster the vectors using vector clustering by frequency band to separate time scales (k-means, hierarchical, etc.) Visualize the clusters in a spreadsheet There isn t an available reference implementation of the spreadsheet and pass-band filtering, but the clustering code can be found in tstf-1.0.tar.gz
31 Time Histograms Trends can also be shown via time histograms They have a better representation of the value distribution over time of a cluster centroid TAC is just the average trend Kosara et al., TimeHistograms for Large, Time- Dependent Data Akiba et al., Simultaneous Classification of Time-Varying Volume Data Based on the Time Histogram


32 Time Histograms Typical histogram Adding time as a dimension Flattening it Height = Intensity Images from Kosara et al.


33 Time Histogram Examples Images from Akiba et al.

34 Using Time Histograms for Transfer Functions/Classification Image from Akiba et al.
35 Implementation for t in all time steps create a histogram for time step t for x in time steps for y in number of histogram bins Render pixel (x, y) as the intensity of bin y in histogram x The code in tstf-1.0.tar.gz has examples of creating time histogram images


36 TAC Clustering Classification compared to Time Histograms value count (intensity) time

37 Trend Clustering for Semi-Automatic Time-Series Transfer Functions Static transfer function Automatic method Early time step Late time step

38 Semi-Automatic Time Series Transfer Functions in Animation


39 Trend Classification for Moving Features Whole time series TAC clustering works for well classifying stationary features that have temporal behavior (climate regions, an earthquake basin) For a moving feature/wave, using normal TAC clustering, where the clustered time series curves have lengths of the whole time series, it captures the space that a moving wave passes through over time

40 Using this Knowledge to Classify a Moving Wave/Feature The data points (spatial area) that comprise a wave front have similar behavior for a short period as the wave moves through a region of space As a wave moves in space, data points that contain the wave at a point in time, will be similar to a set of data points with the same trend, in near future and near past t = 0 t = 1 t = 2
 Similarity is found per time step, by clustering each time step individually data points (TACs) Each time step has a set of clusters which represents similar local activity at that time step")
41 Windowed TAC Clustering Finding Features at a Time Step Find similar behavior in the short term: ignore far future and far past similarity Window the TACs (box filter, Gaussian filter, etc.) Similarity is found per time step, by clustering each time step individually data points (TACs) Each time step has a set of clusters which represents similar local activity at that time step individually, clusters do not represent activity over the entire time range, but just the features/ activities that are occurring in a short time period
 are put into a graph graph edges are a probability estimate of similarity between clusters over")
42 Cluster Sequencing Connecting the Features over Time To connect TAC clusters into an evolving or moving feature, link the clusters over time that are similar/same Measure the similarity between clusters and link them into a sequence by probable evolution Clusters of data points (the circles) are put into a graph graph edges are a probability estimate of similarity between clusters over time: low probability edges are culled Paths in the graph are classes, which represents a sequence of clusters or the evolution of a value population over time following local trends over the entire time series
43 Visualizing the Clusters and Sequences An animation using a selected sequence turned into a transfer function
44 Using the Cluster Sequences for Transfer Functions and Classification Sequences are classes of evolving value space features Each cluster in a sequence records value distribution (histogram) of the data points Map the histogram of a time step to a color/alpha map For a dynamic transfer function: use histogram equalization to update the color/alpha map as the value distribution changes over time i.e., remap the color distribution based on the value distribution shift to maintain visual coherence The sequence classification can also be used for isosurfacing, spatial boundaries, etc.


45 Different Types of Possible Transfer Functions Static = Summed cluster histograms over time = Single map Dynamic Color Dynamic = Cluster Histogram per time step = Changing Color/alpha map Static color Dynamic Opacity Static Opacity
46 Implementation Represent data as a vector field: rather than scalars of (x, y, z, t) = v, as TAC vectors of (x, y, z) = <v 0, v 1, v 2, > for t in all time steps cluster TACs in a small time window around t Connect the clusters into a graph, with edges connecting a cluster to all other clusters one time step in the future and past A graph edge represents the probability that a cluster is the same value space temporal feature in an adjacent time step calculate the similarity of adjacent clusters, and remove edges that have low probability (similarity)
47 Implementation Find all paths in the culled graph paths are sequences or an evolving value space feature Visualize the sequences Use the sequences in other visualizations To generate a dynamic time-varying transfer function Apply a histogram to color/alpha mapping for one time step Use histogram equalization of the value distribution to update the color/alpha map A reference implementation of this work is found in tstf-1.0.tar.gz
48 For Further Information Jon Woodring Included are these slides, chrono.cpp, and tstf-1.0.tar.gz Woodring and Shen, Semi-Automatic Time-Series Transfer Functions via Temporal Clustering and Sequencing Woodring and Shen, Multiscale Time Activity Data Exploration via Temporal Clustering Visualization Spreadsheet Woodring and Shen, Multi-variate, Time Varying, and Comparative Visualization with Contextual Cues Woodring, Wang, and Shen, High Dimensional Direct Rendering of Time-Varying Volumetric Data Kosara et al., TimeHistograms for Large, Time-Dependent Data Akiba et al., Simultaneous Classification of Time-Varying Volume Data Based on the Time Histogram
49 Final Slide Jian Huang - huangj@cs.utk.edu Wes Kendall - wesleykendall@gmail.com Heike Janicke - H.Jaenicke@swansea.ac.uk Chaoli Wang - chaoliw@mtu.edu Jon Woodring - woodring@lanl.gov Slides will be uploaded soon
Applications. Foreground / background segmentation Finding skin-colored regions. Finding the moving objects. Intelligent scissors
 Segmentation I Goal Separate image into coherent regions Berkeley segmentation database: http://www.eecs.berkeley.edu/research/projects/cs/vision/grouping/segbench/ Slide by L. Lazebnik Applications Intelligent
Adaptive Learning of an Accurate Skin-Color Model
 Adaptive Learning of an Accurate Skin-Color Model Q. Zhu K.T. Cheng C. T. Wu Y. L. Wu Electrical & Computer Engineering University of California, Santa Barbara Presented by: H.T Wang Outline Generic Skin
ELEC Dr Reji Mathew Electrical Engineering UNSW
 ELEC 4622 Dr Reji Mathew Electrical Engineering UNSW Review of Motion Modelling and Estimation Introduction to Motion Modelling & Estimation Forward Motion Backward Motion Block Motion Estimation Motion
Mesh Decimation. Mark Pauly
 Mesh Decimation Mark Pauly Applications Oversampled 3D scan data ~150k triangles ~80k triangles Mark Pauly - ETH Zurich 280 Applications Overtessellation: E.g. iso-surface extraction Mark Pauly - ETH Zurich
Texture. Frequency Descriptors. Frequency Descriptors. Frequency Descriptors. Frequency Descriptors. Frequency Descriptors
 Texture The most fundamental question is: How can we measure texture, i.e., how can we quantitatively distinguish between different textures? Of course it is not enough to look at the intensity of individual
TransGraph: Hierarchical Exploration of Transition Relationships in Time-Varying Volumetric Data
 TransGraph: Hierarchical Exploration of Transition Relationships in Time-Varying Volumetric Data Yi Gu and Chaoli Wang, Member, IEEE (e) (d) (e) (d) (f) (f) Fig. 1. Left: the TransGraph of the earthquake
Image Processing. Image Features
 Image Processing Image Features Preliminaries 2 What are Image Features? Anything. What they are used for? Some statements about image fragments (patches) recognition Search for similar patches matching
Introduction to Medical Imaging (5XSA0) Module 5
 Module 5") Introduction to Medical Imaging (5XSA0) Module 5 Segmentation Jungong Han, Dirk Farin, Sveta Zinger ( s.zinger@tue.nl ) 1 Outline Introduction Color Segmentation region-growing region-merging watershed
Introduction to Medical Imaging (5XSA0) Module 5 Segmentation Jungong Han, Dirk Farin, Sveta Zinger ( s.zinger@tue.nl ) 1 Outline Introduction Color Segmentation region-growing region-merging watershed
DIGITAL IMAGE ANALYSIS. Image Classification: Object-based Classification
 DIGITAL IMAGE ANALYSIS Image Classification: Object-based Classification Image classification Quantitative analysis used to automate the identification of features Spectral pattern recognition Unsupervised
Region-based Segmentation
 Region-based Segmentation Image Segmentation Group similar components (such as, pixels in an image, image frames in a video) to obtain a compact representation. Applications: Finding tumors, veins, etc.
Applications. Oversampled 3D scan data. ~150k triangles ~80k triangles
 Mesh Simplification Applications Oversampled 3D scan data ~150k triangles ~80k triangles 2 Applications Overtessellation: E.g. iso-surface extraction 3 Applications Multi-resolution hierarchies for efficient
RINGS : A Technique for Visualizing Large Hierarchies
 RINGS : A Technique for Visualizing Large Hierarchies Soon Tee Teoh and Kwan-Liu Ma Computer Science Department, University of California, Davis {teoh, ma}@cs.ucdavis.edu Abstract. We present RINGS, a
Deep Learning For Video Classification. Presented by Natalie Carlebach & Gil Sharon
 Deep Learning For Video Classification Presented by Natalie Carlebach & Gil Sharon Overview Of Presentation Motivation Challenges of video classification Common datasets 4 different methods presented in
Isosurface Visualization of Data with Nonparametric Models for Uncertainty
 Isosurface Visualization of Data with Nonparametric Models for Uncertainty Tushar Athawale, Elham Sakhaee, and Alireza Entezari Department of Computer & Information Science & Engineering University of
Segmenting an Image Assigning labels to pixels (cat, ball, floor) Point processing: Lecture 3: Region Based Vision. Overview
 Point processing: Lecture 3: Region Based Vision. Overview") Slide 2 Lecture 3: Region Based Vision Dr Carole Twining Thursday 18th March 1:00pm 1:50pm Segmenting an Image Assigning labels to pixels (cat, ball, floor) Point processing: colour or grayscale values,
Slide 2 Lecture 3: Region Based Vision Dr Carole Twining Thursday 18th March 1:00pm 1:50pm Segmenting an Image Assigning labels to pixels (cat, ball, floor) Point processing: colour or grayscale values,
Representing Moving Images with Layers. J. Y. Wang and E. H. Adelson MIT Media Lab
 Representing Moving Images with Layers J. Y. Wang and E. H. Adelson MIT Media Lab Goal Represent moving images with sets of overlapping layers Layers are ordered in depth and occlude each other Velocity
Image Segmentation. Ross Whitaker SCI Institute, School of Computing University of Utah
 Image Segmentation Ross Whitaker SCI Institute, School of Computing University of Utah What is Segmentation? Partitioning images/volumes into meaningful pieces Partitioning problem Labels Isolating a specific
Announcements. Recognition I. Gradient Space (p,q) What is the reflectance map?
 What is the reflectance map?") Announcements I HW 3 due 12 noon, tomorrow. HW 4 to be posted soon recognition Lecture plan recognition for next two lectures, then video and motion. Introduction to Computer Vision CSE 152 Lecture 17
Announcements I HW 3 due 12 noon, tomorrow. HW 4 to be posted soon recognition Lecture plan recognition for next two lectures, then video and motion. Introduction to Computer Vision CSE 152 Lecture 17
Feature Selection for fmri Classification
 Feature Selection for fmri Classification Chuang Wu Program of Computational Biology Carnegie Mellon University Pittsburgh, PA 15213 chuangw@andrew.cmu.edu Abstract The functional Magnetic Resonance Imaging
Supervised texture detection in images
 Supervised texture detection in images Branislav Mičušík and Allan Hanbury Pattern Recognition and Image Processing Group, Institute of Computer Aided Automation, Vienna University of Technology Favoritenstraße
(Refer Slide Time: 0:51)
") Introduction to Remote Sensing Dr. Arun K Saraf Department of Earth Sciences Indian Institute of Technology Roorkee Lecture 16 Image Classification Techniques Hello everyone welcome to 16th lecture in
Introduction to Remote Sensing Dr. Arun K Saraf Department of Earth Sciences Indian Institute of Technology Roorkee Lecture 16 Image Classification Techniques Hello everyone welcome to 16th lecture in
Feature Descriptors. CS 510 Lecture #21 April 29 th, 2013
 Feature Descriptors CS 510 Lecture #21 April 29 th, 2013 Programming Assignment #4 Due two weeks from today Any questions? How is it going? Where are we? We have two umbrella schemes for object recognition
Perception-Based Transfer Function Design
 Perception-Based Transfer Function Design Huamin Qu Department of Computer Science and Engineering The Hong Kong University of Science and Technology Outline Introduction Transfer Function Design Based
EE795: Computer Vision and Intelligent Systems
 EE795: Computer Vision and Intelligent Systems Spring 2012 TTh 17:30-18:45 WRI C225 Lecture 04 130131 http://www.ee.unlv.edu/~b1morris/ecg795/ 2 Outline Review Histogram Equalization Image Filtering Linear
The goals of segmentation
 Image segmentation The goals of segmentation Group together similar-looking pixels for efficiency of further processing Bottom-up process Unsupervised superpixels X. Ren and J. Malik. Learning a classification
Learning and Inferring Depth from Monocular Images. Jiyan Pan April 1, 2009
 Learning and Inferring Depth from Monocular Images Jiyan Pan April 1, 2009 Traditional ways of inferring depth Binocular disparity Structure from motion Defocus Given a single monocular image, how to infer
K-Means Clustering 3/3/17
 K-Means Clustering 3/3/17 Unsupervised Learning We have a collection of unlabeled data points. We want to find underlying structure in the data. Examples: Identify groups of similar data points. Clustering
A Singular Example for the Averaged Mean Curvature Flow
 To appear in Experimental Mathematics Preprint Vol. No. () pp. 3 7 February 9, A Singular Example for the Averaged Mean Curvature Flow Uwe F. Mayer Abstract An embedded curve is presented which under numerical
CMPSCI 670: Computer Vision! Grouping
 CMPSCI 670: Computer Vision! Grouping University of Massachusetts, Amherst October 14, 2014 Instructor: Subhransu Maji Slides credit: Kristen Grauman and others Final project guidelines posted Milestones
5. Feature Extraction from Images
 5. Feature Extraction from Images Aim of this Chapter: Learn the Basic Feature Extraction Methods for Images Main features: Color Texture Edges Wie funktioniert ein Mustererkennungssystem Test Data x i
Texture Image Segmentation using FCM
 Proceedings of 2012 4th International Conference on Machine Learning and Computing IPCSIT vol. 25 (2012) (2012) IACSIT Press, Singapore Texture Image Segmentation using FCM Kanchan S. Deshmukh + M.G.M
Spectral Classification
 Spectral Classification Spectral Classification Supervised versus Unsupervised Classification n Unsupervised Classes are determined by the computer. Also referred to as clustering n Supervised Classes
Geometric Modeling. Mesh Decimation. Mesh Decimation. Applications. Copyright 2010 Gotsman, Pauly Page 1. Oversampled 3D scan data
 Applications Oversampled 3D scan data ~150k triangles ~80k triangles 2 Copyright 2010 Gotsman, Pauly Page 1 Applications Overtessellation: E.g. iso-surface extraction 3 Applications Multi-resolution hierarchies
Nonparametric Clustering of High Dimensional Data
 Nonparametric Clustering of High Dimensional Data Peter Meer Electrical and Computer Engineering Department Rutgers University Joint work with Bogdan Georgescu and Ilan Shimshoni Robust Parameter Estimation:
Region-based Segmentation and Object Detection
 Region-based Segmentation and Object Detection Stephen Gould Tianshi Gao Daphne Koller Presented at NIPS 2009 Discussion and Slides by Eric Wang April 23, 2010 Outline Introduction Model Overview Model
Approximation Algorithms for Clustering Uncertain Data
 Approximation Algorithms for Clustering Uncertain Data Graham Cormode AT&T Labs - Research graham@research.att.com Andrew McGregor UCSD / MSR / UMass Amherst andrewm@ucsd.edu Introduction Many applications
A Fast Distance Between Histograms
 Fast Distance Between Histograms Francesc Serratosa 1 and lberto Sanfeliu 2 1 Universitat Rovira I Virgili, Dept. d Enginyeria Informàtica i Matemàtiques, Spain francesc.serratosa@.urv.net 2 Universitat
Clustering & Classification (chapter 15)
") Clustering & Classification (chapter 5) Kai Goebel Bill Cheetham RPI/GE Global Research goebel@cs.rpi.edu cheetham@cs.rpi.edu Outline k-means Fuzzy c-means Mountain Clustering knn Fuzzy knn Hierarchical
Clustering & Classification (chapter 5) Kai Goebel Bill Cheetham RPI/GE Global Research goebel@cs.rpi.edu cheetham@cs.rpi.edu Outline k-means Fuzzy c-means Mountain Clustering knn Fuzzy knn Hierarchical
Table of Contents (As covered from textbook)
") Table of Contents (As covered from textbook) Ch 1 Data and Decisions Ch 2 Displaying and Describing Categorical Data Ch 3 Displaying and Describing Quantitative Data Ch 4 Correlation and Linear Regression
Table of Contents (As covered from textbook) Ch 1 Data and Decisions Ch 2 Displaying and Describing Categorical Data Ch 3 Displaying and Describing Quantitative Data Ch 4 Correlation and Linear Regression
Image Transformation Techniques Dr. Rajeev Srivastava Dept. of Computer Engineering, ITBHU, Varanasi
 Image Transformation Techniques Dr. Rajeev Srivastava Dept. of Computer Engineering, ITBHU, Varanasi 1. Introduction The choice of a particular transform in a given application depends on the amount of
Visualisation of uncertainty. Kai-Mikael Jää-Aro
 Visualisation of uncertainty Kai-Mikael Jää-Aro Why is this important? Visualising uncertainty Means and Methods Scalar data Vector data Volume data Generic methods Let us talk about the weather A weather
Types of image feature and segmentation
 COMP3204/COMP6223: Computer Vision Types of image feature and segmentation Jonathon Hare jsh2@ecs.soton.ac.uk Image Feature Morphology Recap: Feature Extractors image goes in Feature Extractor featurevector(s)
Segmentation and Grouping
 02/23/10 Segmentation and Grouping Computer Vision CS 543 / ECE 549 University of Illinois Derek Hoiem Last week Clustering EM Today s class More on EM Segmentation and grouping Gestalt cues By boundaries
Intelligent Robotics
 64-424 Intelligent Robotics 64-424 Intelligent Robotics http://tams.informatik.uni-hamburg.de/ lectures/2013ws/vorlesung/ir Jianwei Zhang / Eugen Richter Faculty of Mathematics, Informatics and Natural
3. Data Structures for Image Analysis L AK S H M O U. E D U
 3. Data Structures for Image Analysis L AK S H M AN @ O U. E D U Different formulations Can be advantageous to treat a spatial grid as a: Levelset Matrix Markov chain Topographic map Relational structure
University of Florida CISE department Gator Engineering. Clustering Part 4
 Clustering Part 4 Dr. Sanjay Ranka Professor Computer and Information Science and Engineering University of Florida, Gainesville DBSCAN DBSCAN is a density based clustering algorithm Density = number of
Wavelet Applications. Texture analysis&synthesis. Gloria Menegaz 1
 Wavelet Applications Texture analysis&synthesis Gloria Menegaz 1 Wavelet based IP Compression and Coding The good approximation properties of wavelets allow to represent reasonably smooth signals with
Vector Visualization
 Vector Visualization Vector Visulization Divergence and Vorticity Vector Glyphs Vector Color Coding Displacement Plots Stream Objects Texture-Based Vector Visualization Simplified Representation of Vector
10601 Machine Learning. Hierarchical clustering. Reading: Bishop: 9-9.2
 161 Machine Learning Hierarchical clustering Reading: Bishop: 9-9.2 Second half: Overview Clustering - Hierarchical, semi-supervised learning Graphical models - Bayesian networks, HMMs, Reasoning under
Clustering Color/Intensity. Group together pixels of similar color/intensity.
 Clustering Color/Intensity Group together pixels of similar color/intensity. Agglomerative Clustering Cluster = connected pixels with similar color. Optimal decomposition may be hard. For example, find
GPU-based Volume Rendering. Michal Červeňanský
 GPU-based Volume Rendering Michal Červeňanský Outline Volume Data Volume Rendering GPU rendering Classification Speed-up techniques Other techniques 2 Volume Data Describe interior structures Liquids,
Mining Data Streams. Outline [Garofalakis, Gehrke & Rastogi 2002] Introduction. Summarization Methods. Clustering Data Streams
![Mining Data Streams. Outline [Garofalakis, Gehrke & Rastogi 2002] Introduction. Summarization Methods. Clustering Data Streams](/thumbs/85/93020188.jpg "Mining Data Streams. Outline [Garofalakis, Gehrke & Rastogi 2002] Introduction. Summarization Methods. Clustering Data Streams") Mining Data Streams Outline [Garofalakis, Gehrke & Rastogi 2002] Introduction Summarization Methods Clustering Data Streams Data Stream Classification Temporal Models CMPT 843, SFU, Martin Ester, 1-06
Mining Data Streams Outline [Garofalakis, Gehrke & Rastogi 2002] Introduction Summarization Methods Clustering Data Streams Data Stream Classification Temporal Models CMPT 843, SFU, Martin Ester, 1-06
ECG782: Multidimensional Digital Signal Processing
 Professor Brendan Morris, SEB 3216, brendan.morris@unlv.edu ECG782: Multidimensional Digital Signal Processing Spatial Domain Filtering http://www.ee.unlv.edu/~b1morris/ecg782/ 2 Outline Background Intensity
Announcements. Recognition. Recognition. Recognition. Recognition. Homework 3 is due May 18, 11:59 PM Reading: Computer Vision I CSE 152 Lecture 14
 Announcements Computer Vision I CSE 152 Lecture 14 Homework 3 is due May 18, 11:59 PM Reading: Chapter 15: Learning to Classify Chapter 16: Classifying Images Chapter 17: Detecting Objects in Images Given
10701 Machine Learning. Clustering
 171 Machine Learning Clustering What is Clustering? Organizing data into clusters such that there is high intra-cluster similarity low inter-cluster similarity Informally, finding natural groupings among
Clustering Part 4 DBSCAN
 Clustering Part 4 Dr. Sanjay Ranka Professor Computer and Information Science and Engineering University of Florida, Gainesville DBSCAN DBSCAN is a density based clustering algorithm Density = number of
Kapitel 4: Clustering
 Ludwig-Maximilians-Universität München Institut für Informatik Lehr- und Forschungseinheit für Datenbanksysteme Knowledge Discovery in Databases WiSe 2017/18 Kapitel 4: Clustering Vorlesung: Prof. Dr.
Volume Illumination, Contouring
 Volume Illumination, Contouring Computer Animation and Visualisation Lecture 0 tkomura@inf.ed.ac.uk Institute for Perception, Action & Behaviour School of Informatics Contouring Scaler Data Overview -
Spectral Clustering. Presented by Eldad Rubinstein Based on a Tutorial by Ulrike von Luxburg TAU Big Data Processing Seminar December 14, 2014
 Spectral Clustering Presented by Eldad Rubinstein Based on a Tutorial by Ulrike von Luxburg TAU Big Data Processing Seminar December 14, 2014 What are we going to talk about? Introduction Clustering and
Display. Introduction page 67 2D Images page 68. All Orientations page 69 Single Image page 70 3D Images page 71
 Display Introduction page 67 2D Images page 68 All Orientations page 69 Single Image page 70 3D Images page 71 Intersecting Sections page 71 Cube Sections page 72 Render page 73 1. Tissue Maps page 77
CS 340 Lec. 4: K-Nearest Neighbors
 CS 340 Lec. 4: K-Nearest Neighbors AD January 2011 AD () CS 340 Lec. 4: K-Nearest Neighbors January 2011 1 / 23 K-Nearest Neighbors Introduction Choice of Metric Overfitting and Underfitting Selection
Visible and Long-Wave Infrared Image Fusion Schemes for Situational. Awareness
 Visible and Long-Wave Infrared Image Fusion Schemes for Situational Awareness Multi-Dimensional Digital Signal Processing Literature Survey Nathaniel Walker The University of Texas at Austin nathaniel.walker@baesystems.com
CS 4495 Computer Vision. Segmentation. Aaron Bobick (slides by Tucker Hermans) School of Interactive Computing. Segmentation
 School of Interactive Computing. Segmentation") CS 4495 Computer Vision Aaron Bobick (slides by Tucker Hermans) School of Interactive Computing Administrivia PS 4: Out but I was a bit late so due date pushed back to Oct 29. OpenCV now has real SIFT
CS 4495 Computer Vision Aaron Bobick (slides by Tucker Hermans) School of Interactive Computing Administrivia PS 4: Out but I was a bit late so due date pushed back to Oct 29. OpenCV now has real SIFT
2 OVERVIEW OF RELATED WORK
 Utsushi SAKAI Jun OGATA This paper presents a pedestrian detection system based on the fusion of sensors for LIDAR and convolutional neural network based image classification. By using LIDAR our method
PowerVR Hardware. Architecture Overview for Developers
 Public Imagination Technologies PowerVR Hardware Public. This publication contains proprietary information which is subject to change without notice and is supplied 'as is' without warranty of any kind.
Application of fuzzy set theory in image analysis. Nataša Sladoje Centre for Image Analysis
 Application of fuzzy set theory in image analysis Nataša Sladoje Centre for Image Analysis Our topics for today Crisp vs fuzzy Fuzzy sets and fuzzy membership functions Fuzzy set operators Approximate
Scalable Software Components for Ultrascale Visualization Applications
 Scalable Software Components for Ultrascale Visualization Applications Wes Kendall, Tom Peterka, Jian Huang SC Ultrascale Visualization Workshop 2010 11-15-2010 Primary Collaborators Jian Huang Tom Peterka
Visualization Computer Graphics I Lecture 20
 15-462 Computer Graphics I Lecture 20 Visualization Height Fields and Contours Scalar Fields Volume Rendering Vector Fields [Angel Ch. 12] April 15, 2003 Frank Pfenning Carnegie Mellon University http://www.cs.cmu.edu/~fp/courses/graphics/
Case-Based Reasoning. CS 188: Artificial Intelligence Fall Nearest-Neighbor Classification. Parametric / Non-parametric.
 CS 188: Artificial Intelligence Fall 2008 Lecture 25: Kernels and Clustering 12/2/2008 Dan Klein UC Berkeley Case-Based Reasoning Similarity for classification Case-based reasoning Predict an instance
CS 188: Artificial Intelligence Fall 2008
 CS 188: Artificial Intelligence Fall 2008 Lecture 25: Kernels and Clustering 12/2/2008 Dan Klein UC Berkeley 1 1 Case-Based Reasoning Similarity for classification Case-based reasoning Predict an instance
A Content Based Image Retrieval System Based on Color Features
 A Content Based Image Retrieval System Based on Features Irena Valova, University of Rousse Angel Kanchev, Department of Computer Systems and Technologies, Rousse, Bulgaria, Irena@ecs.ru.acad.bg Boris
ECG782: Multidimensional Digital Signal Processing
 Professor Brendan Morris, SEB 3216, brendan.morris@unlv.edu ECG782: Multidimensional Digital Signal Processing Spring 2014 TTh 14:30-15:45 CBC C313 Lecture 10 Segmentation 14/02/27 http://www.ee.unlv.edu/~b1morris/ecg782/
CS448f: Image Processing For Photography and Vision. Fast Filtering
 CS448f: Image Processing For Photography and Vision Fast Filtering Problems in Computer Vision Computer Vision in One Slide 1) Extract some features from some images 2) Use these to formulate some (hopefully
3D from Photographs: Automatic Matching of Images. Dr Francesco Banterle
 3D from Photographs: Automatic Matching of Images Dr Francesco Banterle francesco.banterle@isti.cnr.it 3D from Photographs Automatic Matching of Images Camera Calibration Photographs Surface Reconstruction
Non-Parametric Modeling
 Non-Parametric Modeling CE-725: Statistical Pattern Recognition Sharif University of Technology Spring 2013 Soleymani Outline Introduction Non-Parametric Density Estimation Parzen Windows Kn-Nearest Neighbor
What to come. There will be a few more topics we will cover on supervised learning
 Summary so far Supervised learning learn to predict Continuous target regression; Categorical target classification Linear Regression Classification Discriminative models Perceptron (linear) Logistic regression
EECS 556 Image Processing W 09. Image enhancement. Smoothing and noise removal Sharpening filters
 EECS 556 Image Processing W 09 Image enhancement Smoothing and noise removal Sharpening filters What is image processing? Image processing is the application of 2D signal processing methods to images Image
Chapter 7 UNSUPERVISED LEARNING TECHNIQUES FOR MAMMOGRAM CLASSIFICATION
 UNSUPERVISED LEARNING TECHNIQUES FOR MAMMOGRAM CLASSIFICATION Supervised and unsupervised learning are the two prominent machine learning algorithms used in pattern recognition and classification. In this
Spatial Outlier Detection
 Spatial Outlier Detection Chang-Tien Lu Department of Computer Science Northern Virginia Center Virginia Tech Joint work with Dechang Chen, Yufeng Kou, Jiang Zhao 1 Spatial Outlier A spatial data point
Data Mining and Analytics. Introduction
 Data Mining and Analytics Introduction Data Mining Data mining refers to extracting or mining knowledge from large amounts of data It is also termed as Knowledge Discovery from Data (KDD) Mostly, data
EE 701 ROBOT VISION. Segmentation
 EE 701 ROBOT VISION Regions and Image Segmentation Histogram-based Segmentation Automatic Thresholding K-means Clustering Spatial Coherence Merging and Splitting Graph Theoretic Segmentation Region Growing
Image Segmentation. Ross Whitaker SCI Institute, School of Computing University of Utah
 Image Segmentation Ross Whitaker SCI Institute, School of Computing University of Utah What is Segmentation? Partitioning images/volumes into meaningful pieces Partitioning problem Labels Isolating a specific
Importance-Driven Time-Varying Data Visualization
 Importance-Driven Time-Varying Data Visualization Chaoli Wang, Member, IEEE, Hongfeng Yu, and Kwan-Liu Ma, Senior Member, IEEE Abstract The ability to identify and present the most essential aspects of
Lecture: k-means & mean-shift clustering
 Lecture: k-means & mean-shift clustering Juan Carlos Niebles and Ranjay Krishna Stanford Vision and Learning Lab 1 Recap: Image Segmentation Goal: identify groups of pixels that go together 2 Recap: Gestalt
Clustering in Data Mining
 Clustering in Data Mining Classification Vs Clustering When the distribution is based on a single parameter and that parameter is known for each object, it is called classification. E.g. Children, young,
Grouping and Segmentation
 03/17/15 Grouping and Segmentation Computer Vision CS 543 / ECE 549 University of Illinois Derek Hoiem Today s class Segmentation and grouping Gestalt cues By clustering (mean-shift) By boundaries (watershed)
Image Processing. Bilkent University. CS554 Computer Vision Pinar Duygulu
 Image Processing CS 554 Computer Vision Pinar Duygulu Bilkent University Today Image Formation Point and Blob Processing Binary Image Processing Readings: Gonzalez & Woods, Ch. 3 Slides are adapted from
Outline. The History of Histograms. Yannis Ioannidis University of Athens, Hellas
 The History of Histograms Yannis Ioannidis University of Athens, Hellas Outline Prehistory Definitions and Framework The Early Past 10 Years Ago The Recent Past Industry Competitors The Future Prehistory
Norbert Schuff VA Medical Center and UCSF
 Norbert Schuff Medical Center and UCSF Norbert.schuff@ucsf.edu Medical Imaging Informatics N.Schuff Course # 170.03 Slide 1/67 Objective Learn the principle segmentation techniques Understand the role
Applied Bayesian Nonparametrics 5. Spatial Models via Gaussian Processes, not MRFs Tutorial at CVPR 2012 Erik Sudderth Brown University
 Applied Bayesian Nonparametrics 5. Spatial Models via Gaussian Processes, not MRFs Tutorial at CVPR 2012 Erik Sudderth Brown University NIPS 2008: E. Sudderth & M. Jordan, Shared Segmentation of Natural
CS 2750: Machine Learning. Clustering. Prof. Adriana Kovashka University of Pittsburgh January 17, 2017
 CS 2750: Machine Learning Clustering Prof. Adriana Kovashka University of Pittsburgh January 17, 2017 What is clustering? Grouping items that belong together (i.e. have similar features) Unsupervised:
Section 4 Matching Estimator
 Section 4 Matching Estimator Matching Estimators Key Idea: The matching method compares the outcomes of program participants with those of matched nonparticipants, where matches are chosen on the basis
Module 10 MULTIMEDIA SYNCHRONIZATION
 Module 10 MULTIMEDIA SYNCHRONIZATION Lesson 33 Basic definitions and requirements Instructional objectives At the end of this lesson, the students should be able to: 1. Define synchronization between media
Visualization Computer Graphics I Lecture 20
 15-462 Computer Graphics I Lecture 20 Visualization Height Fields and Contours Scalar Fields Volume Rendering Vector Fields [Angel Ch. 12] November 20, 2003 Doug James Carnegie Mellon University http://www.cs.cmu.edu/~djames/15-462/fall03
Machine learning approach to retrieving physical variables from remotely sensed data
 Machine learning approach to retrieving physical variables from remotely sensed data Fazlul Shahriar November 11, 2016 Introduction There is a growing wealth of remote sensing data from hundreds of space-based
Data Visualization. Fall 2016
 Data Visualization Fall 2016 Information Visualization Upon now, we dealt with scientific visualization (scivis) Scivisincludes visualization of physical simulations, engineering, medical imaging, Earth
Mirrored LH Histograms for the Visualization of Material Boundaries
 Mirrored LH Histograms for the Visualization of Material Boundaries Petr Šereda 1, Anna Vilanova 1 and Frans A. Gerritsen 1,2 1 Department of Biomedical Engineering, Technische Universiteit Eindhoven,
ShadowDraw Real-Time User Guidance for Freehand Drawing. Harshal Priyadarshi
 ShadowDraw Real-Time User Guidance for Freehand Drawing Harshal Priyadarshi Demo Components of Shadow-Draw Inverted File Structure for indexing Database of images Corresponding Edge maps Query method Dynamically
CS 664 Segmentation. Daniel Huttenlocher
 CS 664 Segmentation Daniel Huttenlocher Grouping Perceptual Organization Structural relationships between tokens Parallelism, symmetry, alignment Similarity of token properties Often strong psychophysical
Graph Matching Iris Image Blocks with Local Binary Pattern
 Graph Matching Iris Image Blocs with Local Binary Pattern Zhenan Sun, Tieniu Tan, and Xianchao Qiu Center for Biometrics and Security Research, National Laboratory of Pattern Recognition, Institute of