Generation of numerical human models based on medical imaging
|
|
|
- Dora Bryan
- 6 years ago
- Views:
Transcription


1 Generation of numerical human models based on medical imaging Research Report in Mechanical Engineering MARTA GONZALEZ CARCEDO KARIN BROLIN Department of Applied Mechanics Division of Vehicle Safety CHALMERS UNIVERSITY OF TECHNOLOGY Göteborg, Sweden 2012 Research Report 2012:01
2
3 RESEARCH REPORT 2012:01 Generation of numerical human models based on medical imaging MARTA GONZÁLEZ CARCE DO KARIN BROLIN Department of Applied Mechanics Division of Vehicle Safety CHALMERS UNIVERSITY OF TECHNOLOGY Göteborg, Sweden, 2012
4 Generation of numerical human models based on medical imaging. M A R T A G O N Z Á L E Z C A R C E DO K A R I N B R O L I N M A R T A G O N Z A L E Z C A R C E D O, K A R I N B R O L I N, 2012 Research report 2012:01 ISSN Department of Applied Mechanics Division of Vehicle Safety CHALMERS UNIVERSITY OF TECHNOLOGY SE Göteborg Sverige Telephone +46 (0) Cover: Generation of numerical human models based on medical imaging. Chalmers Reproservice Göteborg, Sweden 2012
5 Generation of numerical human models based on medical imaging Research Report in Mechanical Engineering MARTA GONZALEZ CARCEDO KARIN BROLIN Department of Applied Mechanics Division of Vehicle Safety Chalmers University of Technology ABSTRACT The aim of this project was to increase the knowledge of how numerical models can be generated based on medical imaging data. The software used was Scan IP+FE/+CAD (Simpleware Ltd, UK). Three studies were conducted to generate models for Computer Fluid Dynamics (CFD) and Finite Element (FE) analysis, focusing on the medical imaging process. The real geometry of an aorta with a stent graft was generated based on Computer Tomography (CT) images from two patients. Several meshes were generated, evaluated and exported to OpenFOAM for CFD analysis. It was possible to run the simulation. Two FE models of the cervical vertebrae were generated based on CT images of female necks. The mesh density needed to capture joint slope and other important features were investigated. Lastly, image processing of rat and monkey head, brain and neck was performed to extract anatomical details and compare brain size with specimen mass. This project was finalized with a workshop to spread the gained knowledge to the graduate students and researchers at the Department of Applied Mechanics of Chalmers, active in the field of human body modeling, and open to participants from partners of the SAFER - Vehicle and Traffic Safety Center- at Chalmers and the Strategic Area of Transport at Chalmers. Key words: Medical imaging, numerical models, meshing, aorta, cervical spine, animals models I
6 II
7 Contents ABSTRACT CONTENTS PREFACE TERMINOLOGY I III V VI 1 SCOPE OF THE PROJECT 1 2 METHOD Import and pre-processing data Segmentation Three Dimensional Analysis Surface extraction, meshing and exporting 3 3 AORTA PROJECT Background Work process Data Segmentation process Stent graft Segmentation process Noise Segmentation process - The aneurysm dilatation artery D Analysis Comparison of models Computational Fluid Dynamic mesh generation Extract geometry and do CFD meshing with other software Conclusion Future work 15 4 FEMALE NECK PROJECT Background Work process Data used Segmentation process D Analysis Comparison of models Comparing the angles of contacts surfaces Finite Element mesh generation Conclusion Future work 27 5 ANIMALS MODELS PROJECT 28 III
8 5.1 Rat project Background Work process Monkey project Background Work process Conclusion and future work 40 6 WORKSHOP Contents Initial presentation Hand-on exercise during the week Final presentation Hand-on Applications Active Human Body Models project: Applications for medical image processing Injury-HBM project Feedback What did you learn? Value of the workshop? Feedback on the program/planning Conclusions Lesson learned 48 7 REFERENCES 49 8 APPENDICES 50 IV
9 Preface This work was possible through funding from Chalmers Transport Area of Advance; project Humanmodellering för skadeprevention. This work was carried out at the SAFER -Vehicle and Traffic Safety Centre at Chalmers during three months in the fall of The project was initiated by the Human Body Modelling group at the Department of Applied Mechanics: Karin Brolin, Håkan Nilsson, Håkan Johansson, and Kenneth Runesson. This project, all the imaging work with the software and the documentation were carried out by Marta Gonzalez Carcedo under the supervision of Karin Brolin. Simpleware Ltd is acknowledged for their kind cooperation and support throughout this project and for supplying extra licenses for the workshop. It would not have been possible without you! The project would not have been successful without the active participation of Håkan Nilsson from Chalmers, Håkan Roos from Sahlgrenska University Hospital, Jacobo Antona Makoshi from JARI (Japan Automobile Research Institute) and Chalmers, and Ermes Tarallo from Politecnico di Milano. Göteborg December 2011 Marta González Carcedo and Karin Brolin. V
10 Terminology Variables that are occurring in this report: AHBM Active Human Body Model. Atlas First cervical vertebrae, C1. Axis Second cervical vertebrae C2. Background data To refer the image volume grey scale data. C1, C2 C7 Cervical vertebrae number 1, 2,,7. CAD Computer Aided Design. Cervical spine Superior region of the spine with 7 vertebrae. CFD Computational Fluid Dynamics. Cortical bone Compact bone at the surface of the vertebrae. CT Computed Tomography. DICOM Digital Imaging and Communication in Medicine. EVAR Endovascular Aortic Repair. FE Finite Element HU Hounsfiel Units. Intervertebral disc Soft tissue joint in the spine, connecting two adjacent vertebrae. MRI Magnetic Resonance Imaging. Occipitoatlantal joint Joint between the occiput and the first cervical vertebra, C1. T1 First thoracic vertebrae. Trabecular bone Porous bone in the centre of the vertebrae. 3D model Three Dimensional model VI
.")
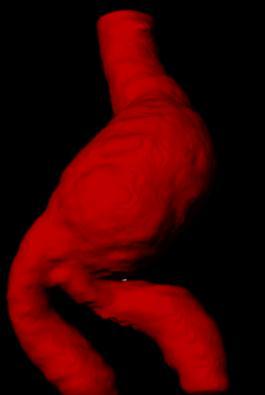
11 1 Scope of the project The aim of this project was to increase the knowledge of how numerical models can be generated based on medical imaging data. The used software was Scan IP+FE/+CADv4.3 (Simpleware Ltd, Exeter, UK). It included creating models for three applications: Aorta for Computational Fluid Dynamic (CFD) simulation of stent graft (see section 3), Female neck for Finite Element (FE) analysis (see section 4), and Different aspect of image processing of animals models (see section 5). The project was finalised with a workshop to spread the gained knowledge to the PhD students and researchers at the Department of Applied Mechanics, active in the field of human body modelling or with an interest in image processing (see section 6). Figure 1: Aorta with aneurysm and stent graft (left), female neck model (middle), and monkey and rat head and brain models (right). 1
 is a medical imaging method that can be employed to generate three dimensional geometries, based on a stack of images. The software ScanIP+FE/+CADv4.")
12 2 Method The aim of this project is to explore how numerical models can be generated based on medical imaging data. Computer Tomography (CT) is a medical imaging method that can be employed to generate three dimensional geometries, based on a stack of images. The software ScanIP+FE/+CADv4.3 (Simpleware Ltd, Exeter, UK) was used for the image processing and model generation. The method is based in four basic functions (Figure 2): - Importing and pre-processing data ( see section 2.1), - Segmentation (see section 2.2), - 3D Analysis (see section 2.3) and - Surface extraction, meshing and exporting data (see section 2.4). Figure 2: Scan to model 2.1 Import and pre-processing data The first step is to import data and prepare it. The images can be manipulated, through the process of windowing. It is possible to remove the noise through a filtering process. In addition, it adjusts the data so the size of the object is correct and/or reduces the amount of data to work with. 2.2 Segmentation Segmentation is the process of partitioning a digital image into multiple segments. Focus in the current project is on the process where the different organs and bones are identified in the slides. In a region of interest, the pixels are similar with respect to some characteristic, such as colour, intensity or texture. Based on this, the different regions are identified inside the image and the masks can be created. Some knowledge of the X-ray attenuation of normal structures is useful to assist interpretation of the images. The Hounsfield scale measures radio density. In air its value is HU (Hounsfield Units), in pure water it is 0 HU. The software offers semiautomatic segmentation tools based on different techniques, such as threshold or region-growing. In addition, it offers a wide range of filters for different applications. Incorrect use of the filter can cause loss of characteristics of the shape and size of model. The filters and the number of iterations depend on the data and the model that it is generated. 2
13 2.3 Three Dimensional Analysis In this step the 3D model can be analysed and different geometrical measures can be performed. 2.4 Surface extraction, meshing and exporting It is possible create a CAD surface, and CFD and FE models. The model is exported directly to several formats compliant to commercial software. It is possible export additional information together with the model, such as interface relationship, material properties, etc. Some tools require some expertise and practice in order to give satisfactory results. There could be many ways of getting the same results. The key is to find the quickest way and the experience will improve your efficiency! 3

14 3 Aorta Project This project was realized in cooperation with Håkan Nilsson from Chalmers and Håkan Roos from Sahlgrenska University Hospital. The main interest of this project is to extract the real geometry of a stent-graft to perform CFD analyses with the software OpenFOAM. 3.1 Background Abdominal aortic aneurysm is a dilatation of the abdominal aortic vessel. It occurs most often in individuals over 65 years of age and is more common among men and smokers. The classical treatment of the abdominal aortic aneurysm consists in an open operation to replace the affected vessel wall with prosthesis; this is a large operation with significant morbidity and mortality. Since mid 1990 s a minimally invasive technique is also available, a stent grafts is inserted in the aorta to prevent rupture.. This treatment is named Endovascular Aortic Repair (EVAR), see Figure 3. The stent graft is an artificial tube, composed of a special fabric supported by a rigid structure. The rigid structure is metallic, it is called the stent. Figure 3: Illustration of stent graft - EVAR treatment. (P. Andersson, J. Pilqvist, 2011) 3.2 Work process CT images of two patients were used to generate three dimensional CFD models of the stent. The data was provided by Sahlgrenska University Hospital of Göteborg, Sweden. The research started by importing the data of the patients to Simpleware ScanIP+FE. Using segmentation and model generation techniques it was possible to constructing a CFD model. Geometry of the aneurysm dilatation artery, the metal graft of the stent and the stent graft were extracted Data Data from two patients were used: Model A: CT-Scan from November 17 th, 2009 in DICOM format was used from the abdominal part of the aorta of a male. It included 394 images, the spacing between slices is 1.25 mm with a pixel spacing of 0.5 mm. Data from pelvis bone until first vertebrae lumbar, which include the abdominal part of the aorta, see Table 1. 4

15 Model B: CT-scan from September 5 th, 2011 in DICOM format was used from abdominal part of the aorta of a male. It included 349 images, the spacing between slices is 1.60 mm with a pixel spacing of 0.7 mm. Data from third thoracic vertebrae until the pelvis bone, including thoracic and abdominal aorta, see Table 1. Table 1: Specification of image data. Data from Data type Gender Age (Y) Series no Images Pixel spacing (mm) Spacing between slices (mm) Model A CT Male Model B CT Male Segmentation process Stent graft The stent graft is an artificial tube, composed of a special fabric supported by a rigid structure. The rigid structure is metallic and has a high density in comparison to the rest of the soft tissues, which makes the identification process easier. Figure 4 shows a CT scan taken around the thoracic level, where the aorta is situated between the lungs. The spine and the ribs can be easily identified, in the same way that the metallic parts of the stent graft. In the center of the image the circular geometry with bright color is the metallic parts of the stent graft. The stent has a very thin layer of fiber that is just inside the metal, but it is not possible to see in these images. A radiopaque contrast liquid is injected into the blood for easier visualization of the vessel lumen. The 2D image data gives a lot of information, and the three dimensional models is predicted with the 2D cross sections. In Figure 4 the stent graft shows a circular cross section, in contrast to Figure 5 that shows a more oval shape. It is caused by the direction of the scanner that is not perpendicular to the cross section of the stent in that area. Figure 4: CT image from the Stent graft thoracic-abdominal part. Figure 5: CT image from the Stent graft thoracic-abdominal part Two regions were defined in the stent graft: the fluid and the solid region see Figure 6. The fluid is assumed to be inside the stent. The solid region is assumed as a thin layer on the inside of the stent. In this project the main interest is generation of a mesh for the fluid region and assumes that the solid region is stiff. So, the boundary conditions for the fluid region can be set at the border of that region. 5


16 Confidence connected region growing segmentation techniques was used to extract the geometry of the fluid region. Then, filters to fill cavity and avoid holes were applied. 3D editing tools were using to delete another vessels and smooth specific regions. Using Boolean operation, an additional layer that surround the fluid region is created for the solid region. Flat surface in the boundary were generate by cutting the image in the boundary patches and sharp edges were obtained, see Figure 7. Figure 6: Solid and fluid region of the stent graft Figure 7: boundary patches it is necessary patches with sharp edges perpendicular to the vanes Figure 8: CT image where it is possible to see the high density area of the stent graft. Figure 9: Diference of diameter in one of the legs. Figure 10: Metal graft of the stent. Metal graft of the stent with high density can easily be identified in the images. Using threshold segmentation techniques the geometry is extracted. Manual tools are necessary to reconstruction the parts where metal artifacts disturb the image data. This can be seen in the upper part of the one of the legs, see Figure 8 and a change of the diameter is identified Figure 9. It is due to a smaller diameter of the stentgraft at the overlap between two stentgrafts. The thinner leg has a standard diameter and the extension is chosen depending on the width of the artery, see Figure 10. The CAD surface of the metal graft of the stent was extracted to analysis its geometry Segmentation process Noise The data shows some noise in different part caused by the metallic part of the stent graft. The presence of metal objects in the scan leads to reflections in the image and hides the geometry of these parts. This is called metal artifacts, it shown in Figure 11. The parts affected by this phenomenon need to be reconstructed. Noise filters are available to reduce the metal artifact or manual tools can be used. In this project, manual tools were used to reconstruct the geometry. The geometry in these areas was created, basing on the interpolation between neighboring cross sections without the metal artifact. 6


17 Figure 11: Metal arifacts in CT image Segmentation process - The aneurysm dilatation artery Using flood fill and morphological filter, the geometry of the aneurysm dilatation artery was extracted. In the aneurysm dilatation the geometry is well defined, Figure 12. But in the other parts, the layer of the artery is close to the stent, Figure 13. The metal parts hide the geometry of the artery in this region and make it hard to follow the geometry. In these areas the outer boundary of the geometry needs to be assumed. Figure 12: Aneurysm dilatation artery in CT image Figure 13: artery and stent graft in CT image Figure 14: 3D Model of the aneurysm dilatation based on CT data ModelB. The Figure 15 shows the histogram of the background of data from Model A. It shows the number of pixels with different intensity. The histogram allows seeing the frequency of the grey scale value belonging to the images. This is useful to analysis the peaks and valleys in the histogram and it is used to locate the clusters in the image. Based in the histogram and using threshold methods, the different regions can be defined. The stent fluid region can be defined from 250 to 400 in the grey scale. The metallic parts show high values from 400 to 800 in the grey scale and the aneurysm dilatation is in the range from 0 to 200 in the grey scale. 7

18 Figure 15: Histogram background CT data from Model A D Analysis Comparison of models The geometry of the aneurysm dilatation and the stent graft was extracted for both models. Figure 16 shows a view of the aneurysm dilatation model and the stent graft based on CT data images from Model A. Figure 17 shows a view of the aneurysm dilatation model and the stent graft based on CT data images from Model B. A visual three dimensional comparison can be performed. The models has, in the fluid region, different geometry where Model B is very twisted, see Figure 17. In Model A, one of the legs has a change of the diameter. It is because the long leg is generally made with a width that corresponds to the vessel and can therefore have different dimensions. The short leg is in this case 12 mm in diameter and the long contralateral leg is 16 mm in diameter see Figure 18. A high density of metallic is showed in this area that the diameter changes. It is due the contralateral leg is inserted in the leg. The geometry of the metal graft of the stent in this area is difficult to extract. In Model B, the difference between diameters is showed in the region after the aneurysm dilatation, see Figure 19. Where the aneurysm is dividing in two legs, there is a reduction in the diameter and later the diameter is increased. The aneurysm dilatation 3D models are shown in Figure 20 for Model A and in Figure 21 for Model B. Model A has a larger diameter compared to the other. The model A (Figure 20) shows a diameter ten times smaller than the other. The aneurysm dilatation based in Model A is 63 mm. while in Model B it is 73 mm. 8


19 Figure 16: 3D Model of the aneurysm dilatation and the stent graft based on CT data Model A Figure 17: 3D Model of the aneurysm dilatation and the stent graft based on CT data Model B Figure 18: 3D Model of the stent based on CT data Model A. There is a change in the diameter in one of the legs. Figure 19: 3D Model of the stent based on CT data Model B. The change of the diameter after the dilatation is shown. Figure 20: 3D Model of the aneurysm dilatation and based on CT data Model A. Figure 21: : 3D Model of the aneurysm dilatation based on CT data Model B. 9
20 3.2.6 Computational Fluid Dynamic mesh generation The main interest of this project is the mesh of the fluid region. The CFD mesh was generated with ScanIP+FE and exported to OpenFOAM through the Fluent format, then an OpenFOAM utility is used to convert the mesh to OpenFOAM format (fluentmeshtofoam). The CFD mesh of the fluid and the solid region and the aneurysm dilatation without the stent were generated for both models. The CAD surface from the aneurysm dilatation artery was exported as STL format for both models and the metal graft of the stent for Model A. The geometry of the stent was extracted and the CFD mesh generate with ScanIP+FE. Two different meshes were generated: fluid and solid mesh based in the two regions in Figure 22. In the mesh of the fluid region the interior is less important so it can have a coarse mesh, Figure 23. Instead, close to the boundary it is very important to have boundary layers of cells with a high number of elements. Based on this, the mesh of this region is defined with coarse mesh in the interior and refined close to the boundaries, having a smaller length edge close to the boundary, as in the mesh Figure 24. Of course, this will increase the total number of cells. Another possibility is to generate a boundary layer with small cells, as in the model Figure 25. This option increases considerably the number of cells. In the solid region, there can be a high number of cells. Figure 26 shows the mesh of the solid region. If the mesh is refined in this region it is possible create cells with small length edge, see the Figure 27. These tetrahedral meshes were created with ScanIP+FE. It is possible to import to OpenFOAM and run a simulation. A CFD mesh of the fluid region from data ModelA was generated. The mesh was created with tetrahedrons and defined with coarse mesh in the interior and refined close to the boundary, but with low number of elements, similar too Figure 23. It was exported with 31,555 cells and the target minimum edge length of 2 mm. and a maximum length of 5 mm. The material was defined as a fluid. Four boundaries condition are included: fluid region to background, fluid region, fluid region to Zmin, and fluid region to Zmax, see Figure 28. The mesh was imported directly from ScanIP+FE and it was run in OpenFOAM. The mesh is exported in millimeters. Steady flow was realized, the Figure 29 shows the image of a steady flow of the fluid region of the stent graft in the aortic aneurysm. In addition, another CFD mesh from the same model, the fluid region of Model A was extracted. It was generated mixing hexahedral and tetrahedral but it was not possible to import into OpenFOAM. 10


21 Figure 22: The fluid and the solid mesh of the stent are shown. Fluid Mesh Figure 23: Fluid region with coarse interior mesh. Figure 24: Fluid region with coarse interior mesh and refine in close to the boundary. Figure 25: Fluid region with coarse interior mesh and refine a boundary layer of cells. Solid Mesh Figure 26: Solid region mesh. Figure 27: Solid region mesh is refined. Figure 28: boundary conditions are defined. Figure 29: Steady flow in stent graft in an aortic aneurysm 11
22 After the research to know that it was possible to import directly and run a simulation. The tetrahedral CFD mesh from the stent fluid region and aneurysm aortic dilatation was extracted from both models. In addition the CAD surface in STL format from the metallic stent was exported. In the pre-processing process smoothing was applied and the boundary conditions were defined. The models were exported to the CFD format for the software Fluent. CFD mesh and STL of the aneurysm aortic dilatation from Model B was exported with nodes and tetrahedral cells; Boundary conditions defined: From aneurysm to background, aneurysm, from aneurysm to Zmin, from aneurysm to Zmax; Figure 30. CFD mesh and STL of the Stent Fluid region from Model B was exported with nodes and tetrahedral cells. Boundary conditions defined: From Fluid to background, Fluid, from Fluid to Zmin, from Fluid to Zmax; Figure 31. CFD mesh and STL of the aneurysm aortic dilatation from Model A was exported with nodes and tetrahedral cells; Boundary conditions defined: From aneurysm to background, aneurysm, from aneurysm to Zmin, from aneurysm to Zmax; Figure 33. CFD mesh and STL of the Stent Fluid region from Model A: model export to fluent volume with nodes, tetrahedral cells. Faces: From Fluid to background, Fluid, from Fluid to Zmin, from Fluid to Zmax; Figure 34. CAD surface in STL format of the Metallic stent from Model A were exported with target minimum edge length 1 mm. and maximum 3 mm. Figure 35. In the pre-processing smoothing was applied and the boundary conditions were defined. The cross section of the inlets and outlets where define in the same place for the stent and in the aneurysm aortic dilatation, see Figure 32 and Figure 35. The models were exported to CFD fluent format. 12


23 Figure 30: CFD Model of the aneurysm dilatation based on CT data Model B Figure 31: CFD Model of the stent graft based on CT data Model B Figure 32: CFD Model of the aneurysm dilatation and the stent graft based on CT data Model B Figure 33: CFD Model of the aneurysm dilatation based on CT data Model A Figure 34: CFD Model of the stent graft on CT data Model A Figure 35: CFD Model of the aneurysm dilatation and the stent graft based on CT data Model A Extract geometry and do CFD meshing with other software In this project, the possibility of combining different software was explored. So the geometry is extracted base from the image processing method using ScanIP+FE. Then, the CAD surface from the model was exported in STL file format, which was used to generate a mesh with software ICEM CFD. The mesh generation process was realized by Håkan Nilsson and the model meshing is showed Figure 36. The mesh can be generated with hexahedral cells. For this geometry the mesh generated with ICEM CFD shows easier control and more flexibility of the mesh. 13


24 Figure 36: Geometry was extracted with Simpleware by Marta Gonzalez Carcedo and mesh was generated with ICEM CFD by Håkan Nilsson. 3.3 Conclusion Two models were extracted from data of two different patients. The geometry of the aneurysmal dilatation of the artery, the metal graft of the stent and the stent graft were extracted. A three dimensional analysis was performed. The quality of CT data from Model B is not enough to extract the geometry of the metallic parts. The spacing of the image needs to be smaller to follow the geometry, and reconstructing the geometry lot of manual work is required. Instead, in Model A, the geometry was extracted with a high detail. From the image in 2D can be extracted a lot of information about the model. The stent has a very thin layer that is just inside the metal, but it is not possible to see in the image. It is assumed the solid region base in the fluid region extracting a thin layer. So it is possible to obtain a separate thin wall around the fluid section to generate a solid mesh. But there is a limitation of definition of the thickness of this layer. The metallic parts of the stent graft can be easily identified, but to extract the geometry require some manual work. In addition, the geometry in the areas with high density of metal graft or overlapping of the metal wires makes it difficult to follow the geometry. It is possible to generate CFD boundary conditions in the mesh. For generation of the boundary patches it is necessary to have patches with sharp edges perpendicular to the aorta. One of the ways to keep a flat surface is cropping the image to the point on the masks where you would like the flat surface to be. However sometimes this is not possible because the geometry and may require cuts in arbitrary directions. In this case, another mask is necessary to create in where you would like the flat surface to be. In this case you can get a flat surface but the edges of the patches are not sharp. The areas with metal artifacts hide information, so if it is possible it should be avoided during scanning. The image needs to be reconstructed in these areas. ScanIP+FE has available a noise filtering of metal artifact reduction that attempts to reduce streaking artifacts caused by metallic objects in a CT scan. The purpose of the filter is to 14


25 enhance the high frequencies which correspond to the image edges. This filter is very useful but consumes a lot of time. It is flexible to extract measures and analyze the model in 3D. The process of the CFD mesh generation, it is very useful to extract the real geometry based on data from the scan. It can be meshed with ScanIP+FE directly with some flexibility to create the mesh but also it has some limitations: It is not possible generate a hexahedral mesh. The mesh was generated with tetrahedral. There is another algorithm where it is possible to generate the mesh mixing tetrahedral and hexahedral but this mesh was not possible import into OpenFOAM. The hexahedral is often generated in the center and the edges are tetrahedral, but in this case it would be more interesting to the have hexahedral mesh at the edges. So this solution does not help in this case. It is possible have a coarse mesh in the interior, where it is not necessary has a high number of cells, to reduce the number of cells. It is possible to have a finer mesh close to the boundary, where it is interesting to have a high number of cells. Also, it is possible to define a small length edge close to the boundary. It is necessary to achieve better treatment of the boundary layers. However, this is an area that the Simpleware group has looked at improving and in their next release (ScanIP v5.0) there will be a new boundary layer option for the mesh, which will create prism elements at the surfaces rather than tetrahedral, an example is shown in Figure 37. It is possible to generate the mesh in ScanIP+FE and import to OpenFOAM. The main conclusion is that the CFD analysis is a very important field to explore in the research with medical application. The aim is to find the optimal treatment for each patient. Here, the images processing is a useful tool to CFD analysis. Figure 37: An example of boundary layer that will be available in the next release. Image from Simpleware support 3.4 Future work Two models were extracted from data of two different patients. The main interest of this project was extracted the real geometry of the stent and analysis of the fluid region. The model can be improved with better treatment of the boundary layer. It can be possible to extract a CAD surface and generate the mesh with other software. Also, 15


26 the model can be improved with better treatment of the boundary layer with the new release that Simpleware offers. CFD mesh of the aneurysm dilatation artery was extracted. In this area there is same inlet that flow in the interior of the aneurysm. It will be interesting to analyse the blood flow into the aneurysm dilatation and how it influences the blood pressure in the weak walls caused by the aneurysm dilatation, see Figure 38. The metal graft of the stent was extracted. Further analysis of the forces affecting the stent is an interesting field for research. Figure 38: Anlysis blood pressure in the aorta aneurysm dilatation. 16

27 4 Female Neck Project This project was performed with CT data from trauma patients, with a normal noninjured cervical spine. 4.1 Background Injuries to the neck in cervical region are very important since there is a potential risk of damage to the spinal cord. The development of mechanical and clinical tools is important to prevent the neck injuries. Finite Element (FE) modeling is a powerful tool to develop and evaluate preventive systems. The main interest of this project is to extract the real geometry of bony part of the cervical. Based on image processing a very realistic FE model can be created to analysis the cervical spine injuries. This project is focusing in the cervical spine; it contains the top seven vertebrae. The naming used in this report is for the top vertebra C1 or atlas, the second C2 or axis, the third C3, the four C4, the fifth C5, the sixth C6 and the last cervical vertebrae, the seventh C7, see Figure 39. The cervical spine supports the head and allows a wide range of head motion. In addition, the base of the skull is included. The occipitoatlantal joint is formed by the occipital condyles on the skull base. It is used to reference point joint between the skull and first cervical vertebrae (C1). Figure 39: Anatomy of the cervical vertebrae from C1 to T Work process CT DICOM images format from two patients were used for the study. These patients are females with similar height and weight. The project started by importing the data to ScanIP+FE. Image processing techniques allowed constructing of a virtual 3D model. The geometry of the cervical vertebrae was extracted, from the first cervical vertebrae (C1) until the first thoracic vertebrae (T1), including the base of the skull. The main interest is to generate a FE mesh for the software LS-Dyna Data used Two different data sets were used: Model A: Female with height 167 mm and 59 kg and 26 years old. CT DICOM format was used from cervical part. The series 7 was chosen to create the 17

28 model, it contains 528 images, and slices thickness 0.4 mm and pixel spacing 0.3. Data was taken between the centre of the orbit or lachrymal bone to third thoracic vertebrae (T3), see Table 2. Model B: Female with height 174 mm and 57 kg and 25 years old CT DICOM format was used from cervical part. The series 7 was chosen to create the model, it contains 604 images and slices thickness 0.4 mm and pixel spacing 0.3. Data was taken between centre of the orbit or lachrymal bone to ford thoracic vertebrae (T4), see Table 2. Both data have good quality to extract the geometry of the bone part with high detail. Spine and the ribs can be easily identified. The Figure 40 shows of the CT scan taken in the upper part of the thoracic area. It is situated where first thoracic vertebrae (T1) meet the rib. The cross section situated through the intervertebral disc between first and second thoracic vertebra (T1-T2). Spine and the ribs can be easily identified. Note that it is not possible to see the intervertebral disc in the CT images. Table 2: Specification of image data. Height (mm) Weigh (Kg.) Age (Years) Data Type No Serie No Images Pixel spacing (mm) Spacing between slices (mm) A CT B CT Figure 40: CT image scan taken in the upper part of the thoracic area Segmentation process. Models of the skeleton structure, focusing in the cervical spine from the first cervical (C1) to first thoracic vertebrae (T1), were created, including the occipital bone. Using ScanIP+FE, DICOM files are imported and the data is prepared. The windowing is realized to adjust the volume rendering parameters, setting the image at bone values. Using flood fill semiautomatic techniques, the geometry of structure of the cervical spine is extracted. Manual work is necessary to define the different vertebrae where neighboring structures have a similar radio density. Manual procedure can remove the unwanted structures. Histogram-based methods are very efficient too, Figure 41. The histogram is computed from the pixels in the image and the frequency of different 18
, second (C2), third (C3), fourth (C4), fifth (C5),")


29 parts. Peaks and valleys in the histogram are used to locate the clusters in the image based in the color and the intensity. Figure 41: Histogram, comparison between grey scale and number of pixel Nine masks were created, one mask for each vertebra, including: First (C1), second (C2), third (C3), fourth (C4), fifth (C5), sixth (C6), seventh (C7) cervical vertebrae, the first thoracic vertebrae (T1) and the base of the occipital bone. Each mask of each vertebra was defined in a different file. So it was possible to minimize the memory used and reduces the computational time in the segmentation process. Morphological filter and smoothing is applied in the masks. The same technique and values was used for each mask and both models. Using Boolean operation, overlapping is avoided. Also, 3D editing tools were using to smooth specific regions. The same volume and topology are preserved with a focus on: the contact surface for the intervertebral discs, the contact with nerves and the transverse foramen. Figure 42 shows an example of the seventh vertebrae, where the blue colour shows the regions of interest where high anatomical accuracy is needed. In addition, this project also checked the possibility of improving the model, adding some soft tissues from the CT data. Automatic techniques are not very useful here, manual work is necessary to extract the muscles. Figure 43 shows the sternocleidomastoid muscle extracted from CT images data of Model A. Figure 42: Same volume and topology are preserved. Example seventh cervical vertebrae. Figure 43: Muscle extracted from CT model A 19


30 D Analysis Comparison of models The geometries of the structure of two female necks were extracted. Figure 44 shows the 3D view of the both models. The Model A has more curvature compared with the Model B. Geometrical comparison of angles between vertebrae, spine curvature and volume were performed. Figure 44: Right model or Model A from female with height 167 mm and 59 kg and the left model or Model B from female with height 174 mm. and 57 Kg Comparing the angles of contacts surfaces One of the targets for this project was to preserve the feature of the contact surfaces in the vertebral joints. It was taken into consideration during the segmentation process. The angle between the surfaces of the vertebrae is useful to evaluate how well the spinal kinematics can be simulated. It was extracted in Table 3. The angles of the surface between the vertebrae and the intervertebral discs are provided for both models. The measures were taken from the 3D models, and it is provided with respect to the horizontal plane. The measure of the angles of model A and model B were compared. The data shows a change in the measure of the angles between the first and second vertebrae cervical. The third until seventh cervical vertebrae show similar measures. In addition, the angle of the contact surface between the first and the second cervical vertebrae is smaller compared with the other vertebrae. The model A shows more curvature compared to the model B, it can be due to an extension of the neck during the scanning. Volume and moments of inertia were extracted for each vertebra; see Table 3. The volume was taken as the total mask volume, treating each voxel within the mask as a cuboid. The moments of inertia tensor measures assume that the material density is constant. It is computed using the moment of inertia of a cuboid voxel. To recover the true moment of inertia, the values must be multiplied by the material density. The first and the seventh cervical vertebrae show a reduction of the volume between the Model B compared to Model A of 30%. The third and the sixth cervical vertebrae show a reduction of 20% and the other shows similar volumes. Some topology is lost when the element mesh is reduced, so it introduces a change in the volume measure in comparison with the real volume of the vertebrae. The small geometrical features are more sensitive to an increase of the element size, regarding a change in the volume. 20
 Atlas A (Degree) B (Degree) Second Vertebrae Cervical (C2) Axis Angle Inferior Left (α IL ): 23 34 Angle Inferior right (α IR ): 20 35 A (Degree) B (Degree)")
 Angle Superior Left (α SL ): 45 42 Angle Superior right (α SR ): 40 41 Angle Inferior Left (α IL ): 40 44 Angle Inferior right (α IR ): 38 39 Fourth Vertebrae Cervical (C4) A")
31 Table 3: Angles contacts surface vertebrae. First Vertebrae Cervical (C1) Atlas A (Degree) B (Degree) Second Vertebrae Cervical (C2) Axis Angle Inferior Left (α IL ): Angle Inferior right (α IR ): A (Degree) B (Degree) Angle Superior Left (α SL ): Angle Superior right (α SR ): Angle Inferior Left (α IL ): Angle Inferior right (α IR ): Third Vertebrae Cervical (C3) A (Degree) B (Degree) Angle Superior Left (α SL ): Angle Superior right (α SR ): Angle Inferior Left (α IL ): Angle Inferior right (α IR ): Fourth Vertebrae Cervical (C4) A (Degree) B (Degree) Angle Superior Left (α SL ): Angle Superior right (α SR ): Angle Inferior Left (α IL ): Angle Inferior right (α IR ):
32 Fifth Vertebrae Cervical (C5) Angle Superior Left (α SL ): Angle Superior right (α SR ): Angle Inferior Left (α IL ): Angle Inferior right (α IR ): Sixth Vertebrae Cervical (C6) Angle Superior Left (α SL ): Angle Superior right (α SR ): Angle Inferior Left (α IL ): Angle Inferior right (α IR ): Seventh Vertebrae Cervical (C7) Angle Superior Left (α SL ): Angle Superior right (α SR ): Angle Inferior Left (α IL ): Angle Inferior right (α IR ):
33 Model A Moments of inertia (mm 5 ) Vol (mm 3 ) Ixx Iyy Izz Ixy Ixz Iyz C1 9.16e e e e06 163e03 114e03 260e03 C2 13.2e e e e06 42,6e e03 369e03 C3 6.96e03 653e e e e e e03 C4 8.78e03 821e e e e e e03 C5 9.24e03 991e e e06-101e e e03 C6 8.59e e e e e e e03 C7 10.3e e e e e e03-205e03 Model B Moments of inertia (mm 5 ) Vol (mm 3 ) Ixx Iyy Izz Ixy Ixz Iyz C1 12.4e e e e06 279e03-332e e03 C2 14.7e e e e06-118e e03 412e03 C3 9.14e03 900e e e e e e03 C4 9.07e03 870e e e e e e03 C e03 690e e e e e e03 C6 11.3e e e e e e e03 C7 14.3e e e e e e03-251e Finite Element mesh generation FE models and CAD surface (STL file format) were generated with ScanIP+FE and the FE mesh was imported directly to LS-Dyna. The mesh is exported with length unit in millimetres. Much effort was put in analysing how to reduce the final number of elements. The mesh is generated using tetrahedral and hexahedral. Using adaptive meshing to boundaries and interior elements setting with a large target value should reduce the final number of elements. But in this project, it is interested has similar elements size in the mesh. Figure 45 shows a relation between the number of elements and length of the element edge. The main interest is to have a peak location around the mean length edge element and a small deviation, see Figure 46, where it is shown in the graph with a thick line. So, in this case, there are similar sizes in the elements of the mesh. To reduce the computational time, the mean element edge length should be as high as possible. 23


34 Figure 45: Relation between number of elements and length edge element mesh. Figure 46: Relation between number of elements and length edge element mesh, thick line shows similar size of elements. The numbers of pixels are directly linked with the number of elements after the meshing process. So, another way to reduce the number of elements is to down sample the data before meshing, but making sure that it does not lose the features that are interesting to preserve. An analysis to choose the down sample value was realized, evaluating the feature that it is losing when different values are used. Figure 47 shows a graph where the number of elements in the mesh is compared to the reduction of the volume. It is assumed that the 100% volume is in the case with the pixel value from the data without any transformation. Hence, in this case it is possible to reduce the number of elements by fifty per cent and still have the reduction of volume very low. Figure 48 shows an example of when the number of element is reduced so much that it is even changing the geometry of the model. In this example, the first vertebra from the model A is showed. The ideal spacing has to be chosen depending on the size of the smallest feature that should be captured in the model, see Figure 49. Based in this analysis, the data is down sample with a 1.4 mm pixel size. Figure 47: Relation between number elements in the mesh and volume. Figure 48: Relation between number of elements and topology and volume that is reduced. Figure 49: Small feature define mesh size. 24


35 Material properties were assigned to the mesh. The material was set based on the grey scale value. Bone in human is generally classified in two regions: cortical bone and trabecular bone. Cortical bone is dens and forms the outer shell around the trabecular bone of the vertebrae. The trabecular bone is much more porous. In the mesh, two different regions were differenced: the trabecular and the cortical region. Figure 50 shows a CT image of one of the cervical vertebrae with the cortical and trabecular regions. Based on the signal strength of the underlying image data trabecular bone was defined with value below 819 HU in grey scale and all pixels with higher values were assigned to the cortical region. Trabecular material properties were defined based in the grey scale value. The cortical bone was defined as a homogeneous material. For each region the mass density, Young s modulus and Poisson ratio was assigned with the following values: mass density 1.8 e-06, Young s modulus 1.5e04 and Poisson s ratio 0.2 (Brolin, 2002). Figure 50: CT scan where it is possible sees the different density between the cortical and trabecular bone. Figure 51: FE model A based in CT data. Figure 52: FE model B based in CT data. The FE mesh of the vertebrae was generated by mixing hexahedral and tetrahedral elements. CAD surface from the lower part of the skull was exported. This part it is 25
36 useful to uses a reference for positioning the neck. In the preprocessing pre-smoothing was applied and set with minimum edge length of 3 mm. and 7 mm. It was exported using absolute global coordinates (base in the CT data) and STL format file and FE model was exported to LS-Dyna. Same method was used for each vertebra and applied to both models. The number of elements in model A is 18e04 elements (Figure 51) and 16e04 model B (Figure 52). Based on the complex geometry of the vertebrae, the 90% of the elements in the mesh are tetrahedral. 4.3 Conclusion CT image of two female patients were used to create three dimensional FE models of the cervical spine to analyze with the LS-Dyna software. Using image processing and model generation techniques numerical models were created that followed the real geometry with high detail. A model of the cervical spine was extracted, between first cervical vertebrae (C1) until first thoracic vertebrae (T1) including the base of the occipital bone. The data used had good quality and it was possible to extract the geometry of the bone with high detail. The bony parts can be easily identified and semiautomatic techniques are very useful in this case. The volume and topology in specific regions of interest were preserved. 3D editing tools made it possible to apply filters in specific regions. Visual comparison between two models was easy using the 3D models. In order to reduce the total number of elements, an analysis was performed. The aim was to have similar sized elements in the meshes, so interior elements with large value were not interesting in this case. Material properties base in the grey scale value are possible to define, and different regions can be differentiated. The total number of elements depends of the size and required detail of the model. The mesh was generated with a mix of hexahedral and tetrahedral elements. The hexahedral elements are often generated in the center of the vertebrae and the edges are tetrahedral. Using image processing techniques is possible extract FE models with high geometry detail and very close to the real. It is possible create a 3D model, analysis the geometry and extracting measures. In addition it is possible to generate numerical models and export directly to commercial software, in this case LS-Dyna. The FE model is generated with ScanIP+FE. There were some advantage and some limitations: It is possible to extract a model that follows the geometry with high detail. But with more detail and more complex geometries the total number of elements is increased. More data increase the time consumed in image process, so it is very important work in small files keeping only the necessary data. It is possible to generate tetrahedral and hexahedral meshes, but it lacks a high control and flexibility in the mesh. It would be good to have a manual tool to change the elements of the mesh in specific regions. The center of mass is given directly according with the local reference system; it would be good to get the center of mass according to the global reference system. It is possible extract some muscle geometry from the CT data but manual work is required. 26


37 It is concluded that image processing is useful tool to create FE models to evaluate the cervical injury. 4.4 Future work The models can be improving by adding the intervertebral disc, spinal cord or/and spinal nerves, see Figure 53 and Figure 54. It is not possible to extract information about these tissues from the available CT data. However, there are several options: Using other set of CT data or MRI data where the intervertebral disc and soft tissues can be extracted, or to generate the geometry based on data from the literature, or to assume that the space between the vertebrae is filled by the intervertebral disc. In addition the model can be improved adding soft tissue. Some soft tissue can extract from the CT but from MRI or literature they can generated with more detail, Figure 55. Figure 53: Intervertebral disc. Figure 54: spine cord or / and spine nerve. Figure 55: Sternocleidomastoid muscle. 27
38 5 Animals Models Project Traumatic brain injuries (TBI) are one of the major public health problems in all parts of the world. The consequences following these injuries are serious and frequently present throughout life. Animal experiments, to serve as human surrogates, have been regarded the main possibility in the studies of brain injury mechanisms in the past. In this project, image processing was used to support the development process of animal head and neck numerical models. One rat and one monkey FE model were developed. The models are being used to simulate recent rat experiments, Davidsson (2011) and monkey experiments carried out in the past, Ono (1980). The image processing tasks presented here were developed within the frame of the collaborative research in head injuries between Chalmers and the Japan Automobile Research Institute (JARI). Ermes Tarallo from Politecnico di Milano, Jacobo Antona Makoshi, from JARI and Chalmers, and Johan Davidsson from Chalmers were involved in this part of the project. 5.1 Rat project Background The main interest of this current project is to extract the geometry of the scalp and skull for two rats with different mass. Comparisons of both specimens were realized and one specimen was chosen for the FE model generation. The model was simplified in some regions for the simulation, preserving details only in the regions of interest. Also, the spine was extracted and added to the model. This project is focusing in image processing. The geometry was extracted using ScanIP+FE Simpleware software Work process CT images, on DICOM format, of two specimens were used to create CAD surface models of the skull, the scalp and the cervical spine. The data was extracted from two male rats with mass of 290 and 640 grams, respectively. The data was provided by the Karolinska Institute, Stockholm, on September 29 th, The images were taken in accordance with the Swedish National Guidelines for Animal Experiments, which was approved by the Animal Care and Use Ethics Committee in either Umeå or Stockholm Data Rat_290: The data of the male rat with 290 grams mass was created based on the series no 5, where 885 slices images were acquired from the seventh cervical vertebra to the skull, with spacing size mm (Table 4). Rat_640: The data of the male rat with 640 grams mass was created based on the series no 13, where 1014 slices images were acquired from the sixth cervical vertebrae to the skull, with spacing size mm (Table 4). 28


39 Table 4: Specification of the data. Data type No Series Weight (Grs) Gender No Images Spacing size (mm.) Rat_290 CT Male Rat_640 CT Male Segmentation process skull and brain cavity Segmentation of the skull of the both specimens was realized to extract the geometrical dimensions of the skull and brain cavity and a comparison of the two specimens was realized. The same methodology was applied for both models. Figure 56 shows a CT image of a rat head, the cross section was taken from the horizontal plane. The bone can be easily identified; the image shows the skull and the mandibular bone. The grey scale with lower value is the skin. However, with the CT data it is not possible distinguish any soft tissue inside the skull. It is possible to extract the brain cavity. This can be combined with the literature (such as an anatomical atlas) to extract the brain geometry (or combine with other data, such as MRI). The memory required to process the data is very high so it was necessary crop the data. The background used for segmentation of bones was set to double pixel value. Semiautomatic methods based on the grey scale value, such as threshold and flood fill, were applied to segment the regions of interest and create the mask. And manual tools were necessary to use. Two masks were created: brain cavity and skull mask, see Figure 57. Morphological filter were applied in the Skull mask. 3D editing tools in front region of the skull was used to simplify this region that it is not necessary high geometric detail. The 3D models of the skull are shown in Figure 58 and Figure 59. Boolean operations were used to create the brain cavity mask based in Skull mask. The 3D models of the brain cavity of both specimens are shown in Figure 60 and Figure 61. Figure 56: CT scan image of a rat head Figure 57: Two mask: Skull and Brain cavity. 29


40 Figure 58: 3D Model of the skull based on CT data Rat_290 Figure 59: 3D Model of the skull based on CT data Rat_640 Figure 60: 3D Model of the brain cavity based on CT data Rat_290 Figure 61: 3D Model of the brain cavity based on CT data Rat_ Segmentation process Scalp The scalp of both specimens is extracted. The background used for the segmentation was set with double pixel value. Semiautomatic tool such as threshold was applied to segment the regions of the skin and the skin mask was created. Figure 62 shows the 3D models with the scalp, skull and brain cavity. Figure 62: 3D models with the scalp, skull and brain cavity. Model in the right belong data from RAT 640 and left model belong to data specimen RAT D Analysis Comparison models Both specimens were compared. The Figure 63 shows orthogonal view of the models with the scalp, skull and brain cavity of both specimens. Measures were extracted from the models for the comparison using ScanIP+FE: volumes, density grey scale, centre of mass, inertia properties and the main measure of the skull. 30
 and it is provided the total mask volume, treating each voxel within the mask as a cuboid.")

41 Figure 63: lateral and top view of the Rat models created based in CT data. Right model was created based in data Rat 640 grs; left model was created based in data Rat 290. The volumes of the both models were measured. The volume in millimeters cubic (mm 3 ) and it is provided the total mask volume, treating each voxel within the mask as a cuboid. For Rat 290 grs, the volume of the skull mask was 3.37e3 and 1.85e3 mm 3 for the Brain Cavity mask. The mean grey scale of the skull masks 2.18e3, see Table 5. And in the Rat 640 grs, the volume of the skull mask was 5.42e3 and 2.31e3 mm 3 for the brain cavity mask. The mean grey scale of the Skull masks 2.23e3, see Table 5. Table 5: Volume skull and brain cavity mask of the rat models. Skull mask Volume (mm 3 ) Brain cavity Volume (mm 3 ) Rat_290GRS 3.37e e03 Rat_640GRS 5.42e e03 The maxims measure of the skull and the brain cavity based in the reference system of the CT scan data were extracted according with Figure 64. The moment s inertia and centre of mass of the skull and brain cavity mask were extracted. These measures were calculated with ScanIP+FE, based in the local reference system from the CT image data, Table 6. Using ScanIP+FE the measure of the centre of mass of the mask is extracted base in the local reference system of the CT image. Anyway it is possible change of coordinates from one to another reference system. Based on that we know both reference system and we can easily transformation coordinate of the point local reference system of the CT image to another reference system or in the opposite way, global to local. This is an easy method but need time, and based in the limited time of the project it was provided the centre of the mass of the masks in local reference system. 31

42 The center of mass of the mask is provided the three coordinates directions (X, Y, Z) in millimeters (mm). Each voxel is assumed to have identical mass. The moments of inertia tensor for the mass assume the material density is constant. It is computed using the moment of inertia of a cuboid voxel. To recover true moment of inertia, the values must be multiplied by material density. Measure Skull and brain cavity (mm) Xmax Ymax Zmax Xmax_Cerebl Ymax_Cerebl Zmax () Skull_Rat_ X X X Skull_Rat_ X X X BrainCavity_Rat_ BrainCavity_Rat_ Figure 64: Max. Dimensions Skull and Brain cavity from Rat 290 grs and Rat 640 grs. 32
 Moments Inertia Tensor (mm 5 ) x y z Ixx Iyy Izz Ixy Ixz Iyz Skull_Rat_290 12 10 21 5.1e05 4.9e05 1.7e05-1.1e04-2.5e04-3.1e04 Skull_Rat_640 15 13 27 1.2e06 1.1e06 4.1e05-3.4e04-9.")
43 Table 6: Centre of Gravity and Moments inertia based in the reference system of the CT image data. Centre Mass L (mm) Moments Inertia Tensor (mm 5 ) x y z Ixx Iyy Izz Ixy Ixz Iyz Skull_Rat_ e05 4.9e05 1.7e05-1.1e04-2.5e04-3.1e04 Skull_Rat_ e06 1.1e06 4.1e05-3.4e04-9.1e04-1.4e05 BCavit_Rat_ e04 7.3e04 3.1e04 6.6e02-2.2e03 6.6e03 BCavit_Rat_ e05 1.1e05 4.2e04 3.1e03-3.1e03 2.9e03 The measure of the skull from both specimens was extracted based on the centre of mass of the Brain Cavity. Based in this centre of mass of the Brain cavity mass lines in the direction of the three axles and their diagonal were generated. The intersection of these lines with the skull and scalp give the measure of the diploe table in, diploe table out and scalp. It is showed in the graphs Table 7. The measures were extracted in millimetres. Based in the result of the skull and brain cavity; the skull model from Rat 640 presents 110 % of volume bigger than the model from data Rat 290grs. Instead the brain cavity shows a change in the longitudinal measure (according direction axle Z) between both specimens. But the brain cavity does not change its dimension lateral and vertical direction (according axle X and Y). 33

44 Table 7: Thickness skull and scalp RAT MALE 290- XY RAT MALE 640- XY RAT MALE 290- ZY RAT MALE 640- ZY RAT MALE 290- XZ RAT MALE 640- XZ


 until sixth cervical vertebrae (C6) were segmented. Based in region growing techniques and flood fill tools, the regions of interest were segmented.")
45 Segmentation process Based on the results of the comparison the specimen Rat 640 grs was chosen and complete analysis is performed in one specimen. The skull was simply for the simulation, with the exception of same specific regions. The Figure 65 shows a cross section view of the skull of the Rat 640 grs, where it is specify what parts need to preserve intact. The region preserved was: the internal cavity, condyles occipitals and the foramen magnum and the upper surface of the skull, these parts were kept almost intact, the Figure 65. The cavities of the skull were filled applying filters and the rest of the skull smoother using 3D editing tools. Figure 65: Skull of a Rat, where shows same topology that was necessary preserve. The cervical were extracted, from first (C1) until sixth cervical vertebrae (C6) were segmented. Based in region growing techniques and flood fill tools, the regions of interest were segmented. Six masks were created, one mask for each vertebra: First cervical vertebrae (C1), second cervical vertebrae (C2), third cervical vertebrae (C3), fourth cervical vertebrae (C4), fifth cervical vertebrae (C5) and sixth cervical vertebrae (C6), see Figure 66. Figure 66: Anatomy of the cervical vertebrae from C1 to C6 and Skull. Morphological filters and Gaussian were applied in each mask to fill the cavity. The same method was realized for each vertebra. Boolean operations were used to avoid overlapping between the vertebrae Figure 69. The skull was simplified using 3D editing tools. For the simplification was taken account that same topology and volume had to be preserved. The Figure 67 shows the skull before the simplification and the Figure 68 shows the skull after simplification. 35


 were generated. Target minimum and maximum edge length were defined in 0.3 and 0.")

 were extracted, see Table 8.")


46 Figure 67: 3D model of the skull from data Rat 640 grs. Figure 68: 3D model of the skull from data Rat 640 grs simplified CAD Surface generation Surface tetrahedral mesh models of skull and brain cavity from Rat 290 grs and Rat 640 grs were generated (models before the simplification). Target minimum and maximum edge length was defined in 0.3 and 0.8 mm. respectively. In addition presmooth in the generation of the mesh was applied. It was exported in STL file format. Surface tetrahedral mesh model of skull simplified, brain cavity and the cervical neck between first to sixth cervical vertebras (C1-C6) were generated. Target minimum and maximum edge length were defined in 0.3 and 0.8 mm respectively. In addition presmooth in the generation of the mesh was applied. It was exported in STL file format. The Figure 69 shows the CAD surface of the skull simplified and Figure 70 shows the brain cavity from data RAT 640 grs. Figure 69: CAD surface of the skull simplified from data Rat 640 grs. Figure 70: CAD surface of the brain cavity from data Rat 640 grs. The volume and inertia properties of the Skull simplified, brain cavity and neck (C1 to C6) were extracted, see Table 8. The volume in millimeters cubic (mm 3 ) and it is provided the total mask volume, treating each voxel within the mask as a cuboid. The inertia properties and centre of mass of the skull simplified, brain cavity and neck masks were extracted. These measures were calculated with ScanIP+FE, based in the local. The moments of inertia tensor for the mass assume the material density is constant. It is computed using the moment of inertia of a cuboid voxel. To recover true moment of inertia, the values must be multiplied by material density. 36
47 Table 8: Inertia properties and volume from Male 640 grs of the skull simplified, brain cavity, neck and skin. Moments Inertia (mm 5 ) Volume Ixx Iyy Izz Ixy Ixz Iyz (mm 3 ) Skull_R640 Simplified 1.8e06 1.8e06 5.6e05-3.3e04-1.1e05-1.5e05 8.8e03 Brain cavity_r e05 1.1e05 4.2e04 3.1e03-3.1e03 2.9e03 2.3e03 C1_R e02 2.4e03 2.7e03 4.3e02 4.9e01-1.5e02 1.4e02 C2_R e03 1.6e03 1.1e03-2.1e01-6.6e01-6.2e02 1.3e02 C3_R e02 6.8e02 5.9e e01-3.2e01-8.8e01 8.0e01 C4_R e02 8.9e02 9.1e e01-2.4e01-6.2e01 8.7e01 C5_R e02 6.9e02 7.6e e01-3.1e01-4.7e01 7.5e01 C6_R e02 1.3e02 1.5e02 6.9e01-7.6e01 5.0e01 1.1e Monkey project Background This research project is conducted by Jacobo Antona Makoshi from JARI and Chalmers. The main interest of the current project is extracted the geometry of the skull and cervical from two monkeys from different data. Two CT scan data were acquired from two male monkeys to create one model. The images from the first specimen (MFF2115) were taken in accordance with the Kyoto University Primate Research Institute (KUPRI) Ethics Committee in Japan. The purpose of the use of the images was specified through a collaboration agreement between JARI and KUPRI. The images from the second specimen (Mff1761) were downloaded from the KUPRI online morphology museum. The alignments of the neck of the model did not correspond with the posture of the neck of the experiments to be simulated, see Figure 71 a). Hence, it was necessary to add the cervical spine from another CT set with the correct alienation. So the geometry of the skull and the spine were extracted from different specimens and aligned in the correct posture according with the experiments, Figure 71 b). a) b) Figure 71: Monkey model based in two different data. A) The spine for the simulation it is not in the position that is required for the simulation. B) Data from the spine from other specimen was aligning with the current model. 37


48 5.2.2 Work process CT DICOM image of two specimens were used to create a CAD surface model of skull, scalp and cervical spine. The data was extracted from two male monkeys from two different data sets to create one model. The segmentation and meshing process of the skull and scalp of specimen MFF2115 was realized by Jacobo Antona Makoshi. The cervical neck segmentation and alignment tasks were carried out by Marta González Carcedo Data Model A: Model B: CT DICOM data acquired from the head and neck with the specimen MFF2115 in prone position, until fifth cervical vertebrae (C5). Data used is from series 4. It has 680 images with pixel size 0.25 mm and spacing between slices is 0.2 mm. see Table 9. CT DICOM data acquired from the head and neck with the specimen Mff1761 in supine position, until fifth cervical vertebrae (C5). Series 15 is the data used. It has 721 images with pixel size 0.31 mm and spacing between slices is 0.2 mm. see Table 9. Table 9: Information data used to create the models. Specimen Data type No. Series No. Images Pixel size (mm) Spacing between slices (mm) Model A MFF2115 CT Model B Mff1761 CT Segmentation process Based in the previously extracted skull model, this current project tries to add to the model a cervical neck with the right alignment. It was necessary to do: a) Fast segmentation of the skull and first cervical of Model A, Figure 72a. b) Segmentation of base of the skull and cervical vertebrae Model B, Figure 72b. c) Positioning the Model B based in Model A, and generate CAD surface of the vertebrae, Figure 72c. (a) (b) (c) Figure 72: Segmentation process of the Monkey model. a) Fast segmentation skull and C1 model from CT data Model A; b) Segmentation base of the skull and neck from CT data Model B; c) Align the models and generate CAD surface. 38
 vertebrae and Skull The data from Model B was imported to ScanIP+FE.")

49 The research starts importing the data of specimen Model A to ScanIP+FE. A fast segmentation of the skull and the first cervical vertebrae (C1) was realized from scan data Model A. This segmentation is used as a reference to align the neck. Figure 73: Anatomy of the first cervical (C1) vertebrae and Skull The data from Model B was imported to ScanIP+FE. And the segmentation of the cervical neck between first to fifth cervical vertebrae (C1-C5) was realized. In addition a fast segmentation of the skull base was realized. Flood fill tool was used for the segmentation process. Six masks was created, one mask for each vertebrae: first cervical vertebrae (C1), second cervical vertebrae (C2), third cervical vertebrae (C3), forth cervical vertebrae (C4), fifth cervical vertebrae (C5) and base skull. Morphological filter and smooth were applied in the masks to reduce the noise. And Boolean operation was used to avoid overlapping. Figure 74: Anatomy of the cervical vertebrae from first cervical (C1) to fifth cervical vertebrae (C5) and base Skull After the segmentation was realized, it was aligned with ScanIP+CAD to create one model. But it was necessary have the same spacing than the data Model A. So the new pixel value is 0.5 mm and slices thickness CAD surface generation CAD surface of the skull and first vertebrae from specimen Model A and skull and neck from Model B were generated. Using the ScanIP+CAD module was possible imported and positioned the neck from Model B with the skull Model A. The model was align taken the reference the centre of mass of the first cervical vertebras and the occipitotlantal joint on the skull base. When the model has been positioned, the project was exported back to ScanIP+FE to check the position with the CT data and prepare the surface. And CAD surface was generated from the neck of Model B and 39


, the model can develop adding information of the anatomical part of the rat brain")
50 exported as are reference system base in Model A, see Figure 75. The mesh was realized with other software. Figure 75: CAD Surface of the spinal neck from CT data of Specimen Model B was positioning according with the skull generated based in CT data of Specimen Model A. 5.3 Conclusion and future work Based in RAT project, CT DICOM image of two specimens were used to create a CAD surface model of skull, scalp and cervical spine. It is possible extract the geometry of the bones and the scalp with high detail. In addition it is possible simplified specific region for the FE analysis. It was not possible extract the anatomy of the brain based in the CT images provided. It can be combining with other techniques, like using other set of CT or MRI images or literature information (atlas), the model can develop adding information of the anatomical part of the rat brain soft tissue. More detailed anatomical analysis can be realized using more specimens. For the monkey model project, CT DICOM image of two specimens were used to create a CAD surface model of skull, scalp and cervical spine. The segmentation and meshing process of the skull and scalp was done based on one specimens which images were taken in supine position, while the tasks presented here consisted on adding and aligning the neck taken from a data set obtained in prone position. CAD surface from the neck was extracted from CT data. It was aligned with the skull and the scalp of a model generated from another CT scan data. So the result is based in two different data it is possible to segment, positioning and generates a model. Being possible improve another models adding information from different fonts. And in the same way than the rat model, using other techniques the model can be develop adding information of the anatomical part of the rat brain soft tissue. 40
51 6 Workshop This project ended with a workshop with focus on how to generate numerical models for simulation based on medical imaging. It presented the status regarding methods to go from CT and MRI to FE and CFD models. The workshop included presentation and hand-on exercises. 6.1 Contents The workshop was a week programme; it was realized between Monday 12 th to Friday 16 th of December, It was located at the SAFER vehicle and traffic safety centre at Chalmers, Göteborg. It started with an introduction about why and how this project was carried out, followed by a presentation about the methodology of model generation and the three applications. The workshop included a hand-on exercises and a final discussion. The programme was distributed in three topics, as explained in more detail below: - Initial presentation (Section 6.1.1), - Hand-on exercise during the week (Section 6.1.2), - Final presentation (Section 6.1.3) Initial presentation The initial presentation took place on Monday 12 th December. Approximately 20 people participated at this initial presentation. During the presentation and after, a group discussion turned on, so the presentation was very interactive and the participants were very active and showed much interest. 10:00-12:00 The workshop started at pm with introduction to the Human Body Modelling group at Applied Mechanics and why and how this project was carried out. It was presented by Karin Brolin. Following a short introduction and presentation about medical imaging, focusing in the methodology to go from the scan data to generate a numerical model was presented by Marta Gonzalez Carcedo. This presentation had duration of 15 minutes with same time for the questions. A presentation of the methodology from image processing to validation of the model, focusing in the model generation on animals brain models, presented by Jacobo Antona Makoshi from JARI and Chalmers. The presentation and the questions had duration of 35 minute. Following presentation of three different applications, which are including in this project, was presented by Marta Gonzalez Carcedo. This presentation had duration of 25 minutes with same time for the questions h/ It was expected to finish with the presentations before lunch. However, the time for the questions was not enough so it was necessary to continue after lunch with the presentation workflow process on how to generate models. An introduction in ScanIP+FE Simpleware software was realized, giving the participants a tutorial on how they could start to work with the software. 41
52 Presentation of workflow about the image process and model generation was carried out by Marta Gonzalez Hand-on exercise during the week Hand-on exercise during the week was taken place between Monday 12th to Friday 16th December. The participants got a short term license for the Simpleware software to install on their own computer and the Division of Vehicle Safety (Applied Mechanics department of Chalmers) provided computers for those if needed. In addition, places to sit were available at SAFER for all participants. The participants were free to show up whenever they could. Approximately 10 people participated in the hands-on exercises. Marta Gonzalez Carcedo was supporting the participants full time together with Jacobo Antona Makoshi. Instructions for the installation process were provided the participants. The participants could work in examples following tutorials and/or with their own data Final presentation Final presentation was taken place on Friday 16th December. The workshop ended having a discussion the experience of the workshop week and discussion on how to generate models from medical imaging in the future. This workshop was moderated by Karin Brolin and during 2 hours the participants presented their results and discussed their experiences. 10:00-12:00 The workshop starting with a summary about what the experiences learned during the week. Following a summary and group discussion on the usability of image processing method was realized and pros and cons of the software. It ended by having a discussion on how to generate models from medical imaging in the future. 6.2 Hand-on Applications The workshop participants were researchers from different areas such as fluid dynamics, medicine, and vehicle safety. It was great to exchange knowledge and experience from the point of view of the different fields. Approximately 10 people participated in the hands-on exercises. Marta Gonzalez Carcedo was supporting the participants full time together with Jacobo Antona Makoshi. Below is a summary of applications which the participants working on during: Modeling of stent graft of the aorta based on CT data form CFD analysis by Håkan Nilsson from Chalmers, Håkan Roos from Sahlgrenska University Hospital. Skeleton structure of the neck from females based in CT data for FE analysis by Karin Brolin from Chalmers, focusing in evaluation of the influence in spinal kinematics. Skeleton structure and soft tissue of the cervical spine based on CT data by Jonas Östh from Chalmers. Image processing of the shoulder based in CT data by Manuel Mendoza- Vazquez from Chalmers. 42
53 Skeleton structure focusing on lower extremities of the several subjects based on CT data for anthropometric analysis by Krystoffer Mroz from Autoliv. Image processing of the tumor in the brain based in MRI data by Gayatri Mirajkar Sonavane. Application in material properties using image processing by Håkan Johansson from Chalmers. Instructions for the installation process were provided the participants the Friday before the workshop. The participants could install the software before and everything was ready on Monday for the workshop. Whose participants that they need help with the installation software was helped on Monday for the supports. The participants got a two weeks short term license of the Simpleware software to install in their own computers. So the participants could work in SAFER and/or in their own place. The licenses were kindly provided by Simpleware Ltd. The Division of Vehicle Safety provided a computer with Simpleware license installed for a person that needed computer. In addition, places to sit were arranged for three persons that did not have a desk at the SAFER office. The participants were free to show up whenever they could. Every day, around three to four people were working with the software. The participants started with examples following tutorials, after this first contact with the software the participants started work with their own data. The first days less questions showed up but after this day the participants asked a lot of questions. Below same of the example result of this week workshop: - Sternocleidomastoid muscle was extracted from CT-scan data by Jonas Östh, PhD student from Active Human Body Model (AHBM) Chalmers, see Figure CFD Model of Aorta Stent graft and aneurysm dilatation were generated based in CT-scan by Håkan Nilsson from Chalmers, see Figure 77 and Figure A steady flow in an aortic aneurysm based in CFD model generated with Simpleware. It was generated the model and run with OpenFOAM by Håkan Nilsson during the workshop, Figure


54 Figure 76: Sternocleidomastoid muscle geometry derived from CT-scan during the workshop from Jonas Östh. Figure 77: CFD Model of Stent graft generated derived from CT-scan during the workshop from Håkan Nilsson. Figure 78: CFD Model of Aortic aneurysm generated derived from CT-scan during the workshop from Håkan Nilsson. Figure 79: Steady flow in an aortic aneurysm. The CFD model was generated with Simpleware and simulation was run with OpenFOAM by Håkan Nilsson during the workshop. 44

55 6.2.1 Active Human Body Models project: Applications for medical image processing The following text was authored by Jonas Östh, PhD student in the Injury Prevention group, Applied Mechanics, Chalmers University of Technology. The aim of the Active Human Body Model (AHBM) project is to incorporate active muscle responses in a human full-body Finite Element (FE) model, enabling the use of an FE HBM to predict pre-crash kinematics and restraint interactions as well as injury due to crash loading. Currently in the AHBM project, muscle function is modelled using a simplified approach with line elements that capture the muscle line of action, see Figure 80. For this, anatomical literature provides a sufficient means to implement the muscles. One possible further refinement of the model is to represent the muscle using solid elements. To do this, there are two major requirements: First a continuum muscle model that can represent the mechanical muscle properties using solid elements (Khodaei and Mostofizadeh, 2010). Second, a correct representation of the volume that the muscles occupy is needed. To generate such geometries, medical image processing is a suitable approach. During the medical imaging workshop the outline of the sternocleidomastoid muscle was extracted from a set of CT-scan data, see Figure 81. Figure 80: Musculoskeletal structure of the AHBM (Östh, 2010). Figure 81: Sternocleidomastoid muscle geometry derived from CT-scan during the workshop from Jonas Östh. 45
56 6.2.2 Injury-HBM project The following text was authored by Manuel Mendoza-Vazquez, PhD student in the Injury Prevention group, Applied Mechanics, Chalmers University of Technology: The objective of the injury human body model (I-HBM) project is to improve the thoracic injury capabilities of a human body model. Restraint systems can be then improved by evaluating and designing them using a human body model with better injury prediction. At this moment, the I-HBM project is focusing on improving rib fracture prediction. There are several parameters that influence the mechanical response of the ribs and their fracture. Bone material properties and geometry are among those parameters. Medical imaging is an essential tool in defining rib geometry and material parameters. The geometry parameters that can be defined are the rib cortical thickness, rib transversal area and rib shape. The bone mineral density can be calculated with help of medical imaging and this value can be then used to define the adequate material properties. It is known that the ribcage shape changes with age and that there are some differences in the size of ribs between males and females. The effect of these changes on the rib injury outcome is not completely understood yet. Human body models of different populations could be a way to gain understanding about the effect of these changes on rib injury outcome. A description of rib and ribcage geometries is a first step to create human body models representative of different demographic groups. Processing CT scans seems as a promising way to obtain representative geometries for different populations. During the workshop, I have evaluated the feasibility to automatically retrieve ribcage geometries from CT scans using Scan IP. The conclusion was that the user still needs to spend some time to retrieve the geometry and that the process cannot be completely automatic yet. 6.3 Feedback Approximately 20 people participated at the initial presentations; approximately 10 people participated in the hands-on exercises and the final workshop discussion. These bullets below are a summary of the feedback given by the participants after the final workshop discussion. 6.4 What did you learn? That it is possible to create 3D models and export to other software. Possibilities and limitations with the software. To create 3D models from human medical data. Software is user-friendly and can be implemented. Did some tutorials and worked with CT-data, learned that time is needed to learn the software and chose appropriate filters. How medical images look like, are generated, and modified. Filtering techniques for images and geometrical comparisons Anatomical in own field and others 46
57 Unstructured mesh generation with tetrahedral Deeper understanding of the status regarding methods to go from CT/MRI to FE models Valuable insight how the software works. 6.5 Value of the workshop? Good orientation on how model generation based on medical images is done. Knowledge about other projects at Chalmers. Gave many ideas on how to use the software for other projects. Useful from my research point of view and interesting. Important to listen to other possible applications. A good opportunity to get experience in the field. Produced images that can be of value for marketing of research short and long term. Useful to be able to evaluate presented models and models made by others. 6.6 Feedback on the program/planning. Good with initial presentations, individual work where we could get help and a sum up in the end to exchange knowledge and experience. Good format: rather short, focused but with room for discussions. Good planning of the workshop. The seminar form was good, with two hour intro and free work followed by a summary. Good that the software could be installed on own computer and worked with during the week when time was available. Marta helped and followed up the work of the participants in a good way. It was great having Marta as an expert that worked with the software before the workshop. 6.7 Conclusions Below there are some of the pros and the cons of using image processing techniques for model generation. It was extracted from the discussion of the participants in the last day of the Workshop. + Image processing is a useful tool to identify geometries from images. + Good for measuring anatomical differences in different persons. + Can be used to create a 3D anatomical book for education use. + Good thing of using the Simpleware software, it has a good support from the software company. + Useful tool to model generation - Limited meshing - Automatic tools are available but manual work is necessary. 47
58 6.8 Lesson learned The main interest was to get knowledge about image processing giving in the presentation time, adding with experience during the workshop week. The participants were register giving some information about background and why they were interested. So it helped to know what type of presentation and application would be presented. The licenses were given to the participants the week before, so they could install the software before to be ready the first day of the workshop. In addition it was possible use your own computer and work with during the week when time was available, so it gave flexibility and compatibility with your schedule work. The workshop week programmed was enough to have a first contact with the software. It gave a great opportunity to get experience with image processing methods. The time allocated for presentation was not enough; the discussion time was longer that it was planned. Better workflow after lunch and have more time for discussion. Everybody that participates in the workshop was very interested in the field, with an active participation and involving in the project. It made a nice and confidence environment for the workshop, making easy the discussion and the workflow of the workshop. The participants were from different areas, it helps to give a good opportunity to exchange knowledge. 48
59 7 References Davidsson J., Risling M., (2011): A New Model to Produce Sagittal Plane Rotational Induced Diffuse Axonal Injuries. Frontiers of Neurotrauma, 2 (41) pp Ellis H., Logan BM., Dixon A. (2007): Human sectional anatomy: Atlas of body sections, CT and MRI images. 3rd edition. London: Ed. Hodder Arnold. Karin Brolin (2002): Cervical Spine Injuries Numerical Analyses and Statistical Survey. Ph.D. Thesis. Department of Aeronautics, Royal Institute of Technology. Report , Stockholm, Sweden. Khodaei H, Mostofizadeh S. (2010): Continuum Models of Active Musculature for Impact Biomechanics Simulation. Department of Applied Mechanics, Chalmers University of Technology, Research Report no 2010:06, Göteborg, Sweden. KUPRI - Kyoto University Primate Research Institute. Online morphology museum: ( ). Marta González Carcedo (2010): Anthropometric Characterization of Human Subjects. Department of Applied Mechanics, Chalmers University of Technology, Publication no. 2010:53, Göteborg, Sweden. Andersson P., Pilqvist J. (2011): Fluid-Structure Interaction analysis of the forces causing stent graft migration. Department of Applied Mechanics, Chalmers University of Technology, Publication no. 2011:23, Göteborg, Sweden. SIMPLEWARE LTD (2011): ScanIP+FE+CAD Reference Guide. Exeter, United Kingdom. SIMPLEWARE LTD (2011): ScanIP+FE+CAD Tutorial Guide. Exeter, United Kingdom. Jonas Östh (2010): Active Muscle Responses in a Finite Element Human Body Model [Licentiate thesis]. Chalmers University of Technology, Göteborg, Sweden. Ono et al., (1980): Human Head Tolerance to Sagittal Impact - Reliable Estimation Deduced from Experimental Head Injury Using Primates and Human Cadaver Skulls. 24th Stapp Car Crash Conference, SAE

60 8 Appendices This is the invitation for the workshop. Publication link: 50
Image-based simulation of the human thorax for cardio-pulmonary applications
 Presented at the COMSOL Conference 2009 Milan Image-based simulation of the human thorax for cardio-pulmonary applications F. K. Hermans and R. M. Heethaar, VU University Medical Center, Netherlands R.
Simpleware: Converting 3D Images into Models for Visualisation, Measurement and Computational Simulation
 converting 3d images into numerical models Simpleware: Converting 3D Images into Models for Visualisation, Measurement and Computational Simulation Dr Ross Cotton (Senior Application Engineer) r.cotton@simpleware.com
COMPARISION OF NORMAL Vs HERNIATED CERVICAL IMAGES USING GRAY LEVEL TEXTURE FEATURES
 COMPARISION OF NORMAL Vs HERNIATED CERVICAL IMAGES USING GRAY LEVEL TEXTURE FEATURES C.Malarvizhi 1 and P.Balamurugan 2 1 Ph.D Scholar, India 2 Assistant Professor,India Department Computer Science, Government
Image Acquisition Systems
 Image Acquisition Systems Goals and Terminology Conventional Radiography Axial Tomography Computer Axial Tomography (CAT) Magnetic Resonance Imaging (MRI) PET, SPECT Ultrasound Microscopy Imaging ITCS
RSNA, /rg
 RSNA, 2015 10.1148/rg.2015140320 Appendix As noted in the main article, DICOM image files cannot be used directly for 3D printing; further steps are necessary to make them readable by 3D printers. The
Volume visualization. Volume visualization. Volume visualization methods. Sources of volume visualization. Sources of volume visualization
 Volume visualization Volume visualization Volumes are special cases of scalar data: regular 3D grids of scalars, typically interpreted as density values. Each data value is assumed to describe a cubic
6th International DAAAM Baltic Conference INDUSTRIAL ENGINEERING April 2008, Tallinn, Estonia. Radu, C. & Roşca, I.C.
 6th International DAAAM Baltic Conference INDUSTRIAL ENGINEERING 24-26 April 2008, Tallinn, Estonia ON THE DESIGN OF A MEDICAL IMPLANT USED FOR OSTEOSYNTHESIS OF THE TRANSSINDESMOTIC FIBULAR FRACTURE PART
Human Heart Coronary Arteries Segmentation
 Human Heart Coronary Arteries Segmentation Qian Huang Wright State University, Computer Science Department Abstract The volume information extracted from computed tomography angiogram (CTA) datasets makes
Ch. 4 Physical Principles of CT
 Ch. 4 Physical Principles of CT CLRS 408: Intro to CT Department of Radiation Sciences Review: Why CT? Solution for radiography/tomography limitations Superimposition of structures Distinguishing between
Conference Biomedical Engineering
 Automatic Medical Image Analysis for Measuring Bone Thickness and Density M. Kovalovs *, A. Glazs Image Processing and Computer Graphics Department, Riga Technical University, Latvia * E-mail: mihails.kovalovs@rtu.lv
Optimization of Flow Diverter Treatment for a Patient-specific Giant Aneurysm Using STAR-CCM+ László Daróczy, Philipp Berg, Gábor Janiga
 Optimization of Flow Diverter Treatment for a Patient-specific Giant Aneurysm Using STAR-CCM+ László Daróczy, Philipp Berg, Gábor Janiga Introduction Definition of aneurysm: permanent and locally limited
converting 3d images into numerical models Simpleware: Converting 3D Images into Numerical Models
 converting 3d images into numerical models Simpleware: Converting 3D Images into Numerical Models converting 3d images into numerical models Company Overview Simpleware Developers of world-leading image
Coupled Analysis of FSI
 Coupled Analysis of FSI Qin Yin Fan Oct. 11, 2008 Important Key Words Fluid Structure Interface = FSI Computational Fluid Dynamics = CFD Pressure Displacement Analysis = PDA Thermal Stress Analysis = TSA
Isogeometric Analysis of Fluid-Structure Interaction
 Isogeometric Analysis of Fluid-Structure Interaction Y. Bazilevs, V.M. Calo, T.J.R. Hughes Institute for Computational Engineering and Sciences, The University of Texas at Austin, USA e-mail: {bazily,victor,hughes}@ices.utexas.edu
[PDR03] RECOMMENDED CT-SCAN PROTOCOLS
![[PDR03] RECOMMENDED CT-SCAN PROTOCOLS](/thumbs/72/66454100.jpg "[PDR03] RECOMMENDED CT-SCAN PROTOCOLS") SURGICAL & PROSTHETIC DESIGN [PDR03] RECOMMENDED CT-SCAN PROTOCOLS WORK-INSTRUCTIONS DOCUMENT (CUSTOMER) RECOMMENDED CT-SCAN PROTOCOLS [PDR03_V1]: LIVE 1 PRESCRIBING SURGEONS Patient-specific implants,
SURGICAL & PROSTHETIC DESIGN [PDR03] RECOMMENDED CT-SCAN PROTOCOLS WORK-INSTRUCTIONS DOCUMENT (CUSTOMER) RECOMMENDED CT-SCAN PROTOCOLS [PDR03_V1]: LIVE 1 PRESCRIBING SURGEONS Patient-specific implants,
Kinematic Analysis of Lumbar Spine Undergoing Extension and Dynamic Neural Foramina Cross Section Measurement
 Copyright c 2008 ICCES ICCES, vol.7, no.2, pp.57-62 Kinematic Analysis of Lumbar Spine Undergoing Extension and Dynamic Neural Foramina Cross Section Measurement Yongjie Zhang 1,BoyleC.Cheng 2,ChanghoOh
Tomographic Reconstruction
 Tomographic Reconstruction 3D Image Processing Torsten Möller Reading Gonzales + Woods, Chapter 5.11 2 Overview Physics History Reconstruction basic idea Radon transform Fourier-Slice theorem (Parallel-beam)
Shadow casting. What is the problem? Cone Beam Computed Tomography THE OBJECTIVES OF DIAGNOSTIC IMAGING IDEAL DIAGNOSTIC IMAGING STUDY LIMITATIONS
 Cone Beam Computed Tomography THE OBJECTIVES OF DIAGNOSTIC IMAGING Reveal pathology Reveal the anatomic truth Steven R. Singer, DDS srs2@columbia.edu IDEAL DIAGNOSTIC IMAGING STUDY Provides desired diagnostic
Carestream s 2 nd Generation Metal Artifact Reduction Software (CMAR 2)
") Carestream s 2 nd Generation Metal Artifact Reduction Software (CMAR 2) Author: Levon Vogelsang Introduction Cone beam computed tomography (CBCT), or cone beam CT technology, offers considerable promise
Carestream s 2 nd Generation Metal Artifact Reduction Software (CMAR 2) Author: Levon Vogelsang Introduction Cone beam computed tomography (CBCT), or cone beam CT technology, offers considerable promise
Digital Image Processing
 Digital Image Processing SPECIAL TOPICS CT IMAGES Hamid R. Rabiee Fall 2015 What is an image? 2 Are images only about visual concepts? We ve already seen that there are other kinds of image. In this lecture
Using Finite Element simulations to reproduce rotational induced brain injury experiments: Recommendations for the future
 Using Finite Element simulations to reproduce rotational induced brain injury experiments: Recommendations for the future Master s Thesis in the Applied Mechanics JOEL HULTMAN Department of Applied Mechanics
11/18/ CPT Preauthorization Groupings Effective January 1, Computerized Tomography (CT) Abdomen 6. CPT Description SEGR CT01
 Abdomen 6. CPT Description SEGR CT01") Computerized Tomography (CT) 6 & 101 5 Upper Extremity 11 Lower Extremity 12 Head 3 Orbit 1 Sinus 2 Neck 4 7 Cervical Spine 8 Thoracic Spine 9 Lumbar Spine 10 Colon 13 CPT Description SEGR 74150 74160
Computerized Tomography (CT) 6 & 101 5 Upper Extremity 11 Lower Extremity 12 Head 3 Orbit 1 Sinus 2 Neck 4 7 Cervical Spine 8 Thoracic Spine 9 Lumbar Spine 10 Colon 13 CPT Description SEGR 74150 74160
SUPPLEMENTARY FILE S1: 3D AIRWAY TUBE RECONSTRUCTION AND CELL-BASED MECHANICAL MODEL. RELATED TO FIGURE 1, FIGURE 7, AND STAR METHODS.
 SUPPLEMENTARY FILE S1: 3D AIRWAY TUBE RECONSTRUCTION AND CELL-BASED MECHANICAL MODEL. RELATED TO FIGURE 1, FIGURE 7, AND STAR METHODS. 1. 3D AIRWAY TUBE RECONSTRUCTION. RELATED TO FIGURE 1 AND STAR METHODS
2008 International ANSYS Conference
 2008 International ANSYS Conference Patient-Specific Orthopedics Simulation Using ANSYS Technologies N. Hraiech, E. Malvesin and M. Rochette ANSYS France M. Viceconti and F. Taddei Istituti Ortopedici
Mathematical Modeling of Thoracolumbar Spine using ANSYS
 Mathematical Modeling of Thoracolumbar Spine using ANSYS Lee Kim Kheng, Qiu Tian Xia, Teo Ee Chon, Ng Hong Wan, Yang Kai Abstract NANYANG TECHNOLOGICAL UNIVERSITY Over the years, finite element method
µ = Pa s m 3 The Reynolds number based on hydraulic diameter, D h = 2W h/(w + h) = 3.2 mm for the main inlet duct is = 359
 = 3.2 mm for the main inlet duct is = 359") Laminar Mixer Tutorial for STAR-CCM+ ME 448/548 March 30, 2014 Gerald Recktenwald gerry@pdx.edu 1 Overview Imagine that you are part of a team developing a medical diagnostic device. The device has a millimeter
Laminar Mixer Tutorial for STAR-CCM+ ME 448/548 March 30, 2014 Gerald Recktenwald gerry@pdx.edu 1 Overview Imagine that you are part of a team developing a medical diagnostic device. The device has a millimeter
CT vs. VolumeScope: image quality and dose comparison
 CT vs. VolumeScope: image quality and dose comparison V.N. Vasiliev *a, A.F. Gamaliy **b, M.Yu. Zaytsev b, K.V. Zaytseva ***b a Russian Sci. Center of Roentgenology & Radiology, 86, Profsoyuznaya, Moscow,
Image Analysis, Geometrical Modelling and Image Synthesis for 3D Medical Imaging
 Image Analysis, Geometrical Modelling and Image Synthesis for 3D Medical Imaging J. SEQUEIRA Laboratoire d'informatique de Marseille - FRE CNRS 2246 Faculté des Sciences de Luminy, 163 avenue de Luminy,
Machine Learning for Medical Image Analysis. A. Criminisi
 Machine Learning for Medical Image Analysis A. Criminisi Overview Introduction to machine learning Decision forests Applications in medical image analysis Anatomy localization in CT Scans Spine Detection
CT IMAGE PROCESSING IN HIP ARTHROPLASTY
 U.P.B. Sci. Bull., Series C, Vol. 75, Iss. 3, 2013 ISSN 2286 3540 CT IMAGE PROCESSING IN HIP ARTHROPLASTY Anca MORAR 1, Florica MOLDOVEANU 2, Alin MOLDOVEANU 3, Victor ASAVEI 4, Alexandru EGNER 5 The use
Non-rigid 2D-3D image registration for use in Endovascular repair of Abdominal Aortic Aneurysms.
 RAHEEM ET AL.: IMAGE REGISTRATION FOR EVAR IN AAA. 1 Non-rigid 2D-3D image registration for use in Endovascular repair of Abdominal Aortic Aneurysms. Ali Raheem 1 ali.raheem@kcl.ac.uk Tom Carrell 2 tom.carrell@gstt.nhs.uk
Slide 1. Technical Aspects of Quality Control in Magnetic Resonance Imaging. Slide 2. Annual Compliance Testing. of MRI Systems.
 Slide 1 Technical Aspects of Quality Control in Magnetic Resonance Imaging Slide 2 Compliance Testing of MRI Systems, Ph.D. Department of Radiology Henry Ford Hospital, Detroit, MI Slide 3 Compliance Testing
Tutorial Week 4 Biomedical Modelling in Ansys Workbench (The Complete Guide with Anatomy and Implant)
") Tutorial Week 4 Biomedical Modelling in Ansys Workbench (The Complete Guide with Anatomy and Implant) Step 1: Create the Anatomical Model in ScanIP Import the DICOM files for the Proximal Femur dataset
Tutorial Week 4 Biomedical Modelling in Ansys Workbench (The Complete Guide with Anatomy and Implant) Step 1: Create the Anatomical Model in ScanIP Import the DICOM files for the Proximal Femur dataset
Ossa 3D User Manual. ios App v1.0.0
 Ossa 3D User Manual ios App v1.0.0 CONTENTS Description 3 Getting Started User Interface 4 Control Gestures 4 View Modes 5 Save Project 5 Settings Menu In-App Purchases 5 Enable Passcode 5 Page Tools View
MR IMAGE SEGMENTATION
 MR IMAGE SEGMENTATION Prepared by : Monil Shah What is Segmentation? Partitioning a region or regions of interest in images such that each region corresponds to one or more anatomic structures Classification
Enhanced material contrast by dual-energy microct imaging
 Enhanced material contrast by dual-energy microct imaging Method note Page 1 of 12 2 Method note: Dual-energy microct analysis 1. Introduction 1.1. The basis for dual energy imaging Micro-computed tomography
CPM Specifications Document Healthy Vertebral:
 CPM Specifications Document Healthy Vertebral: OSMSC 0078_0000, 0079_0000, 0166_000, 0167_0000 May 1, 2013 Version 1 Open Source Medical Software Corporation 2013 Open Source Medical Software Corporation.
VASCULAR TREE CHARACTERISTIC TABLE BUILDING FROM 3D MR BRAIN ANGIOGRAPHY IMAGES
 VASCULAR TREE CHARACTERISTIC TABLE BUILDING FROM 3D MR BRAIN ANGIOGRAPHY IMAGES D.V. Sanko 1), A.V. Tuzikov 2), P.V. Vasiliev 2) 1) Department of Discrete Mathematics and Algorithmics, Belarusian State
INDUSTRIAL SYSTEM DEVELOPMENT FOR VOLUMETRIC INTEGRITY
 INDUSTRIAL SYSTEM DEVELOPMENT FOR VOLUMETRIC INTEGRITY VERIFICATION AND ANALYSIS M. L. Hsiao and J. W. Eberhard CR&D General Electric Company Schenectady, NY 12301 J. B. Ross Aircraft Engine - QTC General
C E N T E R A T H O U S T O N S C H O O L of H E A L T H I N F O R M A T I O N S C I E N C E S. Image Operations II
 T H E U N I V E R S I T Y of T E X A S H E A L T H S C I E N C E C E N T E R A T H O U S T O N S C H O O L of H E A L T H I N F O R M A T I O N S C I E N C E S Image Operations II For students of HI 5323
FEMORAL STEM SHAPE DESIGN OF ARTIFICIAL HIP JOINT USING A VOXEL BASED FINITE ELEMENT METHOD
 FEMORAL STEM SHAPE DESIGN OF ARTIFICIAL HIP JOINT USING A VOXEL BASED FINITE ELEMENT METHOD Taiji ADACHI *, Hiromichi KUNIMOTO, Ken-ichi TSUBOTA #, Yoshihiro TOMITA + Graduate School of Science and Technology,
The Quantification of Volumetric Asymmetry by Dynamic Surface Topography. Thomas Shannon Oxford Brookes University Oxford, U.K.
 The Quantification of Volumetric Asymmetry by Dynamic Surface Topography Thomas Shannon Oxford Brookes University Oxford, U.K. The psychosocial impact of the cosmetic defect on Adolescent Idiopathic Scoliosis
A closer look at CT scanning
 Vet Times The website for the veterinary profession https://www.vettimes.co.uk A closer look at CT scanning Author : Charissa Lee, Natalie Webster Categories : General, Vets Date : April 3, 2017 A basic
Geometry From Imaging Data
 Zhang et al. 2004 Geometry From Imaging Data Part II: Geometry Reconstruction Computational Biomechanics Summer Term 2016 Lecture 5/12 Frank Niemeyer Geometry Reconstruction Starting Point Note: intentionally
David Wagner, Kaan Divringi, Can Ozcan Ozen Engineering
 Internal Forces of the Femur: An Automated Procedure for Applying Boundary Conditions Obtained From Inverse Dynamic Analysis to Finite Element Simulations David Wagner, Kaan Divringi, Can Ozcan Ozen Engineering
Modelling a Lamb Hind Leg
 Modelling a Lamb Hind Leg Joanne P. Crocombe Ross D. Clarke MIRINZ Food Technology & Research East Street (Ruakura Campus), PO Box 617 HAMILTON, NEW ZEALAND Andrew J. Pullan Department of Engineering Science
Biomedical Image Processing for Human Elbow
 Biomedical Image Processing for Human Elbow Akshay Vishnoi, Sharad Mehta, Arpan Gupta Department of Mechanical Engineering Graphic Era University Dehradun, India akshaygeu001@gmail.com, sharadm158@gmail.com
icatvision Quick Reference
 icatvision Quick Reference Navigating the i-cat Interface This guide shows how to: View reconstructed images Use main features and tools to optimize an image. REMINDER Images are displayed as if you are
quality and performance in automatic mesh generation
 quality and performance in automatic mesh generation www.beta-cae.com ANSA, combining the automatic geometry healing with the automated middle skin extraction and the Batch Meshing, offers the most efficient
Simpleware: Converting 3D Images into Computational Models. David Harman (Application Engineer)
") Simpleware: Converting 3D Images into Computational Models David Harman (Application Engineer) d.harman@simpleware.com Introduction Simpleware: The Company Developers of industry-leading software solutions
Simpleware: Converting 3D Images into Computational Models David Harman (Application Engineer) d.harman@simpleware.com Introduction Simpleware: The Company Developers of industry-leading software solutions
BioIRC solutions. CFDVasc manual
 BioIRC solutions CFDVasc manual Main window of application is consisted from two parts: toolbar - which consist set of button for accessing variety of present functionalities image area area in which is
Extraction and recognition of the thoracic organs based on 3D CT images and its application
 1 Extraction and recognition of the thoracic organs based on 3D CT images and its application Xiangrong Zhou, PhD a, Takeshi Hara, PhD b, Hiroshi Fujita, PhD b, Yoshihiro Ida, RT c, Kazuhiro Katada, MD
Volume Illumination and Segmentation
 Volume Illumination and Segmentation Computer Animation and Visualisation Lecture 13 Institute for Perception, Action & Behaviour School of Informatics Overview Volume illumination Segmentation Volume
A Workflow for Computational Fluid Dynamics Simulations using Patient-Specific Aortic Models
 2.8.8 A Workflow for Computational Fluid Dynamics Simulations using Patient-Specific Aortic Models D. Hazer 1,2, R. Unterhinninghofen 2, M. Kostrzewa 1, H.U. Kauczor 3, R. Dillmann 2, G.M. Richter 1 1)
Lecture 8 Object Descriptors
 Lecture 8 Object Descriptors Azadeh Fakhrzadeh Centre for Image Analysis Swedish University of Agricultural Sciences Uppsala University 2 Reading instructions Chapter 11.1 11.4 in G-W Azadeh Fakhrzadeh
Semi-Automatic Detection of Cervical Vertebrae in X-ray Images Using Generalized Hough Transform
 Semi-Automatic Detection of Cervical Vertebrae in X-ray Images Using Generalized Hough Transform Mohamed Amine LARHMAM, Saïd MAHMOUDI and Mohammed BENJELLOUN Faculty of Engineering, University of Mons,
Supplementary Materials for
 advances.sciencemag.org/cgi/content/full/4/1/eaao7005/dc1 Supplementary Materials for Computational discovery of extremal microstructure families The PDF file includes: Desai Chen, Mélina Skouras, Bo Zhu,
Whole Body MRI Intensity Standardization
 Whole Body MRI Intensity Standardization Florian Jäger 1, László Nyúl 1, Bernd Frericks 2, Frank Wacker 2 and Joachim Hornegger 1 1 Institute of Pattern Recognition, University of Erlangen, {jaeger,nyul,hornegger}@informatik.uni-erlangen.de
Corso di laurea in Fisica A.A Fisica Medica 4 TC
 Corso di laurea in Fisica A.A. 2007-2008 Fisica Medica 4 TC Computed Tomography Principles 1. Projection measurement 2. Scanner systems 3. Scanning modes Basic Tomographic Principle The internal structure
Reasoning Boolean Operation for Modeling, Simulation and Fabrication of Heterogeneous Objects. Abstract
 Reasoning Boolean Operation for Modeling, Simulation and Fabrication of Heterogeneous Objects X. Hu, T. Jiang, F. Lin, and W. Sun Department of Mechanical Engineering and Mechanics, Drexel University,
Visualisation : Lecture 1. So what is visualisation? Visualisation
 So what is visualisation? UG4 / M.Sc. Course 2006 toby.breckon@ed.ac.uk Computer Vision Lab. Institute for Perception, Action & Behaviour Introducing 1 Application of interactive 3D computer graphics to
This exercise uses one anatomical data set (ANAT1) and two functional data sets (FUNC1 and FUNC2).
 and two functional data sets (FUNC1 and FUNC2).") Exploring Brain Anatomy This week s exercises will let you explore the anatomical organization of the brain to learn some of its basic properties, as well as the location of different structures. The human
Exploring Brain Anatomy This week s exercises will let you explore the anatomical organization of the brain to learn some of its basic properties, as well as the location of different structures. The human
Simulation of Curtain Airbag with Arbitrary. Eulerian- Lagrangian Method
 Simulation of Curtain Airbag with Arbitrary Eulerian- Lagrangian Method Dmitri Fokin, Eivind Dessarud Altair Engineering Claes Ljungqvist Saab Automobile AB Abstract: Computer simulation is a powerful
FINITE ELEMENT EVALUATION OF THE MECHANICAL BEHAVIOUR OF A DETAILED FOOT/FOOTWEAR MODEL
 Proceedings of the 6th International Conference on Mechanics and Materials in Design, Editors: J.F. Silva Gomes & S.A. Meguid, P.Delgada/Azores, 26-3 July 215 PAPER REF: 5479 FINITE ELEMENT EVALUATION
Potsdam Propeller Test Case (PPTC)
") Second International Symposium on Marine Propulsors smp 11, Hamburg, Germany, June 2011 Workshop: Propeller performance Potsdam Propeller Test Case (PPTC) Olof Klerebrant Klasson 1, Tobias Huuva 2 1 Core
Second International Symposium on Marine Propulsors smp 11, Hamburg, Germany, June 2011 Workshop: Propeller performance Potsdam Propeller Test Case (PPTC) Olof Klerebrant Klasson 1, Tobias Huuva 2 1 Core
Frequency split metal artifact reduction (FSMAR) in computed tomography
 in computed tomography") The Johns Hopkins University Advanced Computer Integrated Surgery Group 4 Metal Artifact Removal in C-arm Cone-Beam CT Paper Seminar Critical Review of Frequency split metal artifact reduction (FSMAR)
The Johns Hopkins University Advanced Computer Integrated Surgery Group 4 Metal Artifact Removal in C-arm Cone-Beam CT Paper Seminar Critical Review of Frequency split metal artifact reduction (FSMAR)
C a t p h a n / T h e P h a n t o m L a b o r a t o r y
 C a t p h a n 5 0 0 / 6 0 0 T h e P h a n t o m L a b o r a t o r y C a t p h a n 5 0 0 / 6 0 0 Internationally recognized for measuring the maximum obtainable performance of axial, spiral and multi-slice
NUMERICAL INVESTIGATION OF THE FLOW BEHAVIOR INTO THE INLET GUIDE VANE SYSTEM (IGV)
") University of West Bohemia» Department of Power System Engineering NUMERICAL INVESTIGATION OF THE FLOW BEHAVIOR INTO THE INLET GUIDE VANE SYSTEM (IGV) Publication was supported by project: Budování excelentního
University of West Bohemia» Department of Power System Engineering NUMERICAL INVESTIGATION OF THE FLOW BEHAVIOR INTO THE INLET GUIDE VANE SYSTEM (IGV) Publication was supported by project: Budování excelentního
Simulating Sinkage & Trim for Planing Boat Hulls. A Fluent Dynamic Mesh 6DOF Tutorial
 Simulating Sinkage & Trim for Planing Boat Hulls A Fluent Dynamic Mesh 6DOF Tutorial 1 Introduction Workshop Description This workshop describes how to perform a transient 2DOF simulation of a planing
Simulation-Based Airbag Folding System JFOLD Version 2 -New Capabilities and Folding Examples
 Simulation-Based Airbag Folding System JFOLD Version 2 -New Capabilities and Folding Examples Shinya Hayashi 1, Richard Taylor 2 1 JSOL Corporation 2 Arup 2-18-25 Marunouchi, Naka-ku, Nagoya, Aichi, 460-0002,
Motion artifact detection in four-dimensional computed tomography images
 Motion artifact detection in four-dimensional computed tomography images G Bouilhol 1,, M Ayadi, R Pinho, S Rit 1, and D Sarrut 1, 1 University of Lyon, CREATIS; CNRS UMR 5; Inserm U144; INSA-Lyon; University
Automatic segmentation of the cortical grey and white matter in MRI using a Region Growing approach based on anatomical knowledge
 Automatic segmentation of the cortical grey and white matter in MRI using a Region Growing approach based on anatomical knowledge Christian Wasserthal 1, Karin Engel 1, Karsten Rink 1 und André Brechmann
MODELLING OF PROSTHETIC HIP JOINT GENERATED FROM CT SCAN DATA Mahender Koduri 1, G Krishna Teja 2, O Rajender 3 1,2,3
 MODELLING OF PROSTHETIC HIP JOINT GENERATED FROM CT SCAN DATA Mahender Koduri 1, G Krishna Teja 2, O Rajender 3 1,2,3 Asst. Professor, Dept. of Mech. Engg. AGI ABSTRACT Total hip arthroplasty is a surgical
TOLERANCE ANALYSIS OF THIN-WALL CFRP STRUCTURAL ELEMENTS USING TOMOGRAPHIC IMAGING
 Proceedings of the 6th International Conference on Mechanics and Materials in Design, Editors: J.F. Silva Gomes & S.A. Meguid, P.Delgada/Azores, 26-30 July 2015 PAPER REF: 5495 TOLERANCE ANALYSIS OF THIN-WALL
Supplementary methods
 Supplementary methods This section provides additional technical details on the sample, the applied imaging and analysis steps and methods. Structural imaging Trained radiographers placed all participants
A Hybrid Method for Haemorrhage Segmentation in Trauma Brain CT
 SOLTANINEJAD ET AL.: HAEMORHAGE SEGMENTATION IN BRAIN CT 1 A Hybrid Method for Haemorrhage Segmentation in Trauma Brain CT Mohammadreza Soltaninejad 1 msoltaninejad@lincoln.ac.uk Tryphon Lambrou 1 tlambrou@lincoln.ac.uk
Computational Simulation of the Wind-force on Metal Meshes
 16 th Australasian Fluid Mechanics Conference Crown Plaza, Gold Coast, Australia 2-7 December 2007 Computational Simulation of the Wind-force on Metal Meshes Ahmad Sharifian & David R. Buttsworth Faculty
Whole Body Submillimeter Scan
 128 Whole Body Submillimeter Scan The real value of 64ch/128slice CT systems does not come from the ability to perfom cardiac scans but the capability to scan all parts of the body in high definition submillimeter
Copyright 2017 Medical IP - Tutorial Medip v /2018, Revision
 Copyright 2017 Medical IP - Tutorial Medip v.1.0.0.9 01/2018, Revision 1.0.0.2 List of Contents 1. Introduction......................................................... 2 2. Overview..............................................................
DUE to beam polychromacity in CT and the energy dependence
 1 Empirical Water Precorrection for Cone-Beam Computed Tomography Katia Sourbelle, Marc Kachelrieß, Member, IEEE, and Willi A. Kalender Abstract We propose an algorithm to correct for the cupping artifact
Life Sciences Applications: Modeling and Simulation for Biomedical Device Design SGC 2013
 Life Sciences Applications: Modeling and Simulation for Biomedical Device Design Kristian.Debus@cd-adapco.com SGC 2013 Modeling and Simulation for Biomedical Device Design Biomedical device design and
A Study of Medical Image Analysis System
 Indian Journal of Science and Technology, Vol 8(25), DOI: 10.17485/ijst/2015/v8i25/80492, October 2015 ISSN (Print) : 0974-6846 ISSN (Online) : 0974-5645 A Study of Medical Image Analysis System Kim Tae-Eun
FINDING THE TRUE EDGE IN CTA
 FINDING THE TRUE EDGE IN CTA by: John A. Rumberger, PhD, MD, FACC Your patient has chest pain. The Cardiac CT Angiography shows plaque in the LAD. You adjust the viewing window trying to evaluate the stenosis
Histograms. h(r k ) = n k. p(r k )= n k /NM. Histogram: number of times intensity level rk appears in the image
 = n k. p(r k )= n k /NM. Histogram: number of times intensity level rk appears in the image") Histograms h(r k ) = n k Histogram: number of times intensity level rk appears in the image p(r k )= n k /NM normalized histogram also a probability of occurence 1 Histogram of Image Intensities Create
Histograms h(r k ) = n k Histogram: number of times intensity level rk appears in the image p(r k )= n k /NM normalized histogram also a probability of occurence 1 Histogram of Image Intensities Create
Aerodynamic Study of a Realistic Car W. TOUGERON
 Aerodynamic Study of a Realistic Car W. TOUGERON Tougeron CFD Engineer 2016 Abstract This document presents an aerodynamic CFD study of a realistic car geometry. The aim is to demonstrate the efficiency
Counting Particles or Cells Using IMAQ Vision
 Application Note 107 Counting Particles or Cells Using IMAQ Vision John Hanks Introduction To count objects, you use a common image processing technique called particle analysis, often referred to as blob
Fundamentals of CT imaging
 SECTION 1 Fundamentals of CT imaging I History In the early 1970s Sir Godfrey Hounsfield s research produced the first clinically useful CT scans. Original scanners took approximately 6 minutes to perform
Development of Cranium Using Mimics and Rapid Prototyping Using ANSYS
 Development of Cranium Using Mimics and Rapid Prototyping Using ANSYS Sadhasivam.C 1, Sai Krishna Gunda 2 1 Assistant Professor, Department of Mechanical Engineering, Saveetha School of Engineering, Saveetha
Computer-Aided Diagnosis in Abdominal and Cardiac Radiology Using Neural Networks
 Computer-Aided Diagnosis in Abdominal and Cardiac Radiology Using Neural Networks Du-Yih Tsai, Masaru Sekiya and Yongbum Lee Department of Radiological Technology, School of Health Sciences, Faculty of
PARALLEL ENGINEERING SIMULATIONS BASED ON FORMING SIMULATION OF A HEAT EXCHANGER PLATE
 PARALLEL ENGINEERING SIMULATIONS BASED ON FORMING SIMULATION OF A HEAT EXCHANGER PLATE Gabrielson P.*, Thuvesen D.** * Alfa Laval Lund AB Box 74, S-221 00 LUND, Sweden & Div. of Production and Materials
Spiral CT. Protocol Optimization & Quality Assurance. Ge Wang, Ph.D. Department of Radiology University of Iowa Iowa City, Iowa 52242, USA
 Spiral CT Protocol Optimization & Quality Assurance Ge Wang, Ph.D. Department of Radiology University of Iowa Iowa City, Iowa 52242, USA Spiral CT Protocol Optimization & Quality Assurance Protocol optimization
GPU Based Region Growth and Vessel Tracking. Supratik Moulik M.D. Jason Walsh
 GPU Based Region Growth and Vessel Tracking Supratik Moulik M.D. (supratik@moulik.com) Jason Walsh Conflict of Interest Dr. Supratik Moulik does not have a significant financial stake in any company, nor
Organ Surface Reconstruction using B-Splines and Hu Moments
 Organ Surface Reconstruction using B-Splines and Hu Moments Andrzej Wytyczak-Partyka Institute of Computer Engineering Control and Robotics, Wroclaw University of Technology, 27 Wybrzeze Wyspianskiego
Mirrored LH Histograms for the Visualization of Material Boundaries
 Mirrored LH Histograms for the Visualization of Material Boundaries Petr Šereda 1, Anna Vilanova 1 and Frans A. Gerritsen 1,2 1 Department of Biomedical Engineering, Technische Universiteit Eindhoven,
CT Basics Principles of Spiral CT Dose. Always Thinking Ahead.
 1 CT Basics Principles of Spiral CT Dose 2 Who invented CT? 1963 - Alan Cormack developed a mathematical method of reconstructing images from x-ray projections Sir Godfrey Hounsfield worked for the Central
3D Volume Mesh Generation of Human Organs Using Surface Geometries Created from the Visible Human Data Set
 3D Volume Mesh Generation of Human Organs Using Surface Geometries Created from the Visible Human Data Set John M. Sullivan, Jr., Ziji Wu, and Anand Kulkarni Worcester Polytechnic Institute Worcester,
CFD simulations of blood flow through abdominal part of aorta
 CFD simulations of blood flow through abdominal part of aorta Andrzej Polanczyk, Aleksandra Piechota Faculty of Process and Enviromental Engineering, Technical University of Lodz, Wolczanska 13 90-94 Lodz,
Volumetric Analysis of the Heart from Tagged-MRI. Introduction & Background
 Volumetric Analysis of the Heart from Tagged-MRI Dimitris Metaxas Center for Computational Biomedicine, Imaging and Modeling (CBIM) Rutgers University, New Brunswick, NJ Collaboration with Dr. Leon Axel,
Computer Graphics 1. Chapter 2 (May 19th, 2011, 2-4pm): 3D Modeling. LMU München Medieninformatik Andreas Butz Computergraphik 1 SS2011
: 3D Modeling. LMU München Medieninformatik Andreas Butz Computergraphik 1 SS2011") Computer Graphics 1 Chapter 2 (May 19th, 2011, 2-4pm): 3D Modeling 1 The 3D rendering pipeline (our version for this class) 3D models in model coordinates 3D models in world coordinates 2D Polygons in
Computer Graphics 1 Chapter 2 (May 19th, 2011, 2-4pm): 3D Modeling 1 The 3D rendering pipeline (our version for this class) 3D models in model coordinates 3D models in world coordinates 2D Polygons in
Computer-Tomography II: Image reconstruction and applications
 Computer-Tomography II: Image reconstruction and applications Prof. Dr. U. Oelfke DKFZ Heidelberg Department of Medical Physics (E040) Im Neuenheimer Feld 280 69120 Heidelberg, Germany u.oelfke@dkfz.de