CHAPTER 3 BLOOD VESSEL SEGMENTATION
|
|
|
- Oswald Walton
- 6 years ago
- Views:
Transcription
1 47 CHAPTER 3 BLOOD VESSEL SEGMENTATION Blood vessels are an internal part of the blood circulatory system and they provide the nutrients to all parts of the eye. In retinal image, blood vessel appears darker than background due to its lower reflectance compared to other retinal surfaces. Extraction of retinal vascular tree is mainly used in diagnosing the pathological features during automatic retinal screening systems. Identification of anatomical features such as OD center, macula and pathological features such as microaneurysms, exudates, hemorrhages, drusen etc., can be easily performed after the blood vessel segmentation. In this research work, blood vessel segmentation is carried out in various stages like preprocessing, grey level enhancement and segmentation. In the preprocessing stage, the green band of the retinal image is separated and smoothened by adopting mean filter. In order to increase the contrast of the image, Contrast Limited Adaptive Histogram Equalization (CLAHE) is employed. Hence, the segmentation of the blood vessels is performed by Krisch matched filter and the results are not up to the expectation and small vessels could not be segmented. Hence, the work is extended in segmenting blood vessels accurately using matched-filter with thresholding techniques. The Local Entropy Thresholding (LET) and Spatially Weighted Fuzzy C Means (SWFCM) are employed. Further, morphological processing is employed to segment small blood vessels. In this case, small blood vessels are segmented to some extent. The entire process is schematically illustrated as a flow diagram in Figure 3.1.
2 48 Retinal Image Red Band Green Band Blue Band Preprocessing Kirsch matched Filter Matched Filter Morphological Approach Local Entropy Thresholding Spatially Weighted Fuzzy C means Blood Vessel Segmentation and Parametric Measures Figure 3.1 Flow diagram for blood vessel segmentation The images from DRIVE data base is used for testing the effectiveness of the techniques. The segmented results are compared with ground truth images available in the same database for its sensitivity, specificity and accuracy of various methods. The blood vessels are segmented successfully to the required level and the results are presented. The various stages adopted for segmentation are briefed in the following subsections.
3 PREPROCESSING In general, the images are obtained at discrete spatial and temporal intervals. It includes noises and a small amount of image blur. Image distortions may also occur due to defocusing, color shift, uneven magnification, scratches and dust. The principal objective is to remove the above mentioned unwanted features from the image before further processing. The separation of green band and application of mean filter are briefed in the forthcoming subsections Separation of Color Bands The images in the standard retinal database have usually in Red, Green and Blue (RGB) color space and each color pixel is a triplet of three color components. The RGB color images will have the format of M x N x 3 arrays of color pixels where M and N represent the number of rows and columns and digit 3 represents the RGB color space. These three color spaces can be separated into three independent color components such as Red Band (RB), Green Band (GB) and Blue Band (BB) using the MATLAB commands. The selected image from the standard database is separated into RB, GB and BB images. The original color image is shown in Figure 3.2 (a) and the resultant images after separation of color bands are illustrated in

 Green (d) Blue")
4 (a) (b) (c) (d) Figure 3.2 Separation of color bands (a)input image (b) Red (c) Green (d) Blue 50
 and (b) respectively. (a) (b) Figure 3.3 Resultant image after the application of mean filter (a) Green band of original image (b) Resultant image of mean filter 3.1.")
5 51 by the average level in the neighborhood by the 5x5 filter mask. The green band of the original image and the resultant image after application of mean filter are shown in Figures 3.3 (a) and (b) respectively. (a) (b) Figure 3.3 Resultant image after the application of mean filter (a) Green band of original image (b) Resultant image of mean filter Contrast Enhancement In order to segment blood vessels, the contrast of the mean filtered image has to be enhanced. There are several contrast enhancement methods available like histogram equalization, adaptive histogram equalization, Contrast Limited Adaptive Histogram Equalization (CLAHE) etc. As CLAHE method has been successfully employed for retinal images by several authors and has yielded agreeable results, in the present work, the CLAHE algorithm has been employed. CLAHE operates on small data regions (tiles) rather than the entire image and it improves the contrast of each tile till the predetermined level is reached for the entire tile. Figure 3.4. shows the resultant image after application of the CLAHE.

6 52 Figure 3.4 Contrast enhanced image after application of CLAHE 3.2 KIRSCH MATCHED FILTER The segmentation of blood vessels is attempted using the matchedfilter proposed by Banumathi et al (2003). It is a first order derivative operator, normally used for edge detection in images. The pre-processed image is used for further processing by rotating the Kirsch operator at 45 degree increments in all eight directions like North, NorthWest, West, Southwest, South, SouthEast, East and NorthEast directions for detecting edges of the retinal images. The kernels for the corresponding eight different directions are shown in Figure 3.5. Figure 3.5 Eight kernels used in Kirsch matched filter


 (b) (c) (d) (e) (f) (g) (h) Figure 3.")
 North (b) Northwest (c)")


 to (b). Figure 3.")
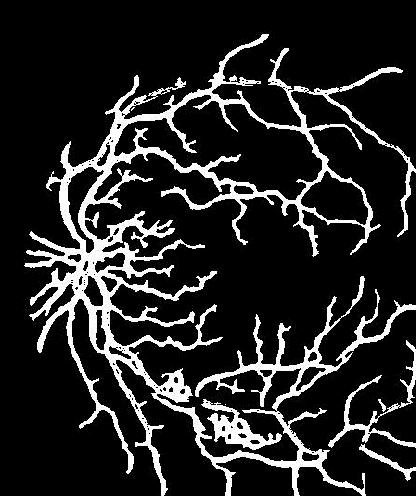
7 53 These directional templates are used to convolve over the preprocessed retinal image to segment the blood vessel. Eight different templates are used to convolve each and every pixel of the retinal image and the resultant images of each template are shown in Figures 3.6(a) to (h). (a) (b) (c) (d) (e) (f) (g) (h) Figure 3.6 Resultant image after application of the eight different kernels of Kirsch matched filter (a) North (b) Northwest (c) West(d) Southwest (e) South (f) Southeast (g) East (h) Northeast Each of the eight derivative kernels is applied to the filtered image and gradient is computed to retain the maximum value across all directions. The largest gradient among different directions is set as the final gradient. Gradient that has the largest value shows the blood vessel and this is shown in Figures 3.7(a) to (b). Figure 3.7 (a) shows the segmented vessel using Kirsch matched filter and (b) shows the complemented image of the segmented vessel.

8 54 (a) Figure 3.7 Segmented blood vessels using Kirsch matched filter (b) In this work, segmentation algorithm is evaluated in terms of accuracy, sensitivity and specificity. These terms can best be understood with the standards followed universally with regard to medical images. The test result may be positive and negative indicating the presence of disease and absence of the disease respectively. The term Gold standard refers to the exact possibility of presence or absence of the disease. Further, the conditions such as True Positive (TP), False Positive (FP), False Negative (FN) and True Negative (TN) refer to the presence or absence of the disease in the predicted images. The definitions of the above terms are given below. True Positive (TP) : In this condition, the result of the test outcome is positive and the gold standard condition also is positive. True Negative (TN) : Both the test outcome and gold standard represent negative. False Positive (FP) : The test outcome is positive but the gold standard refers to negative. False Negative (FN) : The test outcome is negative but the gold standard refers to positive.
9 55 All the above conditions related to test outcome and gold standards are illustrated in Table 3.1 shown below. Table 3.1 Conditions showing TP, TN, FP and FN Test Gold standard Condition Outcome Positive Negative Positive True Positive (TP) False Positive (FP) Negative False Negative (FN) True Negative (TN) The sensitivity, specificity and accuracy are predicted using the above conditions for the medical images as shown below. Sensitivity (SE): It measures the ability of a test to predict the test outcome condition when the gold standard condition is positive as given in Equation (3.1). (e.g. The percentage of abnormal condition in gold standard is also identified as abnormal condition in the test condition.). TP Sensitivit y( SE) (3.1) TP FN Specificity (SPE): It measures the ability of a test to predict the test outcome condition as negative when the gold standard condition refers to negative as given in Equation (3.2) (e.g. The percentage of normal condition in gold standard is also identified as normal condition in the test condition). TN Specificit y( SPE ) (3.2) TN FP Accuracy (ACC): The accuracy is the proportion of true results (both true positives and true negatives) as given in Equation (3.3).
10 56 TP TN Accuracy ( ACC) (3.3) TP FN TN FP The performance of the Kirsch matched filter in segmenting retinal blood vessels is evaluated using the color fundus images from DRIVE database. It is performed against the manually segmented retinal vessels from the 1 st observer of DRIVE database which is taken as ground truth for blood vessels. The observed values for the performance parameter TP, FP, FN and TN are given in terms of number of pixels. SE, SPE and ACC values are in terms of percentage and the processing time in seconds are given in Table 3.2. Table 3.2 Performance measure values for Kirsch matched filter Kirsch Matched filter Sl.No Image Number of pixels Percentage Time ID TP FP FN TN SE SPE ACC Sec 1 01_test _test _test _test _test _test _test _test _test _test _test _test _test _test _test _test _test _test _test _test
11 57 The parametric values in the table infer that the sensitivity value for the 18 out of 20 images is less than 50% and segmentation accuracy is 90%. The lowest sensitivity level is due to inadequacy of the Kirsch matched filter method for segmenting minor blood vessels. Processing time for segmentation is nearly 3 seconds. Further, the clarity of the segmentation is also not up to the level for employing it to the automated screening. A perfect predictor would be described as 100% sensitivity (i.e. predicting all images from the abnormal group as abnormal) and 100% specificity (i.e. not predicting anyone from the normal as abnormal). To improve the sensitivity and accuracy value of the segmentation, the work is extended using matched filter. 3.3 MATCHED FILTER Matched filter is designed to perform segmentation based on the geometric properties of the region of interest. In general, three important properties of blood vessels are considered to segment vessel structure in retinal images and they are given below. Curvature of blood vessels Lower reflectance Gradual decrease of vessel width The blood vessels in retinal images usually have curvatures and may be approximated by piecewise linear segments. It also has lower reflectance and appears darker compared to its background. The width of a vessel also decreases gradually from OD. The variation of the intensity profile of the vessel may be approximated by a Gaussian curve, and this property is used to segment the blood vessels with the help of two dimensional template
12 58 matching techniques. The following matched filter kernel expression that is referred by kande et al (2007) is adopted. 2 x L K i x, y exp Y (3.4) K i (x,y) is the Gaussian kernel where, L is the length of the segment for which the vessel is assumed to have a fixed orientation. Y is the direction of the vessel assumed to be aligned along y axis, and is the spread of intensity profile. Blood vessels in retinal image may be oriented at any direction. Hence, the blood vessels can be located by rotating the kernel in all directions over the entire image. As the angular resolution is assumed as 15 degree, the kernel needs to be rotated for 12 steps to cover the entire image. The steps can be increased by assuming the resolution as less than 15 degrees to precisely segment the vessels but that will increase the computation time. However, the resolution of 15 degrees is found to be optimum in segmenting the blood vessels that was used by most of the researchers in the area of image processing to segment the blood vessel. The Gaussion kernel with interval (-6, 6) and = 2 is used. The negative sign of the kernel indicates that the vessels are darker than the background. Gaussion kernel is inverted by subtracting each value from its maximum value for further processing. The above process is illustrated using a sample image (im0077 of STARE data base). A set of twelve 15x16 pixel kernels is applied by convolving to each pixel of fundus image and then the maximum of their responses is retained. Figures 3.8 (a) to (l) show the resultant image after convolution between the kernel and the image with 15 degree angular
 (b) (c) (d) (e) (f) (g) (h) (i) (j) (k) (l) Figure 3.")
13 59 resolution. Maximum response of the above images are considered to get the enhanced blood vessel image. Figure 3.9 shows the resultant image after the application of the matched filter. (a) (b) (c) (d) (e) (f) (g) (h) (i) (j) (k) (l) Figure 3.8 Resultant image of 15 degree angular resolution (a) 15 o (b) 30 o (c) 45 o (d) 60 o (e) 75 o (f) 90 o (g) 105 o (h) 120 o (i) 135 o (j) 150 o (k) 165 o (l) 180 o Figure 3.9 Resultant image of matched filter
14 60 Thus the matched filter is applied to segment the blood vessels. However, it needs further processing to remove the unwanted information. The resultant image of the matched filter is further subjected to thresholding technique to eliminate the redundant and unwanted details Thresholding Thresholding is an important technique in image segmentation, enhancement and object detection. In general, thresholding techniques are based on gray level. In general, these techniques are using global or local gray level values of an image. Two types of thresholding techniques like local entropy thresholding and spatially weighted fuzzy c means are employed in the present work on the resultant image from the matched filter technique. These techniques are briefed in the forthcoming sections Local entropy thresholding technique Spatial distribution of gray level is very important for blood vessel segmentation because in an image, pixel intensities are dependent on each other. The gray level variation within object or background is called as local entropy. The gray level variation between object and background is called joint entropy. It is used for spatial distribution of gray levels because image pixel intensities are not independent of each other. Local entropy-based methods adopt the threshold value on each pixel. A retinal image filtered by a set of Gaussian filters with different angular orientations have enhanced blood vessel and it is ready to adopt local entropy threshold scheme in order to extract the vessels from the background. The first step in entropy threshold is creating a gray level co-occurrence matrix in order to choose the threshold value as proposed by Chanwimaluang (2006) and is explained in the next section.
15 Gray level co-occurrence matrix (GLCM) The Gray Level Co-Occurrence Matrix (GLCM) is a square matrix of size P Q. The gray scale image I of spatial dimension M N with gray levels in the range of [0, 1,2 (L-1)] where L is the maximum possible gray level. GLCM is denoted as transition matrix (T) and is denoted by the Equation (3.5). T= [t ij ] P Q, (3.5) where t ij transition intensities between the adjacent pixels. In the co-occurrence matrix, the pixel with gray level between i and j is followed either by moving from top left corner of the matrix towards horizontally right or vertically lower transitions. The transition intensity t ij is given by the following Equation (3.6). t ij M N m 1 n 1 m, n (3.6) where, - threshold value is defined as 1, if f f m, n m, n iandf iandf m, n 1 m 1, n j j 0, otherwise The total number of transitions in the co-occurrence matrix, a desired transition probability of gray level i and j, can be written as follows ti, j Pi, j (3.7) L L t i 1 j 1 i, j
16 62 If s, (0 L-1) is the threshold, then based on the values of s, partition is done over the co-occurrence matrix into 4 Quadrants as A, B, C and D as shown in the Figure 3.10 depending on the gray level variation within the zones of the object and the background. 0 s L-1 A B s D C L-1 Figure 3.10 Quadrents of gray level co-occurence matrix Quadrant A and C represent gray level transition within the object and the background respectively. The variation of gray level transition between the object and the background and the object boundary is placed in quadrant B and D. The above four zones can be further grouped into two classes as local ( A and C ) and joint ( B and D ) quadrants. The GLCM of the resultant image after the application of the matched filter as shown in Figure 3.12 (a) illustrates the gray level co- occurrence of the vessel pixels lying in the quadrant A and C only. Hence, the local entropy threshold is calculated considering only quadrants A and C. The probabilities and normalization of object in the quadrant A and background C are given by the Equations (3.8), (3.9), (3.10) and (3.11) respectively and are given below.
17 63 S S PA Pij i 0 j 0 (3.8) L 1 L C Pij i S 1 j S 1 1 P (3.9) P A ij P P ij A i S t ij S t ij 0 j 0 (3.10) P C ij P P ij C L 1 t ij L 1 i S 1 j S 1 t ij (3.11) The entropy calculation of an object and background using shanon s entropy formula Yong et al (2004) is given by Equations (3.12) and (3.13) with appropriate limits H 1 S S A A ( S ) P log A i j 2 P (3.12), i, j 2 i 0 j 0 H 1 L 1 L 1 C C ( S ) P log C i, j 2 Pi, j 2 i S 1 j S 1 (3.13) The total entropy is calculated by the summation of the entropy of an object and background as shown below in Equation(3.14) and it gives the optimal threshold value of an image. H H H ( S) ( S) ( S) T A C (3.14) The above thresholding techique is applied to the resultant image of matched filter image and the results are shown in Figures 3.11 (a) to (d).
 Distribution of graylevelcooccurance matrix (b) Resultant")

18 64 (a) (b) (c) (d) Figure 3.11 Blood vessel segmentation using LET after matched filter (a) Distribution of graylevelcooccurance matrix (b) Resultant image after application of entropy thresholding (c) mask (d) Segmented vessel In order to fix the boundary, matched filter with entropic thresholding method is implemented to segment the bloodvessel in retinal image. This method clearly segments the vascular structure of the retina image. However, it is not suitable to minute vessel in the image.
19 65 In order to limit the boundaries and to remove the unwanted information beyond the specified boundary, the background mask is generated by the application of threshold to the GB image. In the mask generation process, all the pixels with gray level above 45 in the GB image are converted into 255. This initially developed mask is dilated by 10 pixels to compensate for intermediate shades and false negatives within the initial mask. Figure 3.11 (c) shows the mask of the input image. In order to segment vessels in a better manner, connected component labeling filtering is applied and it scans image pixels one by one and groups them into components based on pixel connectivity. The label filtering tries to isolate the individual objects using the eight-connected neighborhood and label propagation. Figure 3.11 (d) shows the output of vessel segmentation after removing the misclassified pixels using label fiter. The performance of the matched filter with local entropy thresholding to segment the retinal vessels is evaluated using the 20 color fundus images from DRIVE database. The performance measure and the processing time for the matched filer with local entropy thresholding to segment the blood vessel in the retinal images are tabulated in Table 3.3.
20 66 Table 3.3 Performance measure values for matched filter with local entropy thresholding Matched filter with Local Entropy Thresholding Sl.No Image Number of pixels Percentage Time ID TP FP FN TN SE SPE ACC Sec 1 01_test _test _test _test _test _test _test _test _test _test _test _test _test _test _test _test _test _test _test _test The above segmentation process could not segment the smaller vessels effectively, hence further investigation of better process is attempted.
21 67 next section. The SWFCM is tried and the results of the same are detailed in the Spatially weighted fuzzy c means technique The resultant images from the application of matched filter need further improvement using suitable thresholding technique. One such technique proposed by Kande et al (2007) is Spatially Weighed Fuzzy C Means (SWFCM) which is mainly based on clustering algorithm. In SWFCM, spatial neighboring information is included for clustering. K-nearest neighbor (k-nn) pattern classifier is used in the algorithm to consider the neighborhood influence of the pixels. SWFCM is based on Fuzzy C Means (FCM) proposed by Yong et al (2004) and the same is detailed in the next section Fuzzy c means algorithm The Fuzzy C-means (FCM) algorithm is an iterative clustering method that produces an optimal c partition that minimizes the weighted pixels within group based on the sum of squared error objective function J q U, V and the expression of the same is given below in the Equation (3.15). J q U, V n c q 2 ( uik ) d ( xk, vi ) (3.15) k 1 i 1 where X x, x... x n } R { 1 2 p n - Number of data items c - Number of clusters with 2 c < n uik - Degree of membership of x k in the i th cluster
22 68 q - Weighting exponent on each fuzzy membership v i - Prototype of the centre of cluster i d 2 ( x k, v i ) - Distance measure between object xk and cluster centre v i. A solution of the object function J q can be obtained by an iterative process that is carried out by the following steps. 1. Set value for c, q and the stopping criteria value. 2. Initialize the fuzzy partition matrix U. 3. Set the loop counter b=0 4. Calculate the c cluster centers { v (b) i } with (b) U v ( b ) i n k 1 n k 1 u ( b ) q ik u ( b ) ik x q k (3.16) 5. Calculate the membership following: (b 1) U. For k=1 to n, calculate the I k { i1 i c, d ik x k v i 0}, I ~ k {1,2,... c} I k for the k th column of the matrix, compute new membership values: a) if I k,then U ( b 1) 1 ik c dik j 1 d jk 2 q 1 (3.17)
23 69 b) else (b U ik 1) =0 for all i ~ I and k i I k u 1 ( b 1) ik. ( ) ( b 1) 6. If U b U, stop; otherwise set b=b+1 and go to step 4. Figure General steps involved in FCM are shown in flowchart in Specify the number of clusters. Initialize Cluster centers Initialize membership Update memberships function according to cluster centers Update cluster centers according to the memberships Error criteria Satisfied? No Yes Calculate validity index Select cluster center with the best validity index Figure 3.12 Flow chart for FCM algorithm
24 70 Since FCM algorithm is based on an iterative process, it is a time-consuming task that gives the algorithm limited use in image segmentation. In order to overcome this problem, the specified gray levels of the image are used. The range of non-negative integrate set of gray value of the original image is termed as G ={L min,l min+1,..,l max, } where L min and L max are the minimum and maximum gray levels respectively. The range of grayscale is defined as L max - L min. In an image of size S x T, considering a pixel at location (s, t), f(s, t) is the gray value that varies the term s and t as 0 s S-1, 0 t T-1. The statistical histogram function is as shown below in which His (g) denotes the number of pixels having gray level g, g G. S 1 T 1 His ( g) f s, t g (3.18) s 0 t 0 where gray level. g={l min,l min+1,..,l max }is the non-negative integrate of specified (0) = 1 and (g 0)=0 With the gray level histogram, the membership function and the cluster centers are updated by the Equation shown below. L max ( b) q U ik His( g) g ( b) g L min v i (3.19) L max ( b) q U ik His( g) g L min The FCM algorithm only operates on the specified histogram of the image. It is faster than the conventional version that processes the entire data.
25 71 In the standard FCM algorithm, for a pixel x k I, where I is the image and the clustering of x k with class i only depends on the membership value u ik Spatially weighted fuzzy c means FCM is noise sensitive and the clustering process is based on the independent gray level of the pixel. Hence in SWFCM technique proposed by kande et al (2007), neighborhood information of the pixel is incorporated into the FCM algorithm to overcome the fault clustering. Considering the influence of the neighboring pixels on the central pixel, the fuzzy membership function can be extended as shown in the Equation given below. u * u p (3.20) ik ik ik where, k=1, 2 n,; n is the index of each pixel, p ik - Probability of data point k belonging to cluster i. * u ik - Modified fuzzy membership function. The updated cluster centers and the degrees of membership and the modified fuzzy membership function are given by the Equations given below. * u ik and modified cluster center (b v i 1) u *( b) ik c j 1 d d p ik jk ik 2 ( q 1) (3.21)
26 72 v n *( b) q uik xk (3.22) ( b 1) k 1 i n *( b) q uik k 1 The weight variable p ik is a priori information to guide the outcome of the clustering process and the Equation is given below. p ik xn xn i N k N k 1 d 1 d 2 2 x, k n x, k n (3.23) where N k - Data set of the nearest neighbors of central pixel k, i N - Subset of N k k N i k is composed of the data belonging to class i which is obtained after defuzzyfying the result of the FCM algorithm. In order to develop an appropriate method and to describe the probability of a data point, the probability of pixels in the cluster can be improved by implementations of the k-nn (k- Nearest Neighbour) algorithm. The distance between the pixels x and x k is determined using the following Equation. 1 K ( x, xk ) (3.24) 2 1 x x k where - Positive constant 2 x x k - Norm of the vector x xk
27 73 Then the potential is modified by assigning the proximity of feature vector to each prototype instead of the potential for feature vector to feature vector. Hence, the new equation for the weight value is predicted using the following Equation. p ik xn xn i N k N k d. d 2 2 x, v n n i x, v i (3.25) where v i - Prototype of cluster i. After the a-priori weight is determined, a new iteration step starts with this auxiliary variable p ik. In order to prevent the SWFCM from getting trapped in a local minima, it is initialized with the fast FCM algorithm. Once the FCM is stopped, the SWFCM algorithm continues with the values for the prototypes and membership values obtained from the fast FCM algorithm. When the algorithm has converged, a defuzzification process takes place in order to convert the fuzzy partition matrix U to a crisp partition. A number of methods have been developed to defuzzify the partition matrix U in which the maximum membership procedure is most important. The procedure assigns object to the class C with the highest membership, and the augmented matrix C k is given below. Ck argi max( uik ), i 1,2,..., c. (3.26) With this procedure, the fuzzy images are then converted to crisp images. Resultant sample image after application of SWFCM is shown in Figure Resultant output image shows the segmented vessels with

28 74 minimum number of misclassified pixels. Label filtering is applied to remove the misclassified pixels. Figure 3.13 shows the image with clear vessel segmentation after application of label filtering. Figure 3.13 Resultant image after SWFCM The performance of segmentation algorithm is studied against the manually segmented retinal vessels from the 1 st observer of DRIVE database. The results for the performance parameter are given in Table 3.4. Table 3.4 Performance measure values for SWFCM SWFCM Sl.No Image Number of pixels Percentage Time ID TP FP FN TN SE SPE ACC Sec 1 01_test _test _test _test _test _test _test _test
29 75 Table 3.4 (Continued) 9 09_test _test _test _test _test _test _test _test _test _test _test _test It is inferred from the values in Table 3.4 that the sensitivity, specificity and accuracy values are slightly better compared to those of the previous methods. However, further attempt is made to segment the blood vessels in a still better way using morphological approach. The processing time to segment the blood vessel is around 12 seconds. The comparison of the results of various images are tested, evaluated, compared and presented in the following sections. 3.4 MORPHOLOGICAL APPROACH The morphological properties of blood vessels are linearity, connectivity, width and specific Gaussian like profile whose curvature varies smoothly along the crest line. These properties are used to highlight the vessels. Morphological operations that identify the above properties play an important role in digital image processing. It is a set of image processing
30 76 operations that convolve the various templates of various shapes over the images. A set of coordinate points known as structuring elements consist of only 1 s and 0 s and can have any arbitrary shape and size. The output value of each pixel is determined by the neighboring pixels with its corresponding pixel of the input image. The size and shape of the structuring element affect the number of pixels being added or removed from the object in a preprocessed image that are obtained using the processes like color band separation, mean filter and CLAHE as explained in the earlier Section 3.1. The basic morphological operations include dilation, erosion, opening and closing of selected areas of an image Dilation Dilation is one of the basic operations in morphology. It adds pixels on the object boundaries and allows objects to grow by filling small holes of the binary images. The growth of the object is controlled by the structuring element represented by a matrix of 0 s and 1 s. Mathematically, dilation operation can be written as shown below. A A s z ' A s Z A (3.27) where, is an empty element and A s is the structuring element. The dilation of the image A is carried out using A s. The operation is employed by overlapping A s on A. This dilation operation is commutative and associative Erosion It is a reverse operation of dilation, i.e. it removes the pixels from the object boundaries based on the size and shape of the structuring element. The value of the output pixel is assigned the minimum value of all the pixels
31 77 in the neighborhood of the input pixel. Erosion shrinks or thins the objects in a binary image. The mathematical representation of erosion is shown below. A A s = {z (A s )z A c } (3.28) The terms A and A s are the image and the structuring element used for erosion operation Opening and Closing In image processing, dilation and erosion are used in various combinations. An image may be subjected to a series of dilations and or erosions using the same or different structuring elements. Morphological opening is described as an erosion operation followed by a dilation operation whereas the closing operation means dilation followed by erosion. The opening and closing of image X by Y is denoted by X Y, X Y respectively. The combination of these two operations lead to morphological image opening or closing and the equations employed for closing and opening are given in the EquationS (3.29) and (3.30) Opening of an image : X Y X Y Y (3.29) Closing of an Image : X Y X Y Y (3.30) Image opening and closing was performed in MATLAB to segment the blood vessel in retinal image and is discussed in detail in the next section Segmentation of Blood Vessels The resultant image after the application of various pre-processing steps as explained in Section 3.1 is termed as Preprocessed Image. Further,
32 78 the steps involved over the preprocessed image in morphological approach to segment the blood vessels are detailed below. Step1. Perform morphological opening using ball-shaped structuring element, and the resultant image is called Opening Image and it has OD. Step2. Subtract the opening image from the preprocessed image to remove the OD which is a distracting element in the process of segmentation of blood vessels. Step3. Convert the outcome of the previous step into binary form. In this operation, pixels of the input image are converted into image that contains only pixels with either black or white (Binary). This step converts the blood vessel pixels as white (1 s) and the other pixels as black (0 s). Step4. At this stage, the small disconnected pixels are removed from a binary image. All the connected components that have fewer than 8 number of pixels are removed and another binary image is produced. dots and noise. Step5. Further, the median filtering is applied to remove the tiny Resultant image after the application of morphological approach has segmented blood vessels only. The above steps are applied to the retinal image of the STARE database with the identification number im0077, and the results of the above steps are illustrated in the Figures 3.8 (a) to (f).

 Morphological opening image (c)")
 Complemented")
33 79 (a) (b) (c) (d) (e) (f) Figure 3.14 Results obtained through morphological approach (a) Preprocessed image after application of CLAHE (b) Morphological opening image (c) Optic disk removed image (d) Binary image (e) Removal of noisy pixels image (f) Complemented output image with blood vessels
34 80 Figure 3.14 (a) shows the preprocessed image. Figures 3.14 (b) to (e) show the results obtained after the application of Steps 1 to 5. Figure 3.14 (f) shows the complemented output of the resultant image converting the black regions to white and vice versa for better visualization. It is inferred that the results obtained from this method help to segment the blood vessels clearly. The performance of the morphological approach in segmenting retinal blood vessels is evaluated using 20 color fundus images from DRIVE database. The performance is evaluated as performed in Kirsch matched filter explained in the previous section. The performance measure values for the morphological-based segmentation to segment the blood vessels in the retinal images are tabulated in Table 3.5. Table 3.5 Performance measure values for morphological approach Morphological Approach Sl.No Image ID Number of pixels Percentage Time TP FP FN TN SE SPE ACC Sec 1 01_test _test _test _test _test _test _test _test _test _test
35 81 Table 3.5 (Continued) 11 11_test _test _test _test _test _test _test _test _test _test From the parametric values in Table 3.5,one can infer that the sensitivity value for all the 20 images is greater than 70%, out of which sensitivity values for the 10 images are greater than 80% and the average segmentation accuracy is improved to 95%. Processing time for segmentation is nearly 4 seconds. Morphological approach segments the blood vessel with slightly higher processing time and higher sensitivity compared to the Kirsch matched filter and the matched filter with thresholding techniques. The resultant images after the application of various blood vessel segmentation algorithms are shown in Figure 3.15.


36 ID Input Image Kirsch matched filter Matched filter with entropy thresholding 01_ test Matched filter with SWFCM Morphological Approach 02_ test Figure 3.15 Resultant images after the application of various blood vessel segmentation algorithms 82


37 03_ test 04_ test Figure 3.15 (Continued)


38 05_ test 06_ test Figure 3.15 (Continued)
39 RESULTS AND DISCUSSION The performance of the developed algorithms in segmenting retinal vessels is evaluated. The results for the performance parameter for various techniques are presented in the respective sections. Further, the comparison between the sensitivity and specificity, accuracy and processing time for various methods have been presented in Tables 3.6 and 3.7 respectively. Various methods referred in the table are shown below. Method1 (M1) Method3 (M2) Method4 (M3) Method2 (M4) - Kirsch Matched filter (KMF) - Matched filter with entropy thresholding(mfe) - Spatially Weighted Fuzzy C Means (SWFCM) - Proposed Morphological based segmentation (MBS) Table 3.6 Sensitivity and specificity values of various methods Sensitivity Specificity Image ID M1 M2 M3 M4 M1 M2 M3 M4 01_test _test _test _test _test _test _test _test _test _test _test _test _test _test _test _test _test _test _test _test Mean value
40 86 Highest sensitivity and specificity values are shown in bold numbers and mean values of SE and SPE of each method are calculated and presented. Highest mean values are in red color. From Table 3.6 it is inferred that the mean value of the SE is less for M1. Average value of the SE is 80% for M4. Mean SE values of M2 and M3 are above 65%. In the case of considering the sensitivity of the vessel segmentation, M4 is superior to the other methods. Mean SPE values of all four methods are above 95%. M2 and M3 have the higher specificity values as 97% compared to the other methods. The SE and SPE results shown in Table 3.6 are presented graphically in Figures 3.16 and 3.17 respectively, to visualize the variation in a better manner. Comparision Chart - Sensitivity Images from DRIVE database Method1 Method2 Method3 proposed Method Figure 3.16 Sensitivity values for various vessel segmentation methods Comparision Chart - Specificity Images from DRIVE database Method1 Method2 Method3 proposed Method Figure 3.17 Specificity values for various vessel segmentation methods
41 87 Comparison chart of the SE clearly shows that the SE values of the proposed method are superior to the other methods. Comparison chart of the SPE clearly shows that the SPE values of all the methods are above 90%.The SPE values of M2 and M3 are fairly higher than the other methods. The SPE values of M1 and the proposed method are slightly inferior to those of the other methods. The accuracy and the processing time values of the four vessel segmentation methods are tabulated in Table 3.7. Table.3.7 Accuracy and processing time values of various methods Image ID Accuracy Processing Time in seconds M1 M2 M3 M4 M1 M2 M3 M4 01_test _test _test _test _test _test _test _test _test _test _test _test _test _test _test _test _test _test _test _test Mean value
42 88 Lowest processing time values are shown in bold numbers and mean values of ACC and processing time of each method are also shown. Highest mean values of the ACC and lowest processing time are shown as bold numbers. As done the previous table, the graphical representation is also shown below in Figures 3.18 and Comparision Chart - Accuracy Images from DRIVE database Method1 Method2 Method3 Proposed Method Figure 3.18 Accuracy values for various vessel segmentation methods Comparision Chart - Processing Time Images from DRIVE database Method1 Method2 Method3 Proposed Method Figure 3.19 Processing time for various vessel segmentation methods
43 89 Comparison chart of the accuracy clearly shows that M1 has the lowest accuracy and the other 3 methods have relatively the same accuracy value. The mean value of the accuracy for M2, M3 and the proposed method are relatively equal to 94%, whereas M1 has the lowest value as 90%. Comparison chart of the processing time clearly shows that M1 has the lowest time and its mean value is nearly 3 seconds. The proposed method has slightly higher processing time compared to M1 and extremely lower compared to M2 and M3. The mean value of the processing time for the proposed method is nearly 4 seconds. M2 and M3 have the highest processing time and their mean values are nearly 9 seconds and 12 seconds respectively. The results are analyzed based on the experiments conducted on 20 different retinal images in DRIVE database. This analysis concludes that morphological-based segmentation method is more suitable to segment the blood vessels in retinal images. 3.6 SUMMARY In this chapter, four different algorithms, namely Kirsch matched filter, morphological operation, matched filter with entropy thresholding and matched filter with spatially weighted fuzzy c means are employed to segment the blood vessel in retinal images. Segmentation algorithms are evaluated using the ground truth images available in the DRIVE dataset and the parametric measures like sensitivity, specificity, accuracy and processing time for each method are presented and compared.
CHAPTER 6 MODIFIED FUZZY TECHNIQUES BASED IMAGE SEGMENTATION
 CHAPTER 6 MODIFIED FUZZY TECHNIQUES BASED IMAGE SEGMENTATION 6.1 INTRODUCTION Fuzzy logic based computational techniques are becoming increasingly important in the medical image analysis arena. The significant
CHAPTER 3 RETINAL OPTIC DISC SEGMENTATION
 60 CHAPTER 3 RETINAL OPTIC DISC SEGMENTATION 3.1 IMPORTANCE OF OPTIC DISC Ocular fundus images provide information about ophthalmic, retinal and even systemic diseases such as hypertension, diabetes, macular
CHAPTER-4 LOCALIZATION AND CONTOUR DETECTION OF OPTIC DISK
 CHAPTER-4 LOCALIZATION AND CONTOUR DETECTION OF OPTIC DISK Ocular fundus images can provide information about ophthalmic, retinal and even systemic diseases such as hypertension, diabetes, macular degeneration
CHAPTER 6 DETECTION OF MASS USING NOVEL SEGMENTATION, GLCM AND NEURAL NETWORKS
 130 CHAPTER 6 DETECTION OF MASS USING NOVEL SEGMENTATION, GLCM AND NEURAL NETWORKS A mass is defined as a space-occupying lesion seen in more than one projection and it is described by its shapes and margin
EE795: Computer Vision and Intelligent Systems
 EE795: Computer Vision and Intelligent Systems Spring 2012 TTh 17:30-18:45 WRI C225 Lecture 04 130131 http://www.ee.unlv.edu/~b1morris/ecg795/ 2 Outline Review Histogram Equalization Image Filtering Linear
Application of fuzzy set theory in image analysis. Nataša Sladoje Centre for Image Analysis
 Application of fuzzy set theory in image analysis Nataša Sladoje Centre for Image Analysis Our topics for today Crisp vs fuzzy Fuzzy sets and fuzzy membership functions Fuzzy set operators Approximate
Biometrics Technology: Image Processing & Pattern Recognition (by Dr. Dickson Tong)
") Biometrics Technology: Image Processing & Pattern Recognition (by Dr. Dickson Tong) References: [1] http://homepages.inf.ed.ac.uk/rbf/hipr2/index.htm [2] http://www.cs.wisc.edu/~dyer/cs540/notes/vision.html
Biometrics Technology: Image Processing & Pattern Recognition (by Dr. Dickson Tong) References: [1] http://homepages.inf.ed.ac.uk/rbf/hipr2/index.htm [2] http://www.cs.wisc.edu/~dyer/cs540/notes/vision.html
Global Journal of Engineering Science and Research Management
 ADVANCED K-MEANS ALGORITHM FOR BRAIN TUMOR DETECTION USING NAIVE BAYES CLASSIFIER Veena Bai K*, Dr. Niharika Kumar * MTech CSE, Department of Computer Science and Engineering, B.N.M. Institute of Technology,
C E N T E R A T H O U S T O N S C H O O L of H E A L T H I N F O R M A T I O N S C I E N C E S. Image Operations II
 T H E U N I V E R S I T Y of T E X A S H E A L T H S C I E N C E C E N T E R A T H O U S T O N S C H O O L of H E A L T H I N F O R M A T I O N S C I E N C E S Image Operations II For students of HI 5323
09/11/2017. Morphological image processing. Morphological image processing. Morphological image processing. Morphological image processing (binary)
") Towards image analysis Goal: Describe the contents of an image, distinguishing meaningful information from irrelevant one. Perform suitable transformations of images so as to make explicit particular shape
Towards image analysis Goal: Describe the contents of an image, distinguishing meaningful information from irrelevant one. Perform suitable transformations of images so as to make explicit particular shape
Morphological Image Processing
 Morphological Image Processing Morphology Identification, analysis, and description of the structure of the smallest unit of words Theory and technique for the analysis and processing of geometric structures
Keywords: Thresholding, Morphological operations, Image filtering, Adaptive histogram equalization, Ceramic tile.
 Volume 3, Issue 7, July 2013 ISSN: 2277 128X International Journal of Advanced Research in Computer Science and Software Engineering Research Paper Available online at: www.ijarcsse.com Blobs and Cracks
Topic 6 Representation and Description
 Topic 6 Representation and Description Background Segmentation divides the image into regions Each region should be represented and described in a form suitable for further processing/decision-making Representation
AN ADAPTIVE REGION GROWING SEGMENTATION FOR BLOOD VESSEL DETECTION FROM RETINAL IMAGES
 AN ADAPTIVE REGION GROWING SEGMENTATION FOR BLOOD VESSEL DETECTION FROM RETINAL IMAGES Alauddin Bhuiyan, Baikunth Nath and Joselito Chua Computer Science and Software Engineering, The University of Melbourne,
Morphological Image Processing
 Morphological Image Processing Binary image processing In binary images, we conventionally take background as black (0) and foreground objects as white (1 or 255) Morphology Figure 4.1 objects on a conveyor
Segmentation algorithm for monochrome images generally are based on one of two basic properties of gray level values: discontinuity and similarity.
 Chapter - 3 : IMAGE SEGMENTATION Segmentation subdivides an image into its constituent s parts or objects. The level to which this subdivision is carried depends on the problem being solved. That means
Computer Vision 2. SS 18 Dr. Benjamin Guthier Professur für Bildverarbeitung. Computer Vision 2 Dr. Benjamin Guthier
 Computer Vision 2 SS 18 Dr. Benjamin Guthier Professur für Bildverarbeitung Computer Vision 2 Dr. Benjamin Guthier 1. IMAGE PROCESSING Computer Vision 2 Dr. Benjamin Guthier Content of this Chapter Non-linear
CLASSIFICATION WITH RADIAL BASIS AND PROBABILISTIC NEURAL NETWORKS
 CLASSIFICATION WITH RADIAL BASIS AND PROBABILISTIC NEURAL NETWORKS CHAPTER 4 CLASSIFICATION WITH RADIAL BASIS AND PROBABILISTIC NEURAL NETWORKS 4.1 Introduction Optical character recognition is one of
[ ] Review. Edges and Binary Images. Edge detection. Derivative of Gaussian filter. Image gradient. Tuesday, Sept 16
![[ ] Review. Edges and Binary Images. Edge detection. Derivative of Gaussian filter. Image gradient. Tuesday, Sept 16](/thumbs/89/98496315.jpg "[ ] Review. Edges and Binary Images. Edge detection. Derivative of Gaussian filter. Image gradient. Tuesday, Sept 16") Review Edges and Binary Images Tuesday, Sept 6 Thought question: how could we compute a temporal gradient from video data? What filter is likely to have produced this image output? original filtered output
Review Edges and Binary Images Tuesday, Sept 6 Thought question: how could we compute a temporal gradient from video data? What filter is likely to have produced this image output? original filtered output
Basic relations between pixels (Chapter 2)
") Basic relations between pixels (Chapter 2) Lecture 3 Basic Relationships Between Pixels Definitions: f(x,y): digital image Pixels: q, p (p,q f) A subset of pixels of f(x,y): S A typology of relations:
Basic relations between pixels (Chapter 2) Lecture 3 Basic Relationships Between Pixels Definitions: f(x,y): digital image Pixels: q, p (p,q f) A subset of pixels of f(x,y): S A typology of relations:
SECTION 5 IMAGE PROCESSING 2
 SECTION 5 IMAGE PROCESSING 2 5.1 Resampling 3 5.1.1 Image Interpolation Comparison 3 5.2 Convolution 3 5.3 Smoothing Filters 3 5.3.1 Mean Filter 3 5.3.2 Median Filter 4 5.3.3 Pseudomedian Filter 6 5.3.4
CHAPTER 6 IDENTIFICATION OF CLUSTERS USING VISUAL VALIDATION VAT ALGORITHM
 96 CHAPTER 6 IDENTIFICATION OF CLUSTERS USING VISUAL VALIDATION VAT ALGORITHM Clustering is the process of combining a set of relevant information in the same group. In this process KM algorithm plays
Lecture 7: Most Common Edge Detectors
 #1 Lecture 7: Most Common Edge Detectors Saad Bedros sbedros@umn.edu Edge Detection Goal: Identify sudden changes (discontinuities) in an image Intuitively, most semantic and shape information from the
Digital Image Processing COSC 6380/4393
 Digital Image Processing COSC 6380/4393 Lecture 6 Sept 6 th, 2017 Pranav Mantini Slides from Dr. Shishir K Shah and Frank (Qingzhong) Liu Today Review Logical Operations on Binary Images Blob Coloring
Introduction. Computer Vision & Digital Image Processing. Preview. Basic Concepts from Set Theory
 Introduction Computer Vision & Digital Image Processing Morphological Image Processing I Morphology a branch of biology concerned with the form and structure of plants and animals Mathematical morphology
Morphological Image Processing
 Morphological Image Processing Binary dilation and erosion" Set-theoretic interpretation" Opening, closing, morphological edge detectors" Hit-miss filter" Morphological filters for gray-level images" Cascading
CS443: Digital Imaging and Multimedia Binary Image Analysis. Spring 2008 Ahmed Elgammal Dept. of Computer Science Rutgers University
 CS443: Digital Imaging and Multimedia Binary Image Analysis Spring 2008 Ahmed Elgammal Dept. of Computer Science Rutgers University Outlines A Simple Machine Vision System Image segmentation by thresholding
Mathematical Morphology and Distance Transforms. Robin Strand
 Mathematical Morphology and Distance Transforms Robin Strand robin.strand@it.uu.se Morphology Form and structure Mathematical framework used for: Pre-processing Noise filtering, shape simplification,...
Morphological Image Processing
 Morphological Image Processing Ranga Rodrigo October 9, 29 Outline Contents Preliminaries 2 Dilation and Erosion 3 2. Dilation.............................................. 3 2.2 Erosion..............................................
Processing of binary images
 Binary Image Processing Tuesday, 14/02/2017 ntonis rgyros e-mail: argyros@csd.uoc.gr 1 Today From gray level to binary images Processing of binary images Mathematical morphology 2 Computer Vision, Spring
Babu Madhav Institute of Information Technology Years Integrated M.Sc.(IT)(Semester - 7)
(Semester - 7)") 5 Years Integrated M.Sc.(IT)(Semester - 7) 060010707 Digital Image Processing UNIT 1 Introduction to Image Processing Q: 1 Answer in short. 1. What is digital image? 1. Define pixel or picture element?
5 Years Integrated M.Sc.(IT)(Semester - 7) 060010707 Digital Image Processing UNIT 1 Introduction to Image Processing Q: 1 Answer in short. 1. What is digital image? 1. Define pixel or picture element?
Fundamentals of Digital Image Processing
 \L\.6 Gw.i Fundamentals of Digital Image Processing A Practical Approach with Examples in Matlab Chris Solomon School of Physical Sciences, University of Kent, Canterbury, UK Toby Breckon School of Engineering,
CHAPTER 4 SEGMENTATION
 69 CHAPTER 4 SEGMENTATION 4.1 INTRODUCTION One of the most efficient methods for breast cancer early detection is mammography. A new method for detection and classification of micro calcifications is presented.
A Robust Method for Circle / Ellipse Extraction Based Canny Edge Detection
 International Journal of Research Studies in Science, Engineering and Technology Volume 2, Issue 5, May 2015, PP 49-57 ISSN 2349-4751 (Print) & ISSN 2349-476X (Online) A Robust Method for Circle / Ellipse
Machine vision. Summary # 5: Morphological operations
 1 Machine vision Summary # 5: Mphological operations MORPHOLOGICAL OPERATIONS A real image has continuous intensity. It is quantized to obtain a digital image with a given number of gray levels. Different
Tumor Detection and classification of Medical MRI UsingAdvance ROIPropANN Algorithm
 International Journal of Engineering Research and Advanced Technology (IJERAT) DOI:http://dx.doi.org/10.31695/IJERAT.2018.3273 E-ISSN : 2454-6135 Volume.4, Issue 6 June -2018 Tumor Detection and classification
CHAPTER 4 OPTIC CUP SEGMENTATION AND QUANTIFICATION OF NEURORETINAL RIM AREA TO DETECT GLAUCOMA
 83 CHAPTER 4 OPTIC CUP SEGMENTATION AND QUANTIFICATION OF NEURORETINAL RIM AREA TO DETECT GLAUCOMA 4.1 INTRODUCTION Glaucoma damages the optic nerve cells that transmit visual information to the brain.
CHAPTER 6 HYBRID AI BASED IMAGE CLASSIFICATION TECHNIQUES
 CHAPTER 6 HYBRID AI BASED IMAGE CLASSIFICATION TECHNIQUES 6.1 INTRODUCTION The exploration of applications of ANN for image classification has yielded satisfactory results. But, the scope for improving
Digital Image Processing
 Digital Image Processing Third Edition Rafael C. Gonzalez University of Tennessee Richard E. Woods MedData Interactive PEARSON Prentice Hall Pearson Education International Contents Preface xv Acknowledgments
Image Processing: Final Exam November 10, :30 10:30
 Image Processing: Final Exam November 10, 2017-8:30 10:30 Student name: Student number: Put your name and student number on all of the papers you hand in (if you take out the staple). There are always
An Efficient Character Segmentation Based on VNP Algorithm
 Research Journal of Applied Sciences, Engineering and Technology 4(24): 5438-5442, 2012 ISSN: 2040-7467 Maxwell Scientific organization, 2012 Submitted: March 18, 2012 Accepted: April 14, 2012 Published:
Examination in Image Processing
 Umeå University, TFE Ulrik Söderström 203-03-27 Examination in Image Processing Time for examination: 4.00 20.00 Please try to extend the answers as much as possible. Do not answer in a single sentence.
[Programming Assignment] (1)
![[Programming Assignment] (1)](/thumbs/90/104460171.jpg "[Programming Assignment] (1)") http://crcv.ucf.edu/people/faculty/bagci/ [Programming Assignment] (1) Computer Vision Dr. Ulas Bagci (Fall) 2015 University of Central Florida (UCF) Coding Standard and General Requirements Code for all
http://crcv.ucf.edu/people/faculty/bagci/ [Programming Assignment] (1) Computer Vision Dr. Ulas Bagci (Fall) 2015 University of Central Florida (UCF) Coding Standard and General Requirements Code for all
INTENSITY TRANSFORMATION AND SPATIAL FILTERING
 1 INTENSITY TRANSFORMATION AND SPATIAL FILTERING Lecture 3 Image Domains 2 Spatial domain Refers to the image plane itself Image processing methods are based and directly applied to image pixels Transform
Operators-Based on Second Derivative double derivative Laplacian operator Laplacian Operator Laplacian Of Gaussian (LOG) Operator LOG
 Operator LOG") Operators-Based on Second Derivative The principle of edge detection based on double derivative is to detect only those points as edge points which possess local maxima in the gradient values. Laplacian
Operators-Based on Second Derivative The principle of edge detection based on double derivative is to detect only those points as edge points which possess local maxima in the gradient values. Laplacian
IMPLEMENTATION OF SPATIAL FUZZY CLUSTERING IN DETECTING LIP ON COLOR IMAGES
 IMPLEMENTATION OF SPATIAL FUZZY CLUSTERING IN DETECTING LIP ON COLOR IMAGES Agus Zainal Arifin 1, Adhatus Sholichah 2, Anny Yuniarti 3, Dini Adni Navastara 4, Wijayanti Nurul Khotimah 5 1,2,3,4,5 Department
Chapter - 2 : IMAGE ENHANCEMENT
 Chapter - : IMAGE ENHANCEMENT The principal objective of enhancement technique is to process a given image so that the result is more suitable than the original image for a specific application Image Enhancement
Image Processing
 Image Processing 159.731 Canny Edge Detection Report Syed Irfanullah, Azeezullah 00297844 Danh Anh Huynh 02136047 1 Canny Edge Detection INTRODUCTION Edges Edges characterize boundaries and are therefore
Equation to LaTeX. Abhinav Rastogi, Sevy Harris. I. Introduction. Segmentation.
 Equation to LaTeX Abhinav Rastogi, Sevy Harris {arastogi,sharris5}@stanford.edu I. Introduction Copying equations from a pdf file to a LaTeX document can be time consuming because there is no easy way
Connected components - 1
 Connected Components Basic definitions Connectivity, Adjacency, Connected Components Background/Foreground, Boundaries Run-length encoding Component Labeling Recursive algorithm Two-scan algorithm Chain
Chapter 7 UNSUPERVISED LEARNING TECHNIQUES FOR MAMMOGRAM CLASSIFICATION
 UNSUPERVISED LEARNING TECHNIQUES FOR MAMMOGRAM CLASSIFICATION Supervised and unsupervised learning are the two prominent machine learning algorithms used in pattern recognition and classification. In this
morphology on binary images
 morphology on binary images Ole-Johan Skrede 10.05.2017 INF2310 - Digital Image Processing Department of Informatics The Faculty of Mathematics and Natural Sciences University of Oslo After original slides
Segmentation and Grouping
 Segmentation and Grouping How and what do we see? Fundamental Problems ' Focus of attention, or grouping ' What subsets of pixels do we consider as possible objects? ' All connected subsets? ' Representation
Image Processing. BITS Pilani. Dr Jagadish Nayak. Dubai Campus
 Image Processing BITS Pilani Dubai Campus Dr Jagadish Nayak Image Segmentation BITS Pilani Dubai Campus Fundamentals Let R be the entire spatial region occupied by an image Process that partitions R into
6. Dicretization methods 6.1 The purpose of discretization
 6. Dicretization methods 6.1 The purpose of discretization Often data are given in the form of continuous values. If their number is huge, model building for such data can be difficult. Moreover, many
CHAPTER 2 TEXTURE CLASSIFICATION METHODS GRAY LEVEL CO-OCCURRENCE MATRIX AND TEXTURE UNIT
 CHAPTER 2 TEXTURE CLASSIFICATION METHODS GRAY LEVEL CO-OCCURRENCE MATRIX AND TEXTURE UNIT 2.1 BRIEF OUTLINE The classification of digital imagery is to extract useful thematic information which is one
EE 584 MACHINE VISION
 EE 584 MACHINE VISION Binary Images Analysis Geometrical & Topological Properties Connectedness Binary Algorithms Morphology Binary Images Binary (two-valued; black/white) images gives better efficiency
CHAPTER 3 IMAGE ENHANCEMENT IN THE SPATIAL DOMAIN
 CHAPTER 3 IMAGE ENHANCEMENT IN THE SPATIAL DOMAIN CHAPTER 3: IMAGE ENHANCEMENT IN THE SPATIAL DOMAIN Principal objective: to process an image so that the result is more suitable than the original image
Perception. Autonomous Mobile Robots. Sensors Vision Uncertainties, Line extraction from laser scans. Autonomous Systems Lab. Zürich.
 Autonomous Mobile Robots Localization "Position" Global Map Cognition Environment Model Local Map Path Perception Real World Environment Motion Control Perception Sensors Vision Uncertainties, Line extraction
Training-Free, Generic Object Detection Using Locally Adaptive Regression Kernels
 Training-Free, Generic Object Detection Using Locally Adaptive Regression Kernels IEEE TRANSACTIONS ON PATTERN ANALYSIS AND MACHINE INTELLIENCE, VOL.32, NO.9, SEPTEMBER 2010 Hae Jong Seo, Student Member,
CS4733 Class Notes, Computer Vision
 CS4733 Class Notes, Computer Vision Sources for online computer vision tutorials and demos - http://www.dai.ed.ac.uk/hipr and Computer Vision resources online - http://www.dai.ed.ac.uk/cvonline Vision
UNIT - 5 IMAGE ENHANCEMENT IN SPATIAL DOMAIN
 UNIT - 5 IMAGE ENHANCEMENT IN SPATIAL DOMAIN Spatial domain methods Spatial domain refers to the image plane itself, and approaches in this category are based on direct manipulation of pixels in an image.
Edge and local feature detection - 2. Importance of edge detection in computer vision
 Edge and local feature detection Gradient based edge detection Edge detection by function fitting Second derivative edge detectors Edge linking and the construction of the chain graph Edge and local feature
Application of mathematical morphology to problems related to Image Segmentation
 Application of mathematical morphology to problems related to Image Segmentation Bala S Divakaruni and Sree T. Sunkara Department of Computer Science, Northern Illinois University DeKalb IL 60115 mrdivakaruni
Image processing. Reading. What is an image? Brian Curless CSE 457 Spring 2017
 Reading Jain, Kasturi, Schunck, Machine Vision. McGraw-Hill, 1995. Sections 4.2-4.4, 4.5(intro), 4.5.5, 4.5.6, 5.1-5.4. [online handout] Image processing Brian Curless CSE 457 Spring 2017 1 2 What is an
CITS 4402 Computer Vision
 CITS 4402 Computer Vision A/Prof Ajmal Mian Adj/A/Prof Mehdi Ravanbakhsh, CEO at Mapizy (www.mapizy.com) and InFarm (www.infarm.io) Lecture 02 Binary Image Analysis Objectives Revision of image formation
Tutorial 8. Jun Xu, Teaching Asistant March 30, COMP4134 Biometrics Authentication
 Tutorial 8 Jun Xu, Teaching Asistant csjunxu@comp.polyu.edu.hk COMP4134 Biometrics Authentication March 30, 2017 Table of Contents Problems Problem 1: Answer The Questions Problem 2: Daugman s Method Problem
THE quantification of vessel features, such as length, width,
 1200 IEEE TRANSACTIONS ON MEDICAL IMAGING, VOL. 25, NO. 9, SEPTEMBER 2006 Segmentation of Retinal Blood Vessels by Combining the Detection of Centerlines and Morphological Reconstruction Ana Maria Mendonça,
Norbert Schuff VA Medical Center and UCSF
 Norbert Schuff Medical Center and UCSF Norbert.schuff@ucsf.edu Medical Imaging Informatics N.Schuff Course # 170.03 Slide 1/67 Objective Learn the principle segmentation techniques Understand the role
Blood vessel tracking in retinal images
 Y. Jiang, A. Bainbridge-Smith, A. B. Morris, Blood Vessel Tracking in Retinal Images, Proceedings of Image and Vision Computing New Zealand 2007, pp. 126 131, Hamilton, New Zealand, December 2007. Blood
2. On classification and related tasks
 2. On classification and related tasks In this part of the course we take a concise bird s-eye view of different central tasks and concepts involved in machine learning and classification particularly.
Region-based Segmentation
 Region-based Segmentation Image Segmentation Group similar components (such as, pixels in an image, image frames in a video) to obtain a compact representation. Applications: Finding tumors, veins, etc.
2D Image Processing INFORMATIK. Kaiserlautern University. DFKI Deutsches Forschungszentrum für Künstliche Intelligenz
 2D Image Processing - Filtering Prof. Didier Stricker Kaiserlautern University http://ags.cs.uni-kl.de/ DFKI Deutsches Forschungszentrum für Künstliche Intelligenz http://av.dfki.de 1 What is image filtering?
Image Sampling and Quantisation
 Image Sampling and Quantisation Introduction to Signal and Image Processing Prof. Dr. Philippe Cattin MIAC, University of Basel 1 of 46 22.02.2016 09:17 Contents Contents 1 Motivation 2 Sampling Introduction
INF 4300 Classification III Anne Solberg The agenda today:
 INF 4300 Classification III Anne Solberg 28.10.15 The agenda today: More on estimating classifier accuracy Curse of dimensionality and simple feature selection knn-classification K-means clustering 28.10.15
Texture. Frequency Descriptors. Frequency Descriptors. Frequency Descriptors. Frequency Descriptors. Frequency Descriptors
 Texture The most fundamental question is: How can we measure texture, i.e., how can we quantitatively distinguish between different textures? Of course it is not enough to look at the intensity of individual
Image Sampling & Quantisation
 Image Sampling & Quantisation Biomedical Image Analysis Prof. Dr. Philippe Cattin MIAC, University of Basel Contents 1 Motivation 2 Sampling Introduction and Motivation Sampling Example Quantisation Example
Character Recognition
 Character Recognition 5.1 INTRODUCTION Recognition is one of the important steps in image processing. There are different methods such as Histogram method, Hough transformation, Neural computing approaches
Clustering & Classification (chapter 15)
") Clustering & Classification (chapter 5) Kai Goebel Bill Cheetham RPI/GE Global Research goebel@cs.rpi.edu cheetham@cs.rpi.edu Outline k-means Fuzzy c-means Mountain Clustering knn Fuzzy knn Hierarchical
Clustering & Classification (chapter 5) Kai Goebel Bill Cheetham RPI/GE Global Research goebel@cs.rpi.edu cheetham@cs.rpi.edu Outline k-means Fuzzy c-means Mountain Clustering knn Fuzzy knn Hierarchical
ECG782: Multidimensional Digital Signal Processing
 Professor Brendan Morris, SEB 3216, brendan.morris@unlv.edu ECG782: Multidimensional Digital Signal Processing Spatial Domain Filtering http://www.ee.unlv.edu/~b1morris/ecg782/ 2 Outline Background Intensity
Image Enhancement: To improve the quality of images
 Image Enhancement: To improve the quality of images Examples: Noise reduction (to improve SNR or subjective quality) Change contrast, brightness, color etc. Image smoothing Image sharpening Modify image
Final Review. Image Processing CSE 166 Lecture 18
 Final Review Image Processing CSE 166 Lecture 18 Topics covered Basis vectors Matrix based transforms Wavelet transform Image compression Image watermarking Morphological image processing Segmentation
Image Processing Fundamentals. Nicolas Vazquez Principal Software Engineer National Instruments
 Image Processing Fundamentals Nicolas Vazquez Principal Software Engineer National Instruments Agenda Objectives and Motivations Enhancing Images Checking for Presence Locating Parts Measuring Features
Hybrid Approach for MRI Human Head Scans Classification using HTT based SFTA Texture Feature Extraction Technique
 Volume 118 No. 17 2018, 691-701 ISSN: 1311-8080 (printed version); ISSN: 1314-3395 (on-line version) url: http://www.ijpam.eu ijpam.eu Hybrid Approach for MRI Human Head Scans Classification using HTT
CHAPTER 6 ENHANCEMENT USING HYPERBOLIC TANGENT DIRECTIONAL FILTER BASED CONTOURLET
 93 CHAPTER 6 ENHANCEMENT USING HYPERBOLIC TANGENT DIRECTIONAL FILTER BASED CONTOURLET 6.1 INTRODUCTION Mammography is the most common technique for radiologists to detect and diagnose breast cancer. This
Classification of Subject Motion for Improved Reconstruction of Dynamic Magnetic Resonance Imaging
 1 CS 9 Final Project Classification of Subject Motion for Improved Reconstruction of Dynamic Magnetic Resonance Imaging Feiyu Chen Department of Electrical Engineering ABSTRACT Subject motion is a significant
Detecting and Identifying Moving Objects in Real-Time
 Chapter 9 Detecting and Identifying Moving Objects in Real-Time For surveillance applications or for human-computer interaction, the automated real-time tracking of moving objects in images from a stationary
Vivekananda. Collegee of Engineering & Technology. Question and Answers on 10CS762 /10IS762 UNIT- 5 : IMAGE ENHANCEMENT.
 Vivekananda Collegee of Engineering & Technology Question and Answers on 10CS762 /10IS762 UNIT- 5 : IMAGE ENHANCEMENT Dept. Prepared by Harivinod N Assistant Professor, of Computer Science and Engineering,
RESEARCH ON OPTIMIZATION OF IMAGE USING SKELETONIZATION TECHNIQUE WITH ADVANCED ALGORITHM
 881 RESEARCH ON OPTIMIZATION OF IMAGE USING SKELETONIZATION TECHNIQUE WITH ADVANCED ALGORITHM Sarita Jain 1 Sumit Rana 2 Department of CSE 1 Department of CSE 2 Geeta Engineering College 1, Panipat, India
Filtering Images. Contents
 Image Processing and Data Visualization with MATLAB Filtering Images Hansrudi Noser June 8-9, 010 UZH, Multimedia and Robotics Summer School Noise Smoothing Filters Sigmoid Filters Gradient Filters Contents
THE preceding chapters were all devoted to the analysis of images and signals which
 Chapter 5 Segmentation of Color, Texture, and Orientation Images THE preceding chapters were all devoted to the analysis of images and signals which take values in IR. It is often necessary, however, to
MRI Classification and Segmentation of Cervical Cancer to Find the Area of Tumor
 MRI Classification and Segmentation of Cervical Cancer to Find the Area of Tumor S. S. Dhumal 1, S. S. Agrawal 2 1 Department of EnTC, University of Pune, India Abstract Automated classification and detection
Scanner Parameter Estimation Using Bilevel Scans of Star Charts
 ICDAR, Seattle WA September Scanner Parameter Estimation Using Bilevel Scans of Star Charts Elisa H. Barney Smith Electrical and Computer Engineering Department Boise State University, Boise, Idaho 8375
Development of an Automated Fingerprint Verification System
 Development of an Automated Development of an Automated Fingerprint Verification System Fingerprint Verification System Martin Saveski 18 May 2010 Introduction Biometrics the use of distinctive anatomical
Handwritten Script Recognition at Block Level
 Chapter 4 Handwritten Script Recognition at Block Level -------------------------------------------------------------------------------------------------------------------------- Optical character recognition
CHAPTER 3 A FAST K-MODES CLUSTERING ALGORITHM TO WAREHOUSE VERY LARGE HETEROGENEOUS MEDICAL DATABASES
 70 CHAPTER 3 A FAST K-MODES CLUSTERING ALGORITHM TO WAREHOUSE VERY LARGE HETEROGENEOUS MEDICAL DATABASES 3.1 INTRODUCTION In medical science, effective tools are essential to categorize and systematically
MRT based Fixed Block size Transform Coding
 3 MRT based Fixed Block size Transform Coding Contents 3.1 Transform Coding..64 3.1.1 Transform Selection...65 3.1.2 Sub-image size selection... 66 3.1.3 Bit Allocation.....67 3.2 Transform coding using
CHAPTER 4 DETECTION OF DISEASES IN PLANT LEAF USING IMAGE SEGMENTATION
 CHAPTER 4 DETECTION OF DISEASES IN PLANT LEAF USING IMAGE SEGMENTATION 4.1. Introduction Indian economy is highly dependent of agricultural productivity. Therefore, in field of agriculture, detection of
Introduction to Medical Imaging (5XSA0)
") 1 Introduction to Medical Imaging (5XSA0) Visual feature extraction Color and texture analysis Sveta Zinger ( s.zinger@tue.nl ) Introduction (1) Features What are features? Feature a piece of information
1 Introduction to Medical Imaging (5XSA0) Visual feature extraction Color and texture analysis Sveta Zinger ( s.zinger@tue.nl ) Introduction (1) Features What are features? Feature a piece of information
N.Priya. Keywords Compass mask, Threshold, Morphological Operators, Statistical Measures, Text extraction
 Volume, Issue 8, August ISSN: 77 8X International Journal of Advanced Research in Computer Science and Software Engineering Research Paper Available online at: www.ijarcsse.com A Combined Edge-Based Text