Contents. 2.5 DBSCAN Pair Auto-Correlation Saving your results References... 18
|
|
|
- Samuel Fields
- 5 years ago
- Views:
Transcription
1 Contents 1 Getting Started Launching the program: Loading and viewing your data Setting parameters Cropping points Selecting regions of interest Analysis Pairwise distance distribution Cumulative distance distribution Getis-based Clustering Analysis Spatial Statistics DBSCAN Pair Auto-Correlation Saving your results References... 18

2 1 Getting Started 1.1 Launching the program: Download the file SuperCluster.m into a directory on your MATLAB path. Launch the program either by typing SuperCluster at the command line or by opening the file in the MATLAB editor and hitting the run button. Required MATLAB toolboxes and classes: Image Processing Toolbox, Statistics Toolbox, DERIVEST Suite (used in autocorrelation curve fitting) 1.2 Loading and viewing your data Upon launching the program, you will be presented with the main GUI window:
 and nanometers.")
3 First, select the source of your data either dynamically generated simulated data or data loaded from file. To load saved data from file, first enter the conversion factor between pixels (or whatever your data units might be) and nanometers. If your data is already in units of nanometers, leave this box empty: Next, load your data using the Browse button. Acceptable file types and formats are: -.mat files containing SR_demo objects -.mat files containing x-y coordinates of super resolution data -.mat files containing previous SuperCluster results files -.csv files containing x-y coordinates of super resolution data -.txt files containing comma-separated pairs of super resolution coordinates, with no headers, either in 2 rows or in 2 columns

4 If you choose to simulate data, enter the desired simulation parameters and hit the Simulate button:


5 When you ve selected your file or simulated data, the localizations will be plotted in the main GUI figure window: 1.3 Setting parameters At this point, you will want to set your parameters Minimum distance threshold: This is the minimum point-to-point distance that you wish to consider in your analyses. Point-to-point distances below this threshold will be considered noise and disregarded.
. 4.")
6 2. Maximum distance threshold: This is the maximum point-to-point distance that you wish to consider in your analyses. 3. Ripley cutoff: This is the largest radius r to be used in calculating the Ripley s K statistic (and related values). 4. Subregion size: For portions of the clustering analysis, including the Getis-based cluster analysis and the pair auto-correlation analysis, the initial ROIs are broken down into a number of equal-sized subregions (you can think of these subregions as bins for super-resolution localizations, or pixels) which are used to create a slightly lower resolution map of the ROI for area-based analyses (this helps to ameliorate the effects of multiple localizations). 5. Box size: This is the length of one side of a square ROI. Set this value if you wish to create an ROI of a specific size. If you plan to draw your ROI, you can leave this as the default. 6. Epsilon: This is the search radius used in the DBSCAN clustering algorithm. 7. Min. Count per Cluster: This is the minimum number of SR localizations to be considered a cluster. Used in both DBSCAN and the Getis-based clustering. 8. Combine PC Results: Combine the pair auto-correlation results for all ROIs. This will result in a single curve fit for the data set. Leaving this box unchecked will result in an individual curve fit for each ROI. ** NOTE: All units are in nanometers unless otherwise specified ** 1.4 Cropping points If your data set has an anomaly that you wish to remove to prevent artifacts in your analyses, you can do this using the Crop Points button. To remove a region from the data, first click the Crop Points button. You will see the cursor change into a plus sign. Next, (single left) click points around the area you wish to remove: (you will see a dotted line indicating the selected region)
: automatic and manual.")
7 When you reach your last point, double click the mouse to close the region and remove the points: You may repeat this operation as many times as you wish by repeating these steps. Please note that you may not crop points that are already inside an ROI. 1.5 Selecting regions of interest There are two ways to specify a region of interest (ROI): automatic and manual. For automatic specification: enter the desired box size (see section 1.3), then click the Select Regions button. Left click to place an ROI box in the data viewing pane (the clicked point will be the center point of the ROI). To place additional ROIs, repeat the previous steps. For manual specification: click the Select Regions button. Right click the mouse anywhere in the data viewing pane and then right click and drag to draw an ROI box. The size of this ROI will be retained and you can place additional ROIs of the same size by now following the steps for automatic ROI specification.

8 Note: You may use anywhere between 1 and 12 ROIs in a single data set, however using more than 4 ROIs will cause increased processing time, some garbled display text, and difficult to read plots. If you do not care about the display and only want the values, you may use up to 12 ROIs. 2 Analysis Now that you have selected your regions, it is time to move on to analyzing your data. The following are descriptions of the currently available analyses, with appropriate references provided at the end of this document. 2.1 Pairwise distance distribution Plot Distances calculates the pairwise distance between all localizations in the ROI, except those below or above the minimum and maximum distance thresholds (respectively) and displays the probability density function of the distances. The results are displayed side-by-side with the expected results of an equal number of randomly distributed points (drawn from random uniform distribution) in an ROI of the same size.
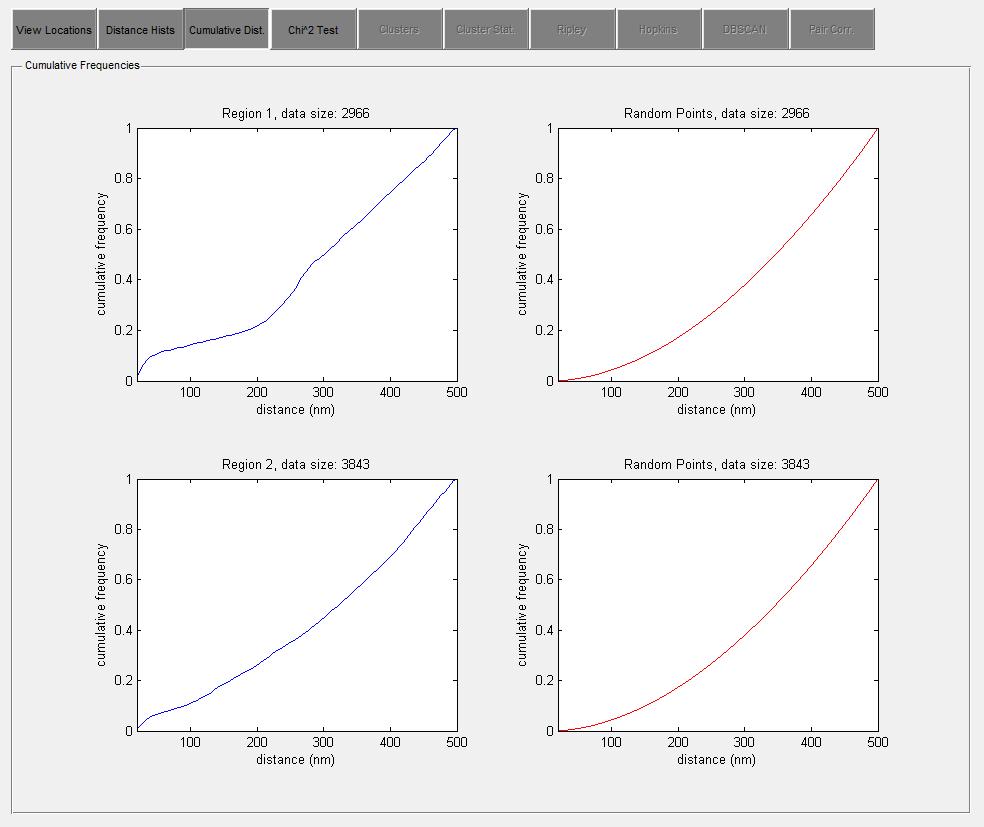
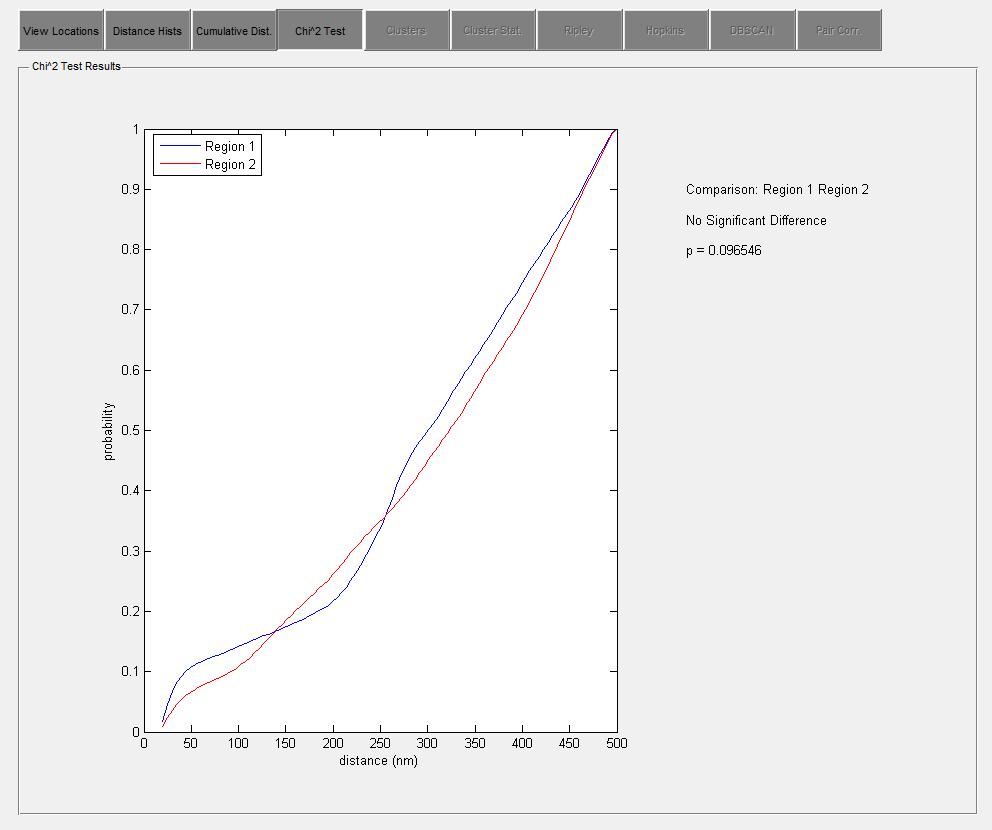
. 2.2 Cumulative distance distribution The Cumulative Dist.")
9 The numerical output (see section 3) of this function is a list of all the pairwise distances (thresholds are NOT applied), a list of the pairwise distances between random points for comparison, the probability histogram in the form of [bins, counts] (with thresholds applied). 2.2 Cumulative distance distribution The Cumulative Dist. function calculates and displays the cumulative density function of the pairwise distances (thresholds applied), as well as the comparison to random data. It also performs a comparison between the data using the 2 sample Chi-Squared test (this only applies if you are interested in differences between ROIs in your data set). If more than 2 ROIs are being analyzed, this test is performed in a pairwise fashion. The output (see section 3) of this function is the cumulative histogram of the pairwise distance in the form of [bins, counts], the empirical CDF, and the results of the Chi-Squared test (names of the regions being compared, a value indicating the acceptance or rejection of the null hypothesis (1 = reject, 0 = accept) and the p-value.
10
 based on the number of super-resolution localizations they each contain (a histogram image). Histogram image of ROI 1 (from above).")
11 2.3 Getis-based Clustering Analysis This portion of the analysis involves breaking the ROI into equal-area subregions (see section 1.3). These subregions are then assigned a value ( ) based on the number of super-resolution localizations they each contain (a histogram image). Histogram image of ROI 1 (from above). The Getis statistical analysis has been used to analyze geographical clustering data, and is a method that indicates the local amount of clustering between subregions (pixels) of a given size in an image (1,2). The calculation is carried out based on the following equation: () = (), where is the pairwise distance between subregions and ; is the number of subregions in the ROI; and is a binary weight matrix where () = 1 if the pairwise distance,, between subregions and is less than the cutoff distance D c and () = 0 if is greater than D c. As you can see, this results in a ratio between the sum of the values of subregions within a distance of the subregion and the sum of the values of all subregions, which is a measure of local clustering. By evaluating max ( ()) for = [0, ), we can identify length scales over which the degree of local clustering is increasing (indicating continuous domain structure) and where it is not (indicating discontinuities in domain structure). This analysis method finds clusters based on local maxima of the Getis G statistic and provides domain visualization, as well as a histogram of the equivalent diameters, the convexity, compactness and distance to nearest neighboring cluster.
 for = [0, ) at each pixel in the ROI, a 1 x n array of")

12 The output variables (see section 3) are: a cell array containing the values of () for = [0, ) at each pixel in the ROI, a 1 x n array of cluster aspect ratios, a 1 x n array of cluster equivalent diameters, a 1 x n array of the cluster density/whole cell density, a maximum projection
13 of pixel-by-pixel G values, a 1 x n array of nearest cluster distances, a cell array containing the alpha-hull of each cluster, a 1 x n array of the area of each cluster (nm^2), a cell array containing all of the SR localizations contained in each cluster, and the mean equivalent diameter. 2.4 Spatial Statistics The spatial statistics module calculates both the Hopkins statistic and Ripley s K function, with methods adapted from previous STMC work 3 ( The Hopkins statistic tests for spatial randomness by comparing nearest-neighbor distances from simulated randomly distributed points to their nearest real neighbors, and the nearest-neighbor distances within the set of real points. The Hopkins statistic is given by: = + where is the set of nearest-neighbor distances between real points and is the set of distances between the simulated random points and their nearest real neighbors. If the real points are randomly distributed, the value of will be approximately ½, while clustered points will result in an value close to 1. Points that are uniformly distributed will result in an that is approaching 0. Ripley s K function (and related statistics) are based on the detection of deviation from spatial homogeneity. Ripley s K function is given by: () = () where () is the expected number of points within a distance of the th point, is the point density (approximated by the number of points divided by the area of the region), and is the total number of points. The expected value of this function is. The function can be normalized to give a linear expected value: () = () and further normalized so that the expected value is 0: () = ()
 includes an array containing the values of, and a 1x4 cell array containing the values of (), the distance step-size, (), and (). 2.")
14 The Spatial Statistics function calculates and plots, (), (), and (). The output (see section 3) includes an array containing the values of, and a 1x4 cell array containing the values of (), the distance step-size, (), and (). 2.5 DBSCAN Density-based spatial clustering of applications with noise (DBSCAN) is a data clustering algorithm proposed by Martin Ester, Hans-Peter Kriegel, Jörg Sander and Xiaowei Xu in
 and if p is surrounded by sufficiently many points such that one may consider p and q to be part of a cluster.")
15 DBSCAN's definition of a cluster is based on the notion of density reachability. A point q is directly density-reachable from a point p -neighborhood) and if p is surrounded by sufficiently many points such that one may consider p and q to be part of a cluster. q is called density-reachable (note the distinction from "directly density-reachable") from p if there is a sequence p 1,,p n of points with p 1 = p and p n = q where each p {i+1} is directly density-reachable from p i. Note that the relation of density-reachable is not symmetric. q might lie on the edge of a cluster, having insufficiently many neighbors to count as dense itself. This would halt the process of finding a path that stops with the first non-dense point. By contrast, starting the process with p would lead to q (though the process would halt there, q being the first non-dense point). Due to this asymmetry, the notion of density-connected is introduced: two points p and q are densityconnected if there is a point o such that both p and q are density-reachable from o. Densityconnectedness is symmetric. A cluster, which is a subset of the points of the database, satisfies two properties: 1. All points within the cluster are mutually density-connected. 2. If a point is density-connected to any point of the cluster, it is part of the cluster as well. Output variables (see section 3): a cell array containing the number of SR localizations per DBSCAN cluster, a cell array containing the convex hull of each DBSCAN cluster, a 1 x n array of cluster equivalent diameters, the mean cluster equivalent diameter, and a cell array containing the area of each DBSCAN cluster (based on convex hull).

16 2.6 Pair Auto-Correlation This analysis is a method developed by Sarah Veatch and colleagues 5. Pair correlation functions quantify organization in heterogeneous systems and are easily applied to super-resolution localization data. The pair auto-correlation function, g(r), that reports the increased probability of finding a second localized signal a distance r away from a given localized signal, is efficiently calculated using Fast Fourier Transforms, and can account for complex boundary shapes without additional assumptions. The pair autocorrelation code was written by Sarah Veatch and the complimentary fitting code was written by Keith Lidke. The pair auto-correlation analysis can be performed on each ROI individually, or on the combined ROIs (shown below). Output variables (see section 3): a 1x4 cell array containing: the ROI image; a matrix with the radius values in column 1, the angularly averaged autocorrelation function in column 2, and the errors of the angularly averaged autocorrelation function in column 3; the average density rho; and the 2D autocorrelation function; a matrix containing the estimated fitting parameters (objects per domain, sigma for 2D Gaussian domain size, observations per object, sigma for Gaussian localization precision) with one row for each ROI or one row for the combined ROIs; and the fit model generated from these parameters.
17 3 Saving your results The plots and output variables generated by this program are not saved automatically. You must use the Save Variables button to do this. Upon clicking the Save Variables button, you will be prompted to specify the save location and name of the results file. The results file is a.mat file containing two variables: points, which is the x- y coordinates of the original data, and regs, which is a 1xn struct with the following fields: points - the x-y coordinates of the points in that ROI ROI - rectangular ROI that you selected area - area of the ROI in nm^2 dists - pairwise distances between all points in the ROI label - (internal program use, ignore) name - (internal program use, ignore) randoms - a set of randomly generated points that would fit in the ROI, used for comparison between the real data and a similar set of random points (uniform random) randists - pairwise distance between all of the random points disthist - histogram of pairwise distances, excluding values above or below the designated cutoffs cumhist - cumulative histogram of same data as in disthist cdf - empirical cdf of pairwise distances chidats - result of chi^2 test between cdfs (this is only applicable if you care about a statistical comparison between regions on the same cell) G - a cell array containing the values of G_i (d) for d=[0,cutoff) at each pixel in the ROI maxg - the maximum projection of pixel-by-pixel G values clusts - cell array containing all of the SR localizations contained in each cluster ahull - cell array containing the alpha-hull of each cluster, both inner and outer Clarea - a 2 x n array of the area of each cluster (nm^2), based on alpha-hull, both inner and outer compact - a 2 x n array of cluster compactness measurements, both inner and outer density - a 2 x n array of the cluster density/whole cell density values, both inner and outer neardist - a 2 x n array of nearest cluster distances, both inner and outer eqdiameter - a 2 x n array of cluster equivalent diameters, both inner and outer estmndiam 1 x 2 array, the mean equivalent diameter, both inner and outer hop - the results of the Hopkins test rip - a 1x4 cell array containing the results of the Ripley test, in this order: (), the distance step-size, (), and (). DBcounts - cell array containing the number of SR localizations per DBSCAN cluster DBhull - cell array containing the convex hull of each DBSCAN cluster DBdiam - a 1 x n array of cluster equivalent diameters DBmnDiam - the mean cluster equivalent diameter DBarea - cell array containing the area of each DBSCAN cluster (based on convex hull)
18 paircorr - a 1x4 cell array containing: the ROI image; a matrix with the radius values in column 1, the angularly averaged autocorrelation function in column 2, and the errors of the angularly averaged autocorrelation function in column 3; the average density rho; and the 2D autocorrelation function fitresults - a matrix containing the estimated fitting parameters (objects per domain, sigma for 2D Gaussian domain size, observations per object, sigma for Gaussian localization precision) with one row for each ROI or one row for the combined ROIs model - the fit model generated from these parameters params - the list of parameters used in generating these results. Additionally, all plots will be automatically saved to the same directory. The plots are saved as.fig files, which facilitates format changes and allows the plots to be exported in a number of other formats by the user. The exception to this is the Hopkins plot and DBSCAN plot which, due to an asyet unsolved bug, must be saved as a.png file (sorry for the inconvenience). 4 References
19 1. Getis, A., and J. K. Ord The analysis of spatial association by use of distance statistics. Geographical Analysis 24: Getis, A., and J. Aldstadt Constructing the spatial weights matrix using a local statistic. Geographical Analysis 36: Zhang, J., Leiderman, K., Pfeiffer, J., Wilson, B., Oliver, J., and Steinberg, S Characterizing the Topography and Interactions of Membrane Receptors and Signaling Molecules from Spatial Patterns Obtained using Nanometer-scale Electron-dense Probes and Electron Microscopy, Micron, 37: Ester, Martin, et al. "A density-based algorithm for discovering clusters in large spatial databases with noise." KDD. Vol Veatch, Sarah L., et al. "Correlation functions quantify super-resolution images and estimate apparent clustering due to over-counting." PloS one 7.2 (2012): e31457.
DS504/CS586: Big Data Analytics Big Data Clustering II
 Welcome to DS504/CS586: Big Data Analytics Big Data Clustering II Prof. Yanhua Li Time: 6pm 8:50pm Thu Location: KH 116 Fall 2017 Updates: v Progress Presentation: Week 15: 11/30 v Next Week Office hours
DS504/CS586: Big Data Analytics Big Data Clustering II
 Welcome to DS504/CS586: Big Data Analytics Big Data Clustering II Prof. Yanhua Li Time: 6pm 8:50pm Thu Location: AK 232 Fall 2016 More Discussions, Limitations v Center based clustering K-means BFR algorithm
Density-based clustering algorithms DBSCAN and SNN
 Density-based clustering algorithms DBSCAN and SNN Version 1.0, 25.07.2005 Adriano Moreira, Maribel Y. Santos and Sofia Carneiro {adriano, maribel, sofia}@dsi.uminho.pt University of Minho - Portugal 1.
University of Florida CISE department Gator Engineering. Clustering Part 4
 Clustering Part 4 Dr. Sanjay Ranka Professor Computer and Information Science and Engineering University of Florida, Gainesville DBSCAN DBSCAN is a density based clustering algorithm Density = number of
Clustering Part 4 DBSCAN
 Clustering Part 4 Dr. Sanjay Ranka Professor Computer and Information Science and Engineering University of Florida, Gainesville DBSCAN DBSCAN is a density based clustering algorithm Density = number of
DBSCAN. Presented by: Garrett Poppe
 DBSCAN Presented by: Garrett Poppe A density-based algorithm for discovering clusters in large spatial databases with noise by Martin Ester, Hans-peter Kriegel, Jörg S, Xiaowei Xu Slides adapted from resources
Distance-based Methods: Drawbacks
 Distance-based Methods: Drawbacks Hard to find clusters with irregular shapes Hard to specify the number of clusters Heuristic: a cluster must be dense Jian Pei: CMPT 459/741 Clustering (3) 1 How to Find
Clustering CS 550: Machine Learning
 Clustering CS 550: Machine Learning This slide set mainly uses the slides given in the following links: http://www-users.cs.umn.edu/~kumar/dmbook/ch8.pdf http://www-users.cs.umn.edu/~kumar/dmbook/dmslides/chap8_basic_cluster_analysis.pdf
Insight: Measurement Tool. User Guide
 OMERO Beta v2.2: Measurement Tool User Guide - 1 - October 2007 Insight: Measurement Tool User Guide Open Microscopy Environment: http://www.openmicroscopy.org OMERO Beta v2.2: Measurement Tool User Guide
COMP 465: Data Mining Still More on Clustering
 3/4/015 Exercise COMP 465: Data Mining Still More on Clustering Slides Adapted From : Jiawei Han, Micheline Kamber & Jian Pei Data Mining: Concepts and Techniques, 3 rd ed. Describe each of the following
Data Mining 4. Cluster Analysis
 Data Mining 4. Cluster Analysis 4.5 Spring 2010 Instructor: Dr. Masoud Yaghini Introduction DBSCAN Algorithm OPTICS Algorithm DENCLUE Algorithm References Outline Introduction Introduction Density-based
Multivariate Capability Analysis
 Multivariate Capability Analysis Summary... 1 Data Input... 3 Analysis Summary... 4 Capability Plot... 5 Capability Indices... 6 Capability Ellipse... 7 Correlation Matrix... 8 Tests for Normality... 8
1. ABOUT INSTALLATION COMPATIBILITY SURESIM WORKFLOWS a. Workflow b. Workflow SURESIM TUTORIAL...
 SuReSim manual 1. ABOUT... 2 2. INSTALLATION... 2 3. COMPATIBILITY... 2 4. SURESIM WORKFLOWS... 2 a. Workflow 1... 3 b. Workflow 2... 4 5. SURESIM TUTORIAL... 5 a. Import Data... 5 b. Parameter Selection...
Clustering Documentation
 Clustering Documentation Release 0.3.0 Dahua Lin and contributors Dec 09, 2017 Contents 1 Overview 3 1.1 Inputs................................................... 3 1.2 Common Options.............................................
A New Online Clustering Approach for Data in Arbitrary Shaped Clusters
 A New Online Clustering Approach for Data in Arbitrary Shaped Clusters Richard Hyde, Plamen Angelov Data Science Group, School of Computing and Communications Lancaster University Lancaster, LA1 4WA, UK
Nature Methods: doi: /nmeth Supplementary Figure 1
 Supplementary Figure 1 Performance analysis under four different clustering scenarios. Performance analysis under four different clustering scenarios. i) Standard Conditions, ii) a sparse data set with
EN1610 Image Understanding Lab # 3: Edges
 EN1610 Image Understanding Lab # 3: Edges The goal of this fourth lab is to ˆ Understanding what are edges, and different ways to detect them ˆ Understand different types of edge detectors - intensity,
Cognalysis TM Reserving System User Manual
 Cognalysis TM Reserving System User Manual Return to Table of Contents 1 Table of Contents 1.0 Starting an Analysis 3 1.1 Opening a Data File....3 1.2 Open an Analysis File.9 1.3 Create Triangles.10 2.0
ECE 176 Digital Image Processing Handout #14 Pamela Cosman 4/29/05 TEXTURE ANALYSIS
 ECE 176 Digital Image Processing Handout #14 Pamela Cosman 4/29/ TEXTURE ANALYSIS Texture analysis is covered very briefly in Gonzalez and Woods, pages 66 671. This handout is intended to supplement that
Clustering Algorithms for Data Stream
 Clustering Algorithms for Data Stream Karishma Nadhe 1, Prof. P. M. Chawan 2 1Student, Dept of CS & IT, VJTI Mumbai, Maharashtra, India 2Professor, Dept of CS & IT, VJTI Mumbai, Maharashtra, India Abstract:
Data Analysis and Solver Plugins for KSpread USER S MANUAL. Tomasz Maliszewski
 Data Analysis and Solver Plugins for KSpread USER S MANUAL Tomasz Maliszewski tmaliszewski@wp.pl Table of Content CHAPTER 1: INTRODUCTION... 3 1.1. ABOUT DATA ANALYSIS PLUGIN... 3 1.3. ABOUT SOLVER PLUGIN...
Cluster Analysis (b) Lijun Zhang
 Lijun Zhang") Cluster Analysis (b) Lijun Zhang zlj@nju.edu.cn http://cs.nju.edu.cn/zlj Outline Grid-Based and Density-Based Algorithms Graph-Based Algorithms Non-negative Matrix Factorization Cluster Validation Summary
Cluster Analysis (b) Lijun Zhang zlj@nju.edu.cn http://cs.nju.edu.cn/zlj Outline Grid-Based and Density-Based Algorithms Graph-Based Algorithms Non-negative Matrix Factorization Cluster Validation Summary
Lecture-17: Clustering with K-Means (Contd: DT + Random Forest)
") Lecture-17: Clustering with K-Means (Contd: DT + Random Forest) Medha Vidyotma April 24, 2018 1 Contd. Random Forest For Example, if there are 50 scholars who take the measurement of the length of the
Lecture-17: Clustering with K-Means (Contd: DT + Random Forest) Medha Vidyotma April 24, 2018 1 Contd. Random Forest For Example, if there are 50 scholars who take the measurement of the length of the
EE795: Computer Vision and Intelligent Systems
 EE795: Computer Vision and Intelligent Systems Spring 2012 TTh 17:30-18:45 WRI C225 Lecture 04 130131 http://www.ee.unlv.edu/~b1morris/ecg795/ 2 Outline Review Histogram Equalization Image Filtering Linear
Unsupervised Learning : Clustering
 Unsupervised Learning : Clustering Things to be Addressed Traditional Learning Models. Cluster Analysis K-means Clustering Algorithm Drawbacks of traditional clustering algorithms. Clustering as a complex
Geostatistics 2D GMS 7.0 TUTORIALS. 1 Introduction. 1.1 Contents
 GMS 7.0 TUTORIALS 1 Introduction Two-dimensional geostatistics (interpolation) can be performed in GMS using the 2D Scatter Point module. The module is used to interpolate from sets of 2D scatter points
ECG782: Multidimensional Digital Signal Processing
 Professor Brendan Morris, SEB 3216, brendan.morris@unlv.edu ECG782: Multidimensional Digital Signal Processing Spatial Domain Filtering http://www.ee.unlv.edu/~b1morris/ecg782/ 2 Outline Background Intensity
Supplementary Material
 Supplementary Material Figure 1S: Scree plot of the 400 dimensional data. The Figure shows the 20 largest eigenvalues of the (normalized) correlation matrix sorted in decreasing order; the insert shows
Cluster Analysis of Super Resolution Fluorescence Images Ki Woong Sung
 NSERC USRA Report Summer 2015 Cluster Analysis of Super Resolution Fluorescence Images Ki Woong Sung 1 Biological Backgound Direct Stochastic Optical Reconstruction Microscopy (dstorm) is a novel, high
Physics MRI Research Centre UNIFIT VERSION User s Guide
 Physics MRI Research Centre UNIFIT VERSION 1.24 User s Guide Note: If an error occurs please quit UNIFIT and type:.reset in the IDL command line, and restart UNIFIT. Last Update November 2016 by Katie
Fast and accurate automated cell boundary determination for fluorescence microscopy
 Fast and accurate automated cell boundary determination for fluorescence microscopy Stephen Hugo Arce, Pei-Hsun Wu &, and Yiider Tseng Department of Chemical Engineering, University of Florida and National
ArcView QuickStart Guide. Contents. The ArcView Screen. Elements of an ArcView Project. Creating an ArcView Project. Adding Themes to Views
 ArcView QuickStart Guide Page 1 ArcView QuickStart Guide Contents The ArcView Screen Elements of an ArcView Project Creating an ArcView Project Adding Themes to Views Zoom and Pan Tools Querying Themes
Texture Analysis. Selim Aksoy Department of Computer Engineering Bilkent University
 Texture Analysis Selim Aksoy Department of Computer Engineering Bilkent University saksoy@cs.bilkent.edu.tr Texture An important approach to image description is to quantify its texture content. Texture
COMPARISON OF DENSITY-BASED CLUSTERING ALGORITHMS
 COMPARISON OF DENSITY-BASED CLUSTERING ALGORITHMS Mariam Rehman Lahore College for Women University Lahore, Pakistan mariam.rehman321@gmail.com Syed Atif Mehdi University of Management and Technology Lahore,
Analysis and Extensions of Popular Clustering Algorithms
 Analysis and Extensions of Popular Clustering Algorithms Renáta Iváncsy, Attila Babos, Csaba Legány Department of Automation and Applied Informatics and HAS-BUTE Control Research Group Budapest University
The Projected Dip-means Clustering Algorithm
 Theofilos Chamalis Department of Computer Science & Engineering University of Ioannina GR 45110, Ioannina, Greece thchama@cs.uoi.gr ABSTRACT One of the major research issues in data clustering concerns
6. Object Identification L AK S H M O U. E D U
 6. Object Identification L AK S H M AN @ O U. E D U Objects Information extracted from spatial grids often need to be associated with objects not just an individual pixel Group of pixels that form a real-world
Points Lines Connected points X-Y Scatter. X-Y Matrix Star Plot Histogram Box Plot. Bar Group Bar Stacked H-Bar Grouped H-Bar Stacked
 Plotting Menu: QCExpert Plotting Module graphs offers various tools for visualization of uni- and multivariate data. Settings and options in different types of graphs allow for modifications and customizations
CHAPTER 7. PAPER 3: EFFICIENT HIERARCHICAL CLUSTERING OF LARGE DATA SETS USING P-TREES
 CHAPTER 7. PAPER 3: EFFICIENT HIERARCHICAL CLUSTERING OF LARGE DATA SETS USING P-TREES 7.1. Abstract Hierarchical clustering methods have attracted much attention by giving the user a maximum amount of
Clustering Algorithm (DBSCAN) VISHAL BHARTI Computer Science Dept. GC, CUNY
 VISHAL BHARTI Computer Science Dept. GC, CUNY") Clustering Algorithm (DBSCAN) VISHAL BHARTI Computer Science Dept. GC, CUNY Clustering Algorithm Clustering is an unsupervised machine learning algorithm that divides a data into meaningful sub-groups,
Clustering Algorithm (DBSCAN) VISHAL BHARTI Computer Science Dept. GC, CUNY Clustering Algorithm Clustering is an unsupervised machine learning algorithm that divides a data into meaningful sub-groups,
STATS PAD USER MANUAL
 STATS PAD USER MANUAL For Version 2.0 Manual Version 2.0 1 Table of Contents Basic Navigation! 3 Settings! 7 Entering Data! 7 Sharing Data! 8 Managing Files! 10 Running Tests! 11 Interpreting Output! 11
Digital Image Processing. Prof. P.K. Biswas. Department of Electronics & Electrical Communication Engineering
 Digital Image Processing Prof. P.K. Biswas Department of Electronics & Electrical Communication Engineering Indian Institute of Technology, Kharagpur Image Segmentation - III Lecture - 31 Hello, welcome
2D Image Processing INFORMATIK. Kaiserlautern University. DFKI Deutsches Forschungszentrum für Künstliche Intelligenz
 2D Image Processing - Filtering Prof. Didier Stricker Kaiserlautern University http://ags.cs.uni-kl.de/ DFKI Deutsches Forschungszentrum für Künstliche Intelligenz http://av.dfki.de 1 What is image filtering?
Lab 12: Sampling and Interpolation
 Lab 12: Sampling and Interpolation What You ll Learn: -Systematic and random sampling -Majority filtering -Stratified sampling -A few basic interpolation methods Videos that show how to copy/paste data
Operators-Based on Second Derivative double derivative Laplacian operator Laplacian Operator Laplacian Of Gaussian (LOG) Operator LOG
 Operator LOG") Operators-Based on Second Derivative The principle of edge detection based on double derivative is to detect only those points as edge points which possess local maxima in the gradient values. Laplacian
Operators-Based on Second Derivative The principle of edge detection based on double derivative is to detect only those points as edge points which possess local maxima in the gradient values. Laplacian
Solve a Maze via Search
 Northeastern University CS4100 Artificial Intelligence Fall 2017, Derbinsky Solve a Maze via Search By the end of this project you will have built an application that applies graph search to solve a maze,
Automatic Partiicle Tracking Software USE ER MANUAL Update: May 2015
 Automatic Particle Tracking Software USER MANUAL Update: May 2015 File Menu The micrograph below shows the panel displayed when a movie is opened, including a playback menu where most of the parameters
CSE 5243 INTRO. TO DATA MINING
 CSE 5243 INTRO. TO DATA MINING Cluster Analysis: Basic Concepts and Methods Huan Sun, CSE@The Ohio State University 09/28/2017 Slides adapted from UIUC CS412, Fall 2017, by Prof. Jiawei Han 2 Chapter 10.
ECG782: Multidimensional Digital Signal Processing
 Professor Brendan Morris, SEB 3216, brendan.morris@unlv.edu ECG782: Multidimensional Digital Signal Processing Spring 2014 TTh 14:30-15:45 CBC C313 Lecture 03 Image Processing Basics 13/01/28 http://www.ee.unlv.edu/~b1morris/ecg782/
Lecture #5. Point transformations (cont.) Histogram transformations. Intro to neighborhoods and spatial filtering
 Histogram transformations. Intro to neighborhoods and spatial filtering") Lecture #5 Point transformations (cont.) Histogram transformations Equalization Specification Local vs. global operations Intro to neighborhoods and spatial filtering Brightness & Contrast 2002 R. C. Gonzalez
Lecture #5 Point transformations (cont.) Histogram transformations Equalization Specification Local vs. global operations Intro to neighborhoods and spatial filtering Brightness & Contrast 2002 R. C. Gonzalez
Density Based Clustering using Modified PSO based Neighbor Selection
 Density Based Clustering using Modified PSO based Neighbor Selection K. Nafees Ahmed Research Scholar, Dept of Computer Science Jamal Mohamed College (Autonomous), Tiruchirappalli, India nafeesjmc@gmail.com
Algorithm User Guide:
 Algorithm User Guide: Membrane Quantification Use the Aperio algorithms to adjust (tune) the parameters until the quantitative results are sufficiently accurate for the purpose for which you intend to
Notes. Reminder: HW2 Due Today by 11:59PM. Review session on Thursday. Midterm next Tuesday (10/09/2018)
") 1 Notes Reminder: HW2 Due Today by 11:59PM TA s note: Please provide a detailed ReadMe.txt file on how to run the program on the STDLINUX. If you installed/upgraded any package on STDLINUX, you should
1 Notes Reminder: HW2 Due Today by 11:59PM TA s note: Please provide a detailed ReadMe.txt file on how to run the program on the STDLINUX. If you installed/upgraded any package on STDLINUX, you should
Excel 2010 with XLSTAT
 Excel 2010 with XLSTAT J E N N I F E R LE W I S PR I E S T L E Y, PH.D. Introduction to Excel 2010 with XLSTAT The layout for Excel 2010 is slightly different from the layout for Excel 2007. However, with
Implemented by Valsamis Douskos Laboratoty of Photogrammetry, Dept. of Surveying, National Tehnical University of Athens
 An open-source toolbox in Matlab for fully automatic calibration of close-range digital cameras based on images of chess-boards FAUCCAL (Fully Automatic Camera Calibration) Implemented by Valsamis Douskos
Particle localization and tracking GUI: TrackingGUI_rp.m
 Particle localization and tracking GUI: TrackingGUI_rp.m Raghuveer Parthasarathy Department of Physics The University of Oregon raghu@uoregon.edu Begun April, 2012 (based on earlier work). Last modified
Automated AFM Image Processing User Manual
 Automated AFM Image Processing User Manual Starting The Program Open and run the GUI_run_me.m script in Matlab to start the program. The first thing to do is to select the folder that contains the images
Data Clustering Hierarchical Clustering, Density based clustering Grid based clustering
 Data Clustering Hierarchical Clustering, Density based clustering Grid based clustering Team 2 Prof. Anita Wasilewska CSE 634 Data Mining All Sources Used for the Presentation Olson CF. Parallel algorithms
6-1 THE STANDARD NORMAL DISTRIBUTION
 6-1 THE STANDARD NORMAL DISTRIBUTION The major focus of this chapter is the concept of a normal probability distribution, but we begin with a uniform distribution so that we can see the following two very
Cell based GIS. Introduction to rasters
 Week 9 Cell based GIS Introduction to rasters topics of the week Spatial Problems Modeling Raster basics Application functions Analysis environment, the mask Application functions Spatial Analyst in ArcGIS
Data Mining Algorithms
 for the original version: -JörgSander and Martin Ester - Jiawei Han and Micheline Kamber Data Management and Exploration Prof. Dr. Thomas Seidl Data Mining Algorithms Lecture Course with Tutorials Wintersemester
1. Introduction Installation and requirements... 2
 1 Table of Contents 1. Introduction... 2 2. Installation and requirements... 2 3. Utilization of the CRB analysis plugin through the interactive graphical interfaces 3.1 Initial settings... 3 3.2 Results
SynapsesSA. User Reference Manual. Version 1.0. Luis Rodriguez-Lujan Laura Antón-Sánchez Pedro Larrañaga Concha Bielza
 SynapsesSA User Reference Manual Version 1.0 Luis Rodriguez-Lujan Laura Antón-Sánchez Pedro Larrañaga Concha Bielza luis.rodriguezl@alumnos.upm.es l.anton-sanchez@upm.es pedro.larranaga@fi.upm.es mcbielza@fi.upm.es
TexRAD Research Version Client User Guide Version 3.9
 Imaging tools for medical decision makers Cambridge Computed Imaging Ltd Grange Park Broadway Bourn Cambridge CB23 2TA UK TexRAD Research Version Client User Guide Version 3.9 Release date 23/05/2016 Number
Schedule for Rest of Semester
 Schedule for Rest of Semester Date Lecture Topic 11/20 24 Texture 11/27 25 Review of Statistics & Linear Algebra, Eigenvectors 11/29 26 Eigenvector expansions, Pattern Recognition 12/4 27 Cameras & calibration
Working with Unlabeled Data Clustering Analysis. Hsiao-Lung Chan Dept Electrical Engineering Chang Gung University, Taiwan
 Working with Unlabeled Data Clustering Analysis Hsiao-Lung Chan Dept Electrical Engineering Chang Gung University, Taiwan chanhl@mail.cgu.edu.tw Unsupervised learning Finding centers of similarity using
Contrast Optimization A new way to optimize performance Kenneth Moore, Technical Fellow
 Contrast Optimization A new way to optimize performance Kenneth Moore, Technical Fellow What is Contrast Optimization? Contrast Optimization (CO) is a new technique for improving performance of imaging
Clustering Lecture 4: Density-based Methods
 Clustering Lecture 4: Density-based Methods Jing Gao SUNY Buffalo 1 Outline Basics Motivation, definition, evaluation Methods Partitional Hierarchical Density-based Mixture model Spectral methods Advanced
Morphological Image Processing
 Morphological Image Processing Morphology Identification, analysis, and description of the structure of the smallest unit of words Theory and technique for the analysis and processing of geometric structures
Notes. Reminder: HW2 Due Today by 11:59PM. Review session on Thursday. Midterm next Tuesday (10/10/2017)
") 1 Notes Reminder: HW2 Due Today by 11:59PM TA s note: Please provide a detailed ReadMe.txt file on how to run the program on the STDLINUX. If you installed/upgraded any package on STDLINUX, you should
1 Notes Reminder: HW2 Due Today by 11:59PM TA s note: Please provide a detailed ReadMe.txt file on how to run the program on the STDLINUX. If you installed/upgraded any package on STDLINUX, you should
4. TROUBLESHOOTING PREVIOUS VERSIONS RUN LOLITRACK ALWAYS AS ADMIN WIBU SOFTWARE PROTECTION... 30
 Version 4.2.0 CONTENTS 1. GETTING STARTED... 2 2. TYPICAL APPLICATIONS... 4 3. USER GUIDE... 5 3.1 SINGLE OBJECT MODE... 7 3.2 SINGLE ARENA MODE... 12 3.3 EVENT RECORDER... 19 3.4 BATCH TRACKING... 21
CPSC 340: Machine Learning and Data Mining. Density-Based Clustering Fall 2016
 CPSC 340: Machine Learning and Data Mining Density-Based Clustering Fall 2016 Assignment 1 : Admin 2 late days to hand it in before Wednesday s class. 3 late days to hand it in before Friday s class. 0
OPTICS-OF: Identifying Local Outliers
 Proceedings of the 3rd European Conference on Principles and Practice of Knowledge Discovery in Databases (PKDD 99), Prague, September 1999. OPTICS-OF: Identifying Local Outliers Markus M. Breunig, Hans-Peter
Data and Function Plotting with MATLAB (Linux-10)
") Data and Function Plotting with MATLAB (Linux-10) This tutorial describes the use of MATLAB for general plotting of experimental data and equations and for special plots like histograms. (Astronomers -
Data and Function Plotting with MATLAB (Linux-10) This tutorial describes the use of MATLAB for general plotting of experimental data and equations and for special plots like histograms. (Astronomers -
The Ball-Pivoting Algorithm for Surface Reconstruction
 The Ball-Pivoting Algorithm for Surface Reconstruction 1. Briefly summarize the paper s contributions. Does it address a new problem? Does it present a new approach? Does it show new types of results?
Anno accademico 2006/2007. Davide Migliore
 Robotica Anno accademico 6/7 Davide Migliore migliore@elet.polimi.it Today What is a feature? Some useful information The world of features: Detectors Edges detection Corners/Points detection Descriptors?!?!?
SYDE Winter 2011 Introduction to Pattern Recognition. Clustering
 SYDE 372 - Winter 2011 Introduction to Pattern Recognition Clustering Alexander Wong Department of Systems Design Engineering University of Waterloo Outline 1 2 3 4 5 All the approaches we have learned
ENVI Tutorial: Introduction to ENVI
 ENVI Tutorial: Introduction to ENVI Table of Contents OVERVIEW OF THIS TUTORIAL...1 GETTING STARTED WITH ENVI...1 Starting ENVI...1 Starting ENVI on Windows Machines...1 Starting ENVI in UNIX...1 Starting
Chapter 2 Basic Structure of High-Dimensional Spaces
 Chapter 2 Basic Structure of High-Dimensional Spaces Data is naturally represented geometrically by associating each record with a point in the space spanned by the attributes. This idea, although simple,
How to Measure Wedge. Purpose. Introduction. Tools Needed
 Purpose Optical Wedge Application (OWA) is an add-on analysis tool for measurement of optical wedges in either transmission or reflection. OWA can measure a single part or many parts simultaneously (e.g.
Introduction. Computer Vision & Digital Image Processing. Preview. Basic Concepts from Set Theory
 Introduction Computer Vision & Digital Image Processing Morphological Image Processing I Morphology a branch of biology concerned with the form and structure of plants and animals Mathematical morphology
FlowJo Software Lecture Outline:
 FlowJo Software Lecture Outline: Workspace Basics: 3 major components 1) The Ribbons (toolbar) The availability of buttons here can be customized. *One of the best assets of FlowJo is the help feature*
Texture. Texture is a description of the spatial arrangement of color or intensities in an image or a selected region of an image.
 Texture Texture is a description of the spatial arrangement of color or intensities in an image or a selected region of an image. Structural approach: a set of texels in some regular or repeated pattern
Lecture 6: Multimedia Information Retrieval Dr. Jian Zhang
 Lecture 6: Multimedia Information Retrieval Dr. Jian Zhang NICTA & CSE UNSW COMP9314 Advanced Database S1 2007 jzhang@cse.unsw.edu.au Reference Papers and Resources Papers: Colour spaces-perceptual, historical
Histograms. h(r k ) = n k. p(r k )= n k /NM. Histogram: number of times intensity level rk appears in the image
 = n k. p(r k )= n k /NM. Histogram: number of times intensity level rk appears in the image") Histograms h(r k ) = n k Histogram: number of times intensity level rk appears in the image p(r k )= n k /NM normalized histogram also a probability of occurence 1 Histogram of Image Intensities Create
Histograms h(r k ) = n k Histogram: number of times intensity level rk appears in the image p(r k )= n k /NM normalized histogram also a probability of occurence 1 Histogram of Image Intensities Create
Unsupervised learning on Color Images
 Unsupervised learning on Color Images Sindhuja Vakkalagadda 1, Prasanthi Dhavala 2 1 Computer Science and Systems Engineering, Andhra University, AP, India 2 Computer Science and Systems Engineering, Andhra
CSE 252B: Computer Vision II
 CSE 252B: Computer Vision II Lecturer: Serge Belongie Scribes: Jeremy Pollock and Neil Alldrin LECTURE 14 Robust Feature Matching 14.1. Introduction Last lecture we learned how to find interest points
Algorithm User Guide:
 Algorithm User Guide: Microvessel Analysis Use the Aperio algorithms to adjust (tune) the parameters until the quantitative results are sufficiently accurate for the purpose for which you intend to use
Coarse-to-fine image registration
 Today we will look at a few important topics in scale space in computer vision, in particular, coarseto-fine approaches, and the SIFT feature descriptor. I will present only the main ideas here to give
Region-based Segmentation
 Region-based Segmentation Image Segmentation Group similar components (such as, pixels in an image, image frames in a video) to obtain a compact representation. Applications: Finding tumors, veins, etc.
Determination of Optimal Epsilon (Eps) Value on DBSCAN Algorithm to Clustering Data on Peatland Hotspots in Sumatra
 Value on DBSCAN Algorithm to Clustering Data on Peatland Hotspots in Sumatra") IOP Conference Series: Earth and Environmental Science PAPER OPEN ACCESS Determination of Optimal Epsilon (Eps) Value on DBSCAN Algorithm to Clustering Data on Peatland Hotspots in Sumatra Related content
IOP Conference Series: Earth and Environmental Science PAPER OPEN ACCESS Determination of Optimal Epsilon (Eps) Value on DBSCAN Algorithm to Clustering Data on Peatland Hotspots in Sumatra Related content
button in the lower-left corner of the panel if you have further questions throughout this tutorial.
 Mosaic Tutorial: Simple Workflow This tutorial demonstrates how to use the Seamless Mosaic tool to mosaic six overlapping digital aerial scenes. You will learn about displaying footprints and image data
Image Processing
 Image Processing 159.731 Canny Edge Detection Report Syed Irfanullah, Azeezullah 00297844 Danh Anh Huynh 02136047 1 Canny Edge Detection INTRODUCTION Edges Edges characterize boundaries and are therefore
CS443: Digital Imaging and Multimedia Binary Image Analysis. Spring 2008 Ahmed Elgammal Dept. of Computer Science Rutgers University
 CS443: Digital Imaging and Multimedia Binary Image Analysis Spring 2008 Ahmed Elgammal Dept. of Computer Science Rutgers University Outlines A Simple Machine Vision System Image segmentation by thresholding
ENVI Classic Tutorial: Introduction to ENVI Classic 2
 ENVI Classic Tutorial: Introduction to ENVI Classic Introduction to ENVI Classic 2 Files Used in This Tutorial 2 Getting Started with ENVI Classic 3 Loading a Gray Scale Image 3 ENVI Classic File Formats
Tutorial: Using Tina Vision s Quantitative Pattern Recognition Tool.
 Tina Memo No. 2014-004 Internal Report Tutorial: Using Tina Vision s Quantitative Pattern Recognition Tool. P.D.Tar. Last updated 07 / 06 / 2014 ISBE, Medical School, University of Manchester, Stopford
Contents. CRITERION Vantage 3 Analysis Training Manual. Introduction 1. Basic Functionality of CRITERION Analysis 5. Charts and Reports 17
 CRITERION Vantage 3 Analysis Training Manual Contents Introduction 1 Basic Functionality of CRITERION Analysis 5 Charts and Reports 17 Preferences and Defaults 53 2 Contents 1 Introduction 4 Application
Modify Panel. Flatten Tab
 AFM Image Processing Most images will need some post acquisition processing. A typical procedure is to: i) modify the image by flattening, using a planefit, and possibly also a mask, ii) analyzing the
University of Florida CISE department Gator Engineering. Clustering Part 5
 Clustering Part 5 Dr. Sanjay Ranka Professor Computer and Information Science and Engineering University of Florida, Gainesville SNN Approach to Clustering Ordinary distance measures have problems Euclidean
CHAOS Chaos Chaos Iterate
 CHAOS Chaos is a program that explores data analysis. A sequence of points is created which can be analyzed via one of the following five modes: 1. Time Series Mode, which plots a time series graph, that