Physics MRI Research Centre UNIFIT VERSION User s Guide
|
|
|
- Adrian White
- 5 years ago
- Views:
Transcription

1 Physics MRI Research Centre UNIFIT VERSION 1.24 User s Guide Note: If an error occurs please quit UNIFIT and type:.reset in the IDL command line, and restart UNIFIT. Last Update November 2016 by Katie Connor 1
2 INDEX Acknowledgements Page 3 Introduction Page 3 Running UNIFIT Page 3 Data used in UNIFIT Page 3 Fitting process Load data and time files Specify equation Use filters D fitting 2D fitting D fitting Instant fitting View results Export results Figures General overview D draw & 3D control panel 3D slice controller D draw & 2D control panel 1D draw & 1D control panel Data to fit & file list Result draw & equation panel Data / result view 2D and configure panel Data / result view 3D Export panel Configure more dialog Equation dialog Filter dialog ROI dialog Instant fitting Page 4 Page 4 Page 4 Page 4 Page 5 Page 6 Page 6 Page 6 Page 7 Page 7 (Figure Index) Figure 1 Figure 2 Figure 3 Figure 4 Figure 5 Figure 6 Figure 7 Figure 8 Figure 9 Figure 10 Figure 11 Figure 12 Figure 13 Figure 14 Figure 15 2
3 Acknowledgements UNIFIT is based on the original fitting code of Adam Richard and James Rioux. Ding Cai developed UNIFIT, with the input of numerous researchers in the UNB MRI Centre. Biao Wang fixed some bugs and modified Unifit to support DAT format files in December Special thanks to Bruce J. Balcom, Bryce MacMillan, Florin Marica, Ziheng Zhang, Michael Li, and many others. Introduction UNIFIT is designed to fit data to equations commonly encountered in MRI research. Currently UNIFIT can process 3D, 2D and 1D data, fitting equations for T1, T2 and T2* experiments. Running UNIFIT UNIFIT is started by typing unifit in the command line in IDL. Data used in UNIFIT 1)UNIFIT can read files in DAT or csv (comma separated values) format. The user must first process the data in ACCISS and export the data as DAT or csv files for UNIFIT. The data should be in magnitude (or image) format, and not in complex format. Various export formats are provided in ACCISS. The user needs to specify either 1D image Data or 2D image Data, and as CSV data for exporting a single image or all as CSV data * for exporting all of a set of images. * The order of files is very important in UNIFIT. It processes the files in the order that they appear in the directory listing. With older operating systems, files might be sorted as: data1 data10 data11 data12 data 2 data 3 data 4. When the user chooses Transformed Data/as byte data or all as CSV data, the files must be in the correct order, as the exported files will be named according their positions in the list. Although the user can adjust the order in UNIFIT, there is no such option in ACCISS. If the files not in order, rename the files, import them to ACCISS and process them again. 3

4 2) The user can also import generic data and times to perform a custom fitting. The data and time sets must be contained in two separate text files. Since this is neither 2D mapping nor 1D fitting data, the data set will simply be listed in the data list, and times in the time list. The user can apply the options outlined below and click the custom button on the fitting tab in the control panel. Fitting process Loading data and time files Loading wizard: when UNIFIT is initialized, a dialog is generated to import data files. Choose one ore more files and click OK. The current data file format should be.dat or.csv. A second dialog box is generated to import the time files. The current time file format should be.txt. loading data file: if UNIFIT is already running, go to file menu and choose load files to choose one or more data files and click OK. Alternatively, go to configure control tab, click the browse button of input path, choose one ore more files and click OK. The current data file format should be.dat or.csv. loading time file: if UNIFIT is already running, go to file menu and choose load Tau Table to choose one or more time files and click OK. Alternatively, go to configure control tab, click the browse button of time file, choose one or more files and click OK. The current data file format should be.txt. Specify equation Equation wizard: When UNIFIT is initialized, a box is generated to select the equation for the fitting routine. Equation select: if UNIFIT is already running, to select the equation see figure 12. It is important to save your results before changing the equation type, as this will alter the format of the output. 4
5 Use Filters There are two filters for 2D fitting. 1. Signal level filter: is used to remove noisy pixels before the fitting procedure begins. Pixels whose intensity in the first image is below the threshold will be masked. Users may disable the filter [4.19], adjust the threshold level [4.8], display the filter [4.7], and choose the color of the mask [4.3]. 2. Error level filter: is used to remove noisy pixels resulting from the fitting procedure. Pixels with statistical uncertainties greater than the threshold will be masked. Masked pixels will be designated in the ROI list [6.11] with the notation < bad uncertainty. Users may disable the filter [4.17], adjust the threshold level [4.9], display the filter [4.7], and choose the color of the mask [4.6]. 3D fitting: 1. Set threshold: use the threshold slider [2.8] to adjust the surface threshold of a 3D object. 2. Set angles: an object can be rotated either with the mouse by clicking on the object in the 3D draw window [2.12] and dragging the object to rotate it, or with the sliders [2.5] as x angle sliders, [2.6] as y angle sliders and [2.7] as z angle sliders. 3. Do the fitting: a) Fit single slice: i. Set slice: to set the slice, either click on the mini 3D draw window [2.1] directly or use the z slice position slider [3.3] to set the position of the slice. A line showing the location of the slice will be plotted in the mini-draw window as [3.2]. ii. Do the 2D fitting: see 2D fitting section. b) Fit slices in a range: i. Set range: enter the start and end slice positions in slice range boxes [3.7]. ii. Preview the range: two red lines will be plotted in mini 3D draw window [2.1] to present the range. iii. Set filters for each slice: as signals on each slice are different, we need to specify the signal filter and error filter for each slice. 1. (Optional) load the filter setting: If you have a saved filter setting file, you can load it. Each slice will be automatically configured. 2. Use the filter dialog: see figure 13. A convenient way is to apply a general setting of both filters to all the slices [13.7]. And then check slices one by one by selecting the slice index to see how the signal filter works. If a certain slice is not well filtered, then adjust the settings and use [13.1] to apply the changes. 5
6 iv. 3. (Optional) save the filter setting: If you like to save the settings presented in the filter dialog, you can save the settings to a file for next use. Fit the slices in the range: after everything is ready, click fit slices button [3.6] to fit the slices. 2D fitting There are currently 6 options in the 2D fitting: 1. Single pixel fit (default): this is the default setting. When the user clicks on the 2D draw window, the data from that position in each image will be extracted and listed in [6.12]. A green cross will indicate the position selected. These data are fit to the equation specified by the user. 2. Draw ROI and fit the average: click [4.12] to specify a ROI. Data within the ROI in each image will be averaged and the average fit as single pixel fitting. ROI information will be listed in [6.11]. 3. Draw ROI and fit each pixel: click [4.13] to specify a ROI. UNIFIT fits each pixel within the ROI. i.e. if there are 49 pixels in the ROI, the fitting routine will proceed 49 times for these 49 pixels. [4.11] displays the ROI and [4.16] sets the color of the mask. ROI information will be listed in [6.11]. 4. Average all pixels and fit the average: click [4.14] to apply. This is similar to Draw ROI and fit the average except that the ROI is the entire image. The user does not specify any position or ROI. 5. Pick all pixels and fit each pixel: click [4.15] to apply. This is similar to Draw ROI and fit each pixel except that the ROI is the entire image. Unifit fits all pixels individually within the image. A ROI is not specified. 1D fitting 1. Select the position of the data: use [5.2] to set the position, or enter the position value in text box and click the set button [5.3] to apply. 2. Single position fit: click [5.4] to begin the fitting process. The fitted data set will be listed in [6.12]. Instant fitting The purpose is 1) In general 3D, 2D, 1D fitting: to quickly fit the data set listed in [6.12] after modification is applied to the equation or the initial values. It s like a preview and test. 6
7 Only if a single pixel fit has just been processed, or a single data file (.txt) is imported, the data to be fit will be listed in [6.12]. If the time data is valid, clicking [7.2] initiates the customized fitting. The user can specify the initial values, change the equation, change the split line and perform the fit again. A quick fit based on the previous picked data set is performed, similar to [4.10] and [5.4] but based on the data listed in [6.12] and the times listed in [6.4]. 2) In the simple fitting using data and time (or y and x) provided by user: see description of Figure 15. View results 1. Info lists: for ROI fitting, the ROI information will be listed in [6.11] and time table will be listed in [6.4]. For a single fit, data will be listed in [6.12]. 2. Fitted curves: the fitted curves will be plotted in the result draw window [7.8]. Comments (the result of the fitting) will be plotted along with the curve in [7.8]. Comments controller [8.2] adjusts the position of the comments. For a ROI fitting with more than one result, clicking on the ROI information listed in [6.11] or using the ROI points slider [7.5] displays results for that position. 3. View the fitted params in 2D ROI or 3D range cases: it s a tricky part. As there are many pixels fitted and for each pixel there are more than one fitted param should be present. The large amount of data must be sorted/separated by some way. I use params to sort the results. Like param A, you can see in [8.1]. The 1 st option button is for the fitted param A matrix and second option button is for its uncertainty matrix. For a ROI fitting on 2D image/3d slice or for a 3D range fitting, the radio option buttons in [8.1] place the fitted parameter matrix in the data table [8.20]. The fitted parameter matrix is also plotted in the data view draw window [8.19] as 3D or 2D. Specific data can be viewed by selecting a position in the image and viewing the data table. [8.15] and [8.14] set the image brightness and contrast. Occasionally there are very large values which result in very bright pixels, in which case [8.13] / [9.3]can be used to modify them. [8.11] / [9.1]resets all data tables and draw options. See figure 08 and 09 for more details Export results Export options are covered in figure 10 applies these options. Exported files will be stored in the same folder as the imported data and time files. 7

8 Figure 1: General overview I separate the GUI into 3 parts: main draw area, mini draw area and the control panel. The main draw area is the entire left hand side; the mini draw area is on the top of the right hand side; the control panel area is the other half of right hand side. The menu bar is at the top of the interface. In the main GUI areas: - Main tabs [1.8]: images or curves are shown in the draw window. Data and related information are show in the data table or data list. - Mini tabs [1.2]: there are 2 mini tabs to present the current contents in 3D and 2D draw widgets. - Control tabs [1.4]: switches between different control panels. Some shared GUI elements: - Menu bar [1.1]: contains the common options of UNIFIT - Timer [1.6]: Show the estimated time left and used. It s not very accurate as the number of the data to be processed is dynamic in many cases. - Multiple file slider [1.5]: If more than one file is imported into UNIFIT, this slider will allow the user to select a particular file to review or process. - System message [1.7]: shows any messages from UNIFIT such as notices or errors. The most important messages will appear in a pop-up message box. - Dialogs [1.3]: the extra functions or utilities to help the process. 8
![Figure 2: 3D draw & 3D angle control In the 3D draw window area: - 3D draw window [2.12]: the window shows the 3D data as a 3D object. - Angle information bar [2.11]: shows the x, y and z angles.](/docs-images/85/92378020/images/9-0.jpg "- object / slice mode option button [2.10]: When in the object mode, the 3D object will response to the mouse event on 3D draw window [2.")
9 Figure 2: 3D draw & 3D angle control In the 3D draw window area: - 3D draw window [2.12]: the window shows the 3D data as a 3D object. - Angle information bar [2.11]: shows the x, y and z angles. - object / slice mode option button [2.10]: When in the object mode, the 3D object will response to the mouse event on 3D draw window [2.12] and rotate; when in the slice mode, a slice will be picked up according to position where the cursor is clicked on 3D draw window [2.12]. - Reset object position button [2.9]: resets all the angle sliders to zero. This includes [2.1], [2.4], [2.5], [2.6] and[2.7]. In the 3D mini draw area: - Mini 3D draw window [2.1]: same content as what plotted in 3D draw window [2.12] - Slice position on z axis slider [2.6]: Use the slider to pick the slice position along the z axis. In [3.3], there are two sliders are same. - object / slice mode option button [2.4]: When in the object mode, the 3D object will response to the mouse event on mini 3D draw window [2.1] and rotate; when in the slice mode, a slice will be picked up according to position where the cursor is clicked on mini 3D draw window [2.1]. In the 3D angle Control area: - X angle slider [2.5]: rotates the 3D object around the x axis. - Y angle slider [2.6]: rotates the 3D object around the y axis. - Z angle slider [2.7]: rotates the 3D object around the z axis. - Thresh slider [2.8]: The threshold slider controls how much of the image is displayed. Pixels with intensities higher than the threshold intensity appear in the image, while the remaining ones do not. 9
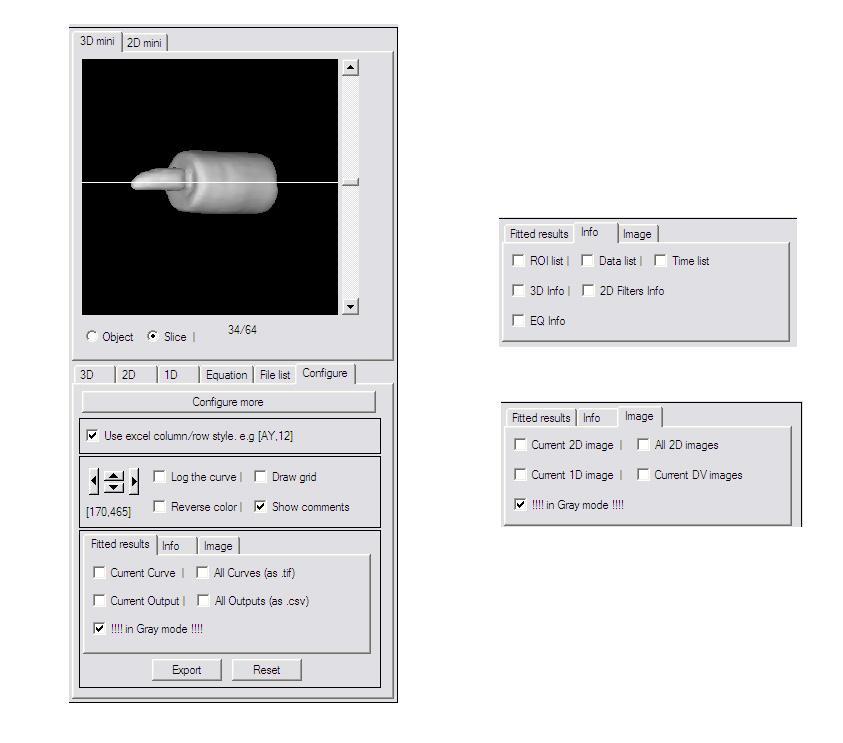
![Figure 3: 3D slice controller In the 3D draw window area: The current slice is plotted as a 2D image in 2D draw window [4.24]. When multiple files are used, a slice will be picked from each file.](/docs-images/85/92378020/images/10-0.jpg "User can view the slice of a certain file using the multi file slider [1.5]. In the 3D mini draw area: - Slice position on z axis slider [3.3]: picks the slice position along the z axis.")
10 Figure 3: 3D slice controller In the 3D draw window area: The current slice is plotted as a 2D image in 2D draw window [4.24]. When multiple files are used, a slice will be picked from each file. User can view the slice of a certain file using the multi file slider [1.5]. In the 3D mini draw area: - Slice position on z axis slider [3.3]: picks the slice position along the z axis. - Slice position line [3.2]: if the user clicks on the mini 3D draw window [3.1] or uses the z slice position sliders [3.3], to set the slice, a white line is plotted on the mini 3D draw window [2.1] showing the current slice position. - Slice position label [3.1]: shows the position where the current slice is picked In the 3D slice control area: - Slice position on z axis [3.3]: same as above. - Slice range boxes [3.6]: if the user wants to fit the entire or part of the 3D object, he could specify a range where the slices should be picked. E.g, if we say from 10 to 20, then the slices between 10 and 20 including 10 th and 20 th slices will be picked and fitted. - Preview slice range button [3.4]: after the user specified the beginning and the end positions, he could preview the range on the mini 3D draw window [2.1]. Two red lines will present the range. - Filter dialog button [3.5]: call the filter dialog. - Fit slices button [3.6]: click to fit the slices included in the range. After the fitting is finished, results will reform to a new 3D object and will be shown in data view window [8.19]. 10
11 Figure 4: 2D draw window & 2D control panel In the 2D draw window area: - 2D draw window [4.24]: the window shows the data as a 2D image. - Column slider [4.1]: adjusts the position of the vertical profile. - Row slider [4.23]: adjusts the position of the horizontal profile. - Position box [4.22]: the cursor position in the 2D draw window. - Value box [4.21]: the image intensity at the cursor position. - Previous fit position box [4.20]: the pixel position of the previous fit. - Reset view button [4.19]: resets the 2D view settings. In the 2D mini draw area: - Mini 2D draw window [4.4]: same content as what plotted in 2D draw window [4.24] - Continuous fitting button [4.2]: If the button is checked, the user just move the cursor over the pixels and get the fitted curve instantly; otherwise, the user has to pick the mouse to tell the program the pixel is picked for fitting. - position box [4.5]: the cursor position in the 2D mini draw window In the 2D control panel area: - Signal filter color option [4.3]: a droplist to select the color of the pixels excluded (masked) by the signal filter. - Error filter color option [4.6]: a droplist to select the color of the pixels excluded (masked) by the error filter. - Check box to show filters [4.7]: check this box to show both the signal and error filter masks. The masked pixels will be displayed with their respective filter colors. - Check box to use signal filter [4.18]: check this box to enable the signal filter. - Signal filter slider [4.8]: set the level of the signal filter. Pixels with signal levels below the specified level rate will be masked. Level = [(signal value of current pixel) (the min signal value)] / [(the max signal value) (the min signal value)] *100% - Check box to use error filter [4.17]: check this box to enable the error filter. - Error filter slider [4.9]: set the rate of the error filter. Pixels with uncertainties from the fitting routine above the specified rate will be masked. Level = (current uncertainties)/(current fitted parameters) *100% - ROI color [4.16]: a droplist to select the color of the ROI. - Single pixel fit (default) [4.10]: fits a single pixel to the specified equation. This is the default setting. Once the user clicks the image, the fitting will proceed. - Draw ROI and fit the average [4.12]: allows the user to fit the average of all pixels within a user defined region of interest (ROI) to a specific equation. 11
![- Draw ROI and fit each pixel [4.13]: allows the user to fit each pixel within a user defined region of interest (ROI) to a specific equation. - Average all pixels and fit the average [4.](/docs-images/85/92378020/images/12-0.jpg "14]: allows the user to fit the average of all pixels within the image to a specific equation. - Pick all pixels and fit each pixel [4.")
12 - Draw ROI and fit each pixel [4.13]: allows the user to fit each pixel within a user defined region of interest (ROI) to a specific equation. - Average all pixels and fit the average [4.14]: allows the user to fit the average of all pixels within the image to a specific equation. - Pick all pixels and fit each pixel [4.15]: allows the user to fit each pixel within the image to a specific equation. Note that this may take considerable time to process. 12
13 Figure 5: 1D Data & its Control In the 1D data area: - 1D draw window [5.7]: The current data position for fitting is plotted as an orange star. - Value of selected pixel [5.5]: the value of current selected pixel from the current selected file. In the 1D control area: - Data line options [5.1]: determines how the data are plotted. If Show data line is selected, the data will be plotted as a line. If Hide data line is selected, the data will be plotted as points. - Data position slider [5.2]: the current data position for fitting. - Data position textbox and the apply button [5.3]: allows for manual entry of the pixel to be fit. The value is only registered once the apply button is clicked. - Single position fit [5.4]: performs the single pixel fit on the data at the selected position. 13
![Figure 6: Data to fit & file list In the lists area: - ROI list [6.11]: If a ROI is applied and the fitting process is finished, the positions of each pixel in the ROI will be listed here.](/docs-images/85/92378020/images/14-0.jpg "If any of these positions in the list are selected with the mouse, its fitted curve will be plotted and the output will be updated in result window [7.7].")
14 Figure 6: Data to fit & file list In the lists area: - ROI list [6.11]: If a ROI is applied and the fitting process is finished, the positions of each pixel in the ROI will be listed here. If any of these positions in the list are selected with the mouse, its fitted curve will be plotted and the output will be updated in result window [7.7]. Note that the pixels that are filtered by the signal filter will not be listed. Fitted pixels in ROI: those pixels that are not filtered by the signal filter before the fitting, and by the error filter after the fitting, will be listed followed by a double line, ==============. If any of these positions are selected with the mouse, its fitted curve will be plotted and the output will be updated in result window [7.7]. Error filtered pixels in ROI: those pixels that are not filtered by the signal filter before the fitting but are filtered by the error filter after the fitting will be listed followed by a double line ============== and will be indicated with the notation < bad uncertainty. - Data list [6.12]: contains the data to be fit. For a single fit, there is only one data set and a corresponding time set. - Time list [6.4]: the table of time values for the fit. - Move selected data up/down [6.1] / [6.10]: move the selected data up/ down in the data list - Move selected data and time up/down [6.2] / [6.9]: move the selected data and time up/ down in both lists - Move selected time up/down [6.3] / [6.8]: move the selected time up/ down in the time list In the file list area: - Input file list [6.6]: contains the imported file names. When any filename is selected, the content drawn in main widows [2.12], [4.24], [5.6] and mini windows will be replaced with the current file. - Move selected file up/down [6.5] / [6.7]: move the selected file up/ down in the file list. The order of images or curves will be rearranged accordingly. 14
15 Figure 7: Result draw & Equation Result draw plots the fitted curve and shows the related results. In the result draw area: - Result draw window [7.8]: the window to plot the original data and the fitted curves. - Comments [7.1]: reports the results of the fitting process, including position information, the equation used and the fitted parameters in the Result draw window [7.8]. - Data to fit [7.6]: the original data are plotted as yellow star symbols. - Fitted curves [7.7]: the curve of best fit is plotted in red. - Slider of position in ROI [7.5]: similar to the ROI list on the set data tab. Appear only if a ROI is applied. The position numbers will be listed here. When a position is selected with the mouse, its fitted curve will be plotted and the output will be updated. In the fit control area: - Instant fit [7.2]: allows the user to tailor the fit to their data. The fit will be based on the data in the data [6.4] and time [6.12] lists. - Equation select: see figure Use my initial values [7.3]: before performing a fit of the data, UNIFIT determines the starting values of the various parameters. The user has the option of choosing a different set of initial values. - Current equation (as IDL codes) [7.4]: the equation we see in the comments is the print version. The equation used/called behind the software is a different one. The params are presented by arrays. E.g. if we got 3 params to fit, then an array with 3 elements, A[0],A[1] and [2] will be used in the equation. Although the 3 params we see in the comments might be named as A, T2 and C. It s useful especially when we set our own equation. We can see how our equation is transferred or worked at background. 15
16 Figure 8: Data/result view 2D & Configure panel In the data view area (top): - File info area [8.21]: shows the general file information. - Options of data to view [8.1]: there are up to 11 options to set. Image data is always available, which is the original data or the image data (magnitude data). The remaining options will be available when an ROI fitting process is complete. The fitted parameters and their uncertainties for all equations will be stored in matrix form. One matrix stores one kind of parameter or uncertainty. The first option is the parameter A (here it is checked) and the second option is the uncertainty of A (here it is unchecked). - Data table [8.20]: a table to view the data. In the data/result view area (bottom) (2D) - Position of the currently selected pixel [8.18] [8.17]: these two text boxes show the column and the row of the pixel selected by the user. Once the user clicks on the window [8.19], the corresponding data from that position in the table [8.5] will be displayed. - Value of the selected pixel [8.16]: shows the value of the currently selected pixel. This is the same as the value of the data in that position [8.18] and [8.17] of the table [8.20]. - Brightness slider [8.15]: set the brightness level of the image in [8.8]. - Contrast slider [8.14]: set the contrast slider level of the image in [8.8]. - Result filter slider [8.13]: occasionally there will be erroneously large values in the data matrix, which distort the dynamic range of the data. This produces a few very bright pixels, while the remaining pixels blend into the background. I separate the results into 100 levels from the minimum to the maximum. Use the filter to get rid of those high level data and click the apply button [8.12] to apply the changes. - Apply filter button [8.12]: Apply the changes and filter the high level data. Once filtered, a new 100 level will be separated. - Reset [8.11]: reset the current result or uncertainty. In the configure control: - Configure more button [8.4]: call/close the configure more dialog. See figure Check box to show position info in Excel style [8.5]: only useful for locating a pixel on 2D image. As each pixel on a 2D image is related to a data in a matrix, we can find the data in CSV file using excel. If we are using excel style, then the 16

17 column will be labeled by letters and row will be labeled by numbers; otherwise, both will be labeled by numbers which start from 0. - Comments position controllers [8.2]: a label to show the current position of the comments. 4 buttons control the position. Changes will be applied when the plot is refreshed. - Check box to plot fitted curve in log mod [8.3]: check this box to plot the data and results on a semi-log scale. - Check box to draw grid [8.6]: check this box to draw grids in the result draw window [8.1]. - Check box to reverse the color of result draw [8.8]: If you hate the black background of the result plot, then why not reverse the color to white? - Check box to show the comments [8.7]: If the comments are not needed to be shown up with the results, then uncheck the button. - Check boxes of export options [8.9]: select the images or data the user wishes to save. For details, see the figure Export button [8.11]: apply the checked options and save the images or data. The file names will contain the time that the file was saved. - Reset (in the export option area) [8.10]: uncheck all of the checked boxes of [8.9]. 17
18 Figure 9: Data/result view 3D & Configure panel In the data/result view area (bottom) (3D) - X angle slider [9.4]: rotates the 3D results around the x axis. - Y angle slider [9.5]: rotates the 3D results around the y axis. - Z angle slider [9.6]: rotates the 3D results around the z axis. - Thresh slider [9.7]: The threshold slider controls how much of the image is displayed. Pixels with intensities higher than the threshold intensity appear in the image, while the remaining ones do not. - Result filter slider [9.3]: occasionally there will be erroneously large values in the data matrix, which distort the dynamic range of the data. This produces a few very bright pixels, while the remaining pixels blend into the background. I separate the results into 100 levels from the minimum to the maximum. Use the filter to get rid of those high level data and click the apply button [8.12] to apply the changes. - Apply filter button [9.2]: Apply the changes and filter the high level data. Once filtered, a new 100 level will be separated. - Reset [9.1]: reset the current result or uncertainty. 18
19 Figure 10: Export panel In the results subtab area: - Current curve (as.tif) [10.15]: check to export the current image in the result draw window [7.8]. - All curves (as.tif) [10.16]: for an ROI fitting with more than one curve, check this box to export all of the fitted curves. Each curve, ordered from the first to last ROI position will be plotted and exported. - Current comments (as.txt) [10.14]: saves the comments printed with the result in the result draw window [7.8]. - All outputs (as.csv) [10.12]: for an ROI fitting, the results will be exported as multiple matrices for each of the different parameters. For example, in the biexponential T2* case, there will be 5 matrices written into 5 separate files: one each for the spin density and T2* of the first component, the spin density and T2* of the second component, and the offset. - Curves in gray mode [10.13]: check this to save all curves in grayscale format. The default condition is checked. In the info subtab area: - ROI list [10.2]: export the content listed in [6.11]. - Data list [10.3]: export the content listed in [6.12]. - Time list [10.4]: export the content listed in [6.4]. - 3D info [10.12]: export the information about a 3D object s angles, etc. The related components are [2.5], [2.6], [2.7] and [2.8]. - 2D Filters info [10.5]: export the information about the signal and error filters. The related components are [4.3], [4.6], [4.17], [4.18], [4.8] and [4.9]. - equation info [10.6]: the equation used for the fitting. Save the content presented in [7.4] In the image subtab area: - Current 2D image [10.7]: export the current image/slice in the 2D draw window [4.24]. - All 2D images [10.8]: all of the 2D images/slices will be exported. Each image/slice will be drawn and exported in order from the first to last file. - Current 1D image [10.11]: export the current image in the 1D draw window [5.7]. - Current DV images [10.9]: export the images in the data view draw window [8.19]. The images from each point will be drawn separately and exported. - Images in gray mode [10.10]: check this box to save all images in grayscale format. The default condition is checked. 19
20 20
![Figure 11: Configure more dialog In configure control panel area: - call/close configure more dialog [11.9]: call and close the dialog In configure more dialog area: - Signal filter configure[11.](/docs-images/85/92378020/images/21-0.jpg "1]: the data will be separated into certain levels according to the minimum and maximum values.")
21 Figure 11: Configure more dialog In configure control panel area: - call/close configure more dialog [11.9]: call and close the dialog In configure more dialog area: - Signal filter configure[11.1]: the data will be separated into certain levels according to the minimum and maximum values. When local contrast is set, the minimum and maximum will be chosen from the current image; otherwise, they will be chosen from all the images. - Error filter configure[11.2]: the value shown in the error filter slider label is the percentage. However the percentage value can be infinite big. The maximum I used is limited 300. If that s not enough, that change it. - time modifier [11.3]: allows for simple mathematical manipulation of the data listed in the time table [6.4]. There are currently four operation options, +, -, * and /. E.g. entering 13 and clicking the + button will add 13 to all of the time points. - T1 configure [11.4]: for a T1 inversion recovery experiment. UNIFIT will find the position of the smallest value in the data set and invert all of the data before this position. The user can change the default setting by entering a new position. - Bi-exp initial fitting configure: if desired, UNIFIT will separate the data and time sets into 2 parts for separate fitting (used only with biexponential fitting). The user can select the time position with the slider, or enter it s value in the textbox. The default position is the midpoint of the time list. - Axis style [11.6]: the style of the axis used for plotting the data. - 2D single pixel fitting configure [11.7]: If the button is checked, a green cross will be plotted to specify the pixel which is picked from the 2D draw window to fit. - Debug mode configure [11.8]: useful for the programmer to maintain or debug the program. If debug mode is turned off, the program will not be able to catch and handle the errors. 21
22 Figure 12: Equation dialog Notice: 1: To configure the 6 general equations we usually use: 1) T1 single exponential equation <-----> set both T1 and single exp 2) T1 double exponential equation <-----> set both T1 and double exp 3) T2 single exponential equation <-----> set both T2 and single exp 4) T2 double exponential equation <-----> set both T2 and double exp 4) Linear single exponential equation <---> set both Linear and single exp 6) Linear double exponential equation <---> set both Linear and double exp Note that the T2* option has been replaced with the linear option because T2 and T2* do the exact same thing. 2: If you like to add a constant to the equation, check the use constant button. The option won t work when user sets his own equation. 3: If you like to have you own equation, then set the my eq. At the same time, the option buttons for the general equations will be unchecked. To enter or modify your own equation, then click the set button, a dialog will pop up. 4: If you like to choose which params of the general equations to be fitted, you could lock or unlock the params by check the buttons before the params. In equation control panel area: - call/close filter dialog [12.5]: call or close the dialog. - initial value of the variable [12.6]: If general equation is chosen, UNIFIT could provide the initial values automatically. user could use the initial values to do the fitting. If user wants to use his own initial values, then check the use my initial params and enter his values to the proper params. AND user also can choose which params of the general equations to be fitted by check the buttons before the params to lock or unlock the params. In equation dialog area: - number of the variables [12.1]: as the params to be fitted running at the background are in array format, the number of the params should be specified to create the proper array. - Error [12.2]: errors used in the experiment to get the data. - Equation file location[12.4]: in default, the equation will be saved into the file and be compiled after equation is configured. The compiled file will be called by the program to do the fitting. 22
![- Equation [12.4]: the equation here should be written in IDL code format for the compile. Equation FORMAT: S = a * EXP (-x/t2) + c where a, T2 and c are unknown params.](/docs-images/85/92378020/images/23-0.jpg "To translate the equation, we need a 3-element array to contain the params: S = A[0] * EXP (-x/a[1]) + A[2] - Where A[0] for 1st param a, A[1] for 2 nd param T2 and A[3] for last one C.")
23 - Equation [12.4]: the equation here should be written in IDL code format for the compile. Equation FORMAT: S = a * EXP (-x/t2) + c where a, T2 and c are unknown params. To translate the equation, we need a 3-element array to contain the params: S = A[0] * EXP (-x/a[1]) + A[2] - Where A[0] for 1st param a, A[1] for 2 nd param T2 and A[3] for last one C. - Name of the variable to present [12.7]: bind to param name to the certain element in the array. The names will be presented for the comments - Variable in the routine [12.8]: the array in the running codes. - Initial value of the variable [12.6]: If user uses his own equation, UNIFIT won t provide the auto-calculated initial values to start the fitting. User himself should provide some values. 23
24 Figure 13: Filter dialog In 3D control panel area: - call/close filter dialog [13.8]: call / close the dialog. In filter dialog area: - Slice index [13.2]: show the number of the slices as index. - Signal filter setting on related slice [13.2]: the signal filter setting for each slices. - Error filter setting on related slice [13.3]: the error filter setting for each slices. - Apply filters setting of current slice button [13.4]: apply the current signal and error filter settings from the 2D control panel to the current selected slice in the dialog. - Apply filters setting of current slice to all slices button [13.1]: apply the current signal and error filter settings from the 2D control panel to all the slices in the dialog. - Load previous content to all lists button [13.6]: load the filter settings from a saved file. - Save content in all lists button [13.5]: save the filter settings to a file. 24

25 Figure 14: ROI dialog When doing a ROI fitting, a ROI dialog will pop up. After the ROI is selected properly, user can click the DONE button to apply the ROI. And the ROI dialog will disappear and the fitting begins. 25

26 Figure 15: Instant fitting Instant fitting can be used separately. Here is an example of the process steps: - Prepare the data: we get two data sets: Y = [2,4,6,8,10,12,14,16] X = [1,2,3,4,5,6,7,8] And we want to fit the equation: Y = A * X + B. 26
 The data in files can be separated by space or comma if stored in horizontal. - Load the data: Then we call UNIFIT.")
27 Then we save the two data sets into two txt files (can be csv format as well). Notice the format (see the 3 valid file formats area): 1) The data in files can be stored in vertical or horizontal. 2) The data in files can be separated by space or comma if stored in horizontal. - Load the data: Then we call UNIFIT. Click load instant fit data file to load the data file (or y file) ; click load instant fit time file to load the time file (or x file). The data loaded will be listed in [6.12] and [6.4]. - Choose equation / enter equation: 1) Use general equations: configure the 6 options buttons 2) Use user s own equation: choose my eq option and click [12.5] to set the equation. Details see description of Figure Fit: Click the instant fit button [7.2] - Result: result can be found in Result draw window [7.8] 27
IMPSTAR 2.1 User s Guide
 IMPSTAR 2.1 User s Guide Last Update July 2006 by Biao Wang Table of Contents Introduction.....3 Functionality Summary......3 Running IMPSTAR 4 The Interface of IMPSTAR... 4 The Main Window.. 4 The Histogram
Numbers Basics Website:
 Website: http://etc.usf.edu/te/ Numbers is Apple's new spreadsheet application. It is installed as part of the iwork suite, which also includes the word processing program Pages and the presentation program
FlowJo Software Lecture Outline:
 FlowJo Software Lecture Outline: Workspace Basics: 3 major components 1) The Ribbons (toolbar) The availability of buttons here can be customized. *One of the best assets of FlowJo is the help feature*
IDL Tutorial. Working with Images. Copyright 2008 ITT Visual Information Solutions All Rights Reserved
 IDL Tutorial Working with Images Copyright 2008 ITT Visual Information Solutions All Rights Reserved http://www.ittvis.com/ IDL is a registered trademark of ITT Visual Information Solutions for the computer
Synoptics Limited reserves the right to make changes without notice both to this publication and to the product that it describes.
 GeneTools Getting Started Although all possible care has been taken in the preparation of this publication, Synoptics Limited accepts no liability for any inaccuracies that may be found. Synoptics Limited
Adobe Premiere Pro CC 2015 Tutorial
 Adobe Premiere Pro CC 2015 Tutorial Film/Lit--Yee GETTING STARTED Adobe Premiere Pro CC is a video layout software that can be used to create videos as well as manipulate video and audio files. Whether
Modify Panel. Flatten Tab
 AFM Image Processing Most images will need some post acquisition processing. A typical procedure is to: i) modify the image by flattening, using a planefit, and possibly also a mask, ii) analyzing the
Working with Mailbox Manager
 Working with Mailbox Manager A user guide for Mailbox Manager supporting the Message Storage Server component of the Avaya S3400 Message Server Mailbox Manager Version 5.0 February 2003 Copyright 2003
OPENING A LEADS.TXT FILE IN EXCEL 2010
 From the project manager to a team of administrative, programming, and technical specialists, ATS believes in a team approach that brings together all of the necessary elements pre-conference and onsite
2010 by Microtek International, Inc. All rights reserved.
 2010 by Microtek International, Inc. All rights reserved. Microtek and DocWizard are trademarks of Microtek International, Inc. Windows is a registered trademark of Microsoft Corporation. All other products
Microsoft Excel 2007
 Microsoft Excel 2007 1 Excel is Microsoft s Spreadsheet program. Spreadsheets are often used as a method of displaying and manipulating groups of data in an effective manner. It was originally created
Exercise 2: Bike Frame Analysis
 Exercise 2: Bike Frame Analysis This exercise will analyze a new, innovative mountain bike frame design under structural loads. The objective is to determine the maximum stresses in the frame due to the
Exercise 2: Bike Frame Analysis
 Exercise 2: Bike Frame Analysis This exercise will analyze a new, innovative mountain bike frame design under structural loads. The objective is to determine the maximum stresses in the frame due to the
SUM - This says to add together cells F28 through F35. Notice that it will show your result is
 COUNTA - The COUNTA function will examine a set of cells and tell you how many cells are not empty. In this example, Excel analyzed 19 cells and found that only 18 were not empty. COUNTBLANK - The COUNTBLANK
Working with Charts Stratum.Viewer 6
 Working with Charts Stratum.Viewer 6 Getting Started Tasks Additional Information Access to Charts Introduction to Charts Overview of Chart Types Quick Start - Adding a Chart to a View Create a Chart with
Navigator Software User s Manual. User Manual. Navigator Software. Monarch Instrument Rev 0.98 May Page 1 of 17
 User Manual Navigator Software Monarch Instrument Rev 0.98 May 2006 Page 1 of 17 Contents 1. NAVIGATOR SOFTWARE 2. INSTALLATION 3. USING NAVIGATOR SOFTWARE 3.1 STARTING THE PROGRAM 3.2 SYSTEM SET UP 3.3
Using Attributes. Engineering Design Technology Sacramento City College. Using Attributes 1
 Engineering Design Technology Sacramento City College 1 Objectives Assign attributes to blocks. Edit attributes defined for existing blocks. Create a template file for the storage of block attribute data.
Work with Shapes. Concepts CHAPTER. Concepts, page 3-1 Procedures, page 3-5
 3 CHAPTER Revised: November 15, 2011 Concepts, page 3-1, page 3-5 Concepts The Shapes Tool is Versatile, page 3-2 Guidelines for Shapes, page 3-2 Visual Density Transparent, Translucent, or Opaque?, page
Performing a resequencing assembly
 BioNumerics Tutorial: Performing a resequencing assembly 1 Aim In this tutorial, we will discuss the different options to obtain statistics about the sequence read set data and assess the quality, and
Sending image(s) to report Click Send Snapshot on any screen in Dolphin3D and choose the Send to Report option
 to report Click Send Snapshot on any screen in Dolphin3D and choose the Send to Report option") Dolphin 3D Reports Sending image(s) to report Click Send Snapshot on any screen in Dolphin3D and choose the Send to Report option Creating a report step by step 1. Generate the desired images in Dolphin3D
Dolphin 3D Reports Sending image(s) to report Click Send Snapshot on any screen in Dolphin3D and choose the Send to Report option Creating a report step by step 1. Generate the desired images in Dolphin3D
Motic Images Plus 3.0 ML Software. Windows OS User Manual
 Motic Images Plus 3.0 ML Software Windows OS User Manual Motic Images Plus 3.0 ML Software Windows OS User Manual CONTENTS (Linked) Introduction 05 Menus and tools 05 File 06 New 06 Open 07 Save 07 Save
Chapter 4. Microsoft Excel
 Chapter 4 Microsoft Excel Topic Introduction Spreadsheet Basic Screen Layout Modifying a Worksheet Formatting Cells Formulas and Functions Sorting and Filling Borders and Shading Charts Introduction A
Introduction to version Instruction date
 Introduction to version 1.1.0 Instruction date 16.5.2008 Windows and Files Start by creating the window Open FCS data file By right-clicking the axis the list of available parameters appear. Right-click
XnView Image Viewer. a ZOOMERS guide
 XnView Image Viewer a ZOOMERS guide Introduction...2 Browser Mode... 5 Image View Mode...14 Printing... 22 Image Editing...26 Configuration... 34 Note that this guide is for XnView version 1.8. The current
Chapter 4: Single Table Form Lab
 Chapter 4: Single Table Form Lab Learning Objectives This chapter provides practice with creating forms for individual tables in Access 2003. After this chapter, you should have acquired the knowledge
STIPlotDigitizer. User s Manual
 STIPlotDigitizer User s Manual Table of Contents What is STIPlotDigitizer?... 3 Installation Guide... 3 Initializing STIPlotDigitizer... 4 Project GroupBox... 4 Import Image GroupBox... 5 Exit Button...
Impress Guide Chapter 11 Setting Up and Customizing Impress
 Impress Guide Chapter 11 Setting Up and Customizing Impress This PDF is designed to be read onscreen, two pages at a time. If you want to print a copy, your PDF viewer should have an option for printing
Multivariate Calibration Quick Guide
 Last Updated: 06.06.2007 Table Of Contents 1. HOW TO CREATE CALIBRATION MODELS...1 1.1. Introduction into Multivariate Calibration Modelling... 1 1.1.1. Preparing Data... 1 1.2. Step 1: Calibration Wizard
Release Notes ClearSQL (build 181)
") August 14, 2018 Release Notes ClearSQL 7.1.2 (build 181) NEW FEATURES NEW: Exclusion of code lines from Flowcharts. It is now possible to exclude lines of code from a Flowchart diagram by defining exclusion
August 14, 2018 Release Notes ClearSQL 7.1.2 (build 181) NEW FEATURES NEW: Exclusion of code lines from Flowcharts. It is now possible to exclude lines of code from a Flowchart diagram by defining exclusion
1. AUTO CORRECT. To auto correct a text in MS Word the text manipulation includes following step.
 1. AUTO CORRECT - To auto correct a text in MS Word the text manipulation includes following step. - STEP 1: Click on office button STEP 2:- Select the word option button in the list. STEP 3:- In the word
CSSCR Excel Intermediate 4/13/06 GH Page 1 of 23 INTERMEDIATE EXCEL
 CSSCR Excel Intermediate 4/13/06 GH Page 1 of 23 INTERMEDIATE EXCEL This document is for those who already know the basics of spreadsheets and have worked with either Excel for Windows or Excel for Macintosh.
Exhibitor Software User s Manual. Exhibitor Software V
 Exhibitor Software User s Manual Exhibitor Software V1.0.1 090908 1 Contents 1. Exhibitor Software 2. Installation 3. Using Exhibitor Program 3.1 Starting the Program 3.2 Logging in to the Program 3.3
LED STUDIO USER MANUAL
 BLAIR COMPANIES LED STUDIO USER MANUAL Part # 33-19-14 5107 Kissell Avenue Altoona PA 16601 814-949-8287 blaircompanies.com TABLE OF CONTENTS Chapter 1 Introduction... 1 Chapter 2 Install and Uninstall...
Microsoft Office Excel
 Microsoft Office 2007 - Excel Help Click on the Microsoft Office Excel Help button in the top right corner. Type the desired word in the search box and then press the Enter key. Choose the desired topic
ADOBE ILLUSTRATOR CS3
 ADOBE ILLUSTRATOR CS3 Chapter 2 Creating Text and Gradients Chapter 2 1 Creating type Create and Format Text Create text anywhere Select the Type Tool Click the artboard and start typing or click and drag
CREATING A NEW SURVEY IN
 CREATING A NEW SURVEY IN 1. Click to start a new survey 2. Type a name for the survey in the Survey field dialog box e.g., Quick 3. Enter a descriptive title for the survey in the Title field. - Quick
Keynote 08 Basics Website:
 Website: http://etc.usf.edu/te/ Keynote is Apple's presentation application. Keynote is installed as part of the iwork suite, which also includes the word processing program Pages and the spreadsheet program
Crop Counting and Metrics Tutorial
 Crop Counting and Metrics Tutorial The ENVI Crop Science platform contains remote sensing analytic tools for precision agriculture and agronomy. In this tutorial you will go through a typical workflow
How to use Excel Spreadsheets for Graphing
 How to use Excel Spreadsheets for Graphing 1. Click on the Excel Program on the Desktop 2. You will notice that a screen similar to the above screen comes up. A spreadsheet is divided into Columns (A,
CS Multimedia and Communications REMEMBER TO BRING YOUR MEMORY STICK TO EVERY LAB! Lab 02: Introduction to Photoshop Part 1
 CS 1033 Multimedia and Communications REMEMBER TO BRING YOUR MEMORY STICK TO EVERY LAB! Lab 02: Introduction to Photoshop Part 1 Upon completion of this lab, you should be able to: Open, create new, save
Adobe Illustrator CS Design Professional CREATING TEXT AND GRADIENTS
 Adobe Illustrator CS Design Professional CREATING TEXT AND GRADIENTS Chapter Lessons Create and format text Flow text into an object Position text on a path Create colors and gradients Apply colors and
SIVIC GUI Overview. SIVIC GUI Layout Overview
 SIVIC GUI Overview SIVIC GUI Layout Overview At the top of the SIVIC GUI is a row of buttons called the Toolbar. It is a quick interface for loading datasets, controlling how the mouse manipulates the
KCS Motion. Video Motion Analysis Software
 Video Motion Analysis Software Software and supporting material is property of G. Mason, Seattle University, 2007 Overview Overview KCS Motion tracks moving objects in a video clip and analyzes their position,
QlikView Plugin User Manual
 QlikView Plugin User Manual User Manual henrik.steen@endeavor.se [Date] 2014-08-13 2014-10-28 henrik.steen@endeavor.se 01 1 Table of Content 1 Introduction... 3 2 QlikView Accesspoint... 3 3 Interface...
BOXOFT Image to PDF s allow you scans paper documents and automatically s them as PDF attachments using your existing software
 Note: This product is distributed on a try-before-you-buy basis. All features described in this documentation are enabled. The registered version does not insert a watermark in your generated pdf documents.
KaleidaGraph Quick Start Guide
 KaleidaGraph Quick Start Guide This document is a hands-on guide that walks you through the use of KaleidaGraph. You will probably want to print this guide and then start your exploration of the product.
Table of Contents. Logos Imaging Application User s Manual Version Page 1
 Table of Contents About... 4 System Requirements... 5 Uninstall Previous Versions... 5 Install LIA 6.0... 6 Install the Device Drivers... 13 Register... 14 Getting Help... 14 Technical Support... 14 Workspace
Table Basics. The structure of an table
 TABLE -FRAMESET Table Basics A table is a grid of rows and columns that intersect to form cells. Two different types of cells exist: Table cell that contains data, is created with the A cell that
Microsoft Excel 2000 Charts
 You see graphs everywhere, in textbooks, in newspapers, magazines, and on television. The ability to create, read, and analyze graphs are essential parts of a student s education. Creating graphs by hand
Golden Software, Inc.
 Golden Software, Inc. Only $299! The most sophisticated graphing package available, providing the professional quality you need with the flexibility you want. Create one of the more than 30 different graph
GelQuant Express Analysis Software
 user guide GelQuant Express Analysis Software General information for using the Gel- Quant Express software for analysis of agarose gels Revision Date 1 August 2011 Publication Part Number MAN0004869 Contents
QlikView Full Browser User Manual. User Manual
 QlikView Full Browser User Manual User Manual Henrik Steen 8-13-2014 2014-08-13 2014-10-28 Henrik Steen 01 1 Table of Content 1 Introduction... 3 2 QlikView AccessPoint... 3 3 Interface... 3 3.1 Object...
Work with RSS Feeds. Procedures. Add an RSS Text Object CHAPTER. Procedures, page 7-1
 CHAPTER 7 Revised: November 15, 2011 s, page 7-1 s Add an RSS Text Object, page 7-1 Rename an RSS Text Object, page 7-2 Delete or Restore an RSS Text Object, page 7-4 Manipulate an RSS Text Object, page
FACULTY AND STAFF COMPUTER FOOTHILL-DE ANZA. Office Graphics
 FACULTY AND STAFF COMPUTER TRAINING @ FOOTHILL-DE ANZA Office 2001 Graphics Microsoft Clip Art Introduction Office 2001 wants to be the application that does everything, including Windows! When it comes
Adobe Illustrator CS5 Part 2: Vector Graphic Effects
 CALIFORNIA STATE UNIVERSITY, LOS ANGELES INFORMATION TECHNOLOGY SERVICES Adobe Illustrator CS5 Part 2: Vector Graphic Effects Summer 2011, Version 1.0 Table of Contents Introduction...2 Downloading the
EXCEL 2003 DISCLAIMER:
 EXCEL 2003 DISCLAIMER: This reference guide is meant for experienced Microsoft Excel users. It provides a list of quick tips and shortcuts for familiar features. This guide does NOT replace training or
Microsoft Office Publisher
 Microsoft Office 2007- Publisher Opening Microsoft Publisher Using the Start Menu, click on All Programs and navigate to the Microsoft Office folder. Click on Microsoft Office Publisher 2007. Choosing
MATERIALS PLUS Segmentation Measurement
 Example: Segmentation MATERIALS PLUS Segmentation is a method of image partitioning based on the intensity / gray scale range of its components. Since a phase is detected and its area is estimated on the
Password Memory 7 User s Guide
 C O D E : A E R O T E C H N O L O G I E S Password Memory 7 User s Guide 2007-2018 by code:aero technologies Phone: +1 (321) 285.7447 E-mail: info@codeaero.com Table of Contents How secure is Password
Advanced Special Effects
 Adobe Illustrator Advanced Special Effects AI exercise preview exercise overview The object is to create a poster with a unified color scheme by compositing artwork drawn in Illustrator with various effects
Week 5 Creating a Calendar. About Tables. Making a Calendar From a Table Template. Week 5 Word 2010
 Week 5 Creating a Calendar About Tables Tables are a good way to organize information. They can consist of only a few cells, or many cells that cover several pages. You can arrange boxes or cells vertically
BioFuel Graphing instructions using Microsoft Excel 2003 (Microsoft Excel 2007 instructions start on page mei-7)
") BioFuel Graphing instructions using Microsoft Excel 2003 (Microsoft Excel 2007 instructions start on page mei-7) Graph as a XY Scatter Chart, add titles for chart and axes, remove gridlines. A. Select
BioFuel Graphing instructions using Microsoft Excel 2003 (Microsoft Excel 2007 instructions start on page mei-7) Graph as a XY Scatter Chart, add titles for chart and axes, remove gridlines. A. Select
XnView 1.9. a ZOOMERS guide. Introduction...2 Browser Mode... 5 Image View Mode...15 Printing Image Editing...28 Configuration...
 XnView 1.9 a ZOOMERS guide Introduction...2 Browser Mode... 5 Image View Mode...15 Printing... 22 Image Editing...28 Configuration... 36 Written by Chorlton Workshop for hsbp Introduction This is a guide
Using IPACS Webserver:
 Using IPACS Webserver: Logging On: The IPACS Webserver can be accessed from any PC with internet connectivity. 1. Open Internet Explorer or your internet service provider. 2. Type the IPACS web address
DOING MORE WITH EXCEL: MICROSOFT OFFICE 2013
 DOING MORE WITH EXCEL: MICROSOFT OFFICE 2013 GETTING STARTED PAGE 02 Prerequisites What You Will Learn MORE TASKS IN MICROSOFT EXCEL PAGE 03 Cutting, Copying, and Pasting Data Basic Formulas Filling Data
Colony Counting User Manual A D I V I S I O N O F S Y N O P T I C S L T D
 ProtoCOL Colony Counting User Manual S Y N B I O S I S A D I V I S I O N O F S Y N O P T I C S L T D All possible care has been taken in the preparation of this publication, but Synoptics Limited accepts
DDX-R Quick Start Guide
 DDX-R Quick Start Guide Imaging Support 1-855-726-9995 www.scilvet.com Contents USING DDX-R... 2 Opening a Patient File... 2 Opening a New Patient File... 3 Screen Layout... 3 ACQUIRING IMAGES ON A PATIENT...
StickFont Editor v1.01 User Manual. Copyright 2012 NCPlot Software LLC
 StickFont Editor v1.01 User Manual Copyright 2012 NCPlot Software LLC StickFont Editor Manual Table of Contents Welcome... 1 Registering StickFont Editor... 3 Getting Started... 5 Getting Started...
User Guide. Web Intelligence Rich Client. Business Objects 4.1
 User Guide Web Intelligence Rich Client Business Objects 4.1 2 P a g e Web Intelligence 4.1 User Guide Web Intelligence 4.1 User Guide Contents Getting Started in Web Intelligence 4.1... 5 Log into EDDIE...
Digital Recorder End User Guide. Official UK distribution partner
 Digital Recorder End User Guide Official UK distribution partner 2 Installer Information Contents General Operation Mouse Operation Logging into the System Quick Menu PTZ Control 4 5 5 6 Playback Operation
OnCOR Silverlight Viewer Guide
 Getting Around There are many ways to move around the map! The simplest option is to use your mouse in the map area. If you hold the left button down, then click and drag, you can pan the map to a new
VarioAnalyze. User Manual. JENOPTIK Group.
 VarioAnalyze User Manual JENOPTIK Group. Dear User Dear User You should carefully read these instructions before you start operating the VarioAnalyze Software. Editorial deadline: October 2005 Document
Creative Effects with Illustrator
 ADOBE ILLUSTRATOR PREVIEW Creative Effects with Illustrator AI OVERVIEW The object is to create a poster with a unified color scheme by compositing artwork drawn in Illustrator with various effects and
Contents Part I: Background Information About This Handbook... 2 Excel Terminology Part II: Advanced Excel Tasks...
 Version 3 Updated November 29, 2007 Contents Contents... 3 Part I: Background Information... 1 About This Handbook... 2 Excel Terminology... 3 Part II:... 4 Advanced Excel Tasks... 4 Export Data from
v Importing Rasters SMS 11.2 Tutorial Requirements Raster Module Map Module Mesh Module Time minutes Prerequisites Overview Tutorial
 v. 11.2 SMS 11.2 Tutorial Objectives This tutorial teaches how to import a Raster, view elevations at individual points, change display options for multiple views of the data, show the 2D profile plots,
Chapter 2 Autodesk Asset Locator... 3
 Contents Chapter 2 Autodesk Asset Locator....................... 3 Supported Operating Systems....................... 3 Installing Autodesk Asset Locator..................... 4 Define a Search...............................
Excel Level 1
 Excel 2016 - Level 1 Tell Me Assistant The Tell Me Assistant, which is new to all Office 2016 applications, allows users to search words, or phrases, about what they want to do in Excel. The Tell Me Assistant
While editing a page, a menu bar will appear at the top with the following options:
 Page Editor ===> Page Editor How Can I Use the Page Editor? The Page Editor will be your primary way of editing your website. Page Editor Basics While editing a page, you will see that hovering your mouse
Impress Guide. Chapter 11 Setting Up and Customizing Impress
 Impress Guide Chapter 11 Setting Up and Customizing Impress Copyright This document is Copyright 2007 2013 by its contributors as listed below. You may distribute it and/or modify it under the terms of
A cell is highlighted when a thick black border appears around it. Use TAB to move to the next cell to the LEFT. Use SHIFT-TAB to move to the RIGHT.
 Instructional Center for Educational Technologies EXCEL 2010 BASICS Things to Know Before You Start The cursor in Excel looks like a plus sign. When you click in a cell, the column and row headings will
ezimagex2 User s Guide Version 1.0
 ezimagex2 User s Guide Version 1.0 Copyright and Trademark Information The products described in this document are copyrighted works of AVEN, Inc. 2015 AVEN, Inc. 4595 Platt Rd Ann Arbor, MI 48108 All
Objectives. Objectives. Plan Ahead. Starting Excel 3/9/2010. Excel Chapter 3. Microsoft Office 2007
 Objectives Microsoft Office 2007 Excel Chapter 3 What-If Analysis, Charting, and Working with Large Worksheets Rotate text in a cell Create a series of month names Copy, paste, insert, and delete cells
MetaMorph Standard Operation Protocol Basic Application
 MetaMorph Standard Operation Protocol Basic Application Contents Basic Navigation and Image Handling... 2 Opening Images... 2 Separating Multichannel Images... 2 Cropping an Image... 3 Changing an 8 bit
Guidelines for Legible and Readable Text, page 2-1 Visual Density Transparent, Translucent, or Opaque?, page 2-3
 CHAPTER 2 Revised: November 15, 2011 Concepts, page 2-1 s, page 2-4 Reference, page 2-25 Concepts Guidelines for Legible and Readable Text, page 2-1 Visual Density Transparent, Translucent, or Opaque?,
Customisation and production of Badges. Getting started with I-Color System Basic Light
 Customisation and production of Badges Getting started with I-Color System Basic Light Table of contents 1 Creating a Badge Model 1.1 Configuration of Badge Format 1.2 Designing your Badge Model 1.2.1
3.2 Circle Charts Line Charts Gantt Chart Inserting Gantt charts Adjusting the date section...
 / / / Page 0 Contents Installation, updates & troubleshooting... 1 1.1 System requirements... 2 1.2 Initial installation... 2 1.3 Installation of an update... 2 1.4 Troubleshooting... 2 empower charts...
The walkthrough is available at /
 The walkthrough is available at https://downloads.openmicroscopy.org/presentations/2018/gbi-sydney / Description We will demonstrate a number of features of the OMERO platform using an OMERO server based
Managing custom montage files Quick montages How custom montage files are applied Markers Adding markers...
 AnyWave Contents What is AnyWave?... 3 AnyWave home directories... 3 Opening a file in AnyWave... 4 Quick re-open a recent file... 4 Viewing the content of a file... 5 Choose what you want to view and
GCC vinyl cutter, cutting plotter for sign making
 Plotter Setup In "Plotter Setup," you can choose "Plotter List," "Environment," "Pen," and so on. [Plotter list] In this area, you can choose the machine type and set some basic information for your plotter
Excel. Dashboard Creation. Microsoft # KIRSCHNER ROAD KELOWNA, BC V1Y4N TOLL FREE:
 Microsoft Excel Dashboard Creation #280 1855 KIRSCHNER ROAD KELOWNA, BC V1Y4N7 250-861-8324 TOLL FREE: 1-877-954-8433 INFO@POWERCONCEPTS.CA WWW.POWERCONECPTS.CA Dashboard Creation Contents Process Overview...
Piping & Instrumentation Diagrams
 Page 1 Piping & Instrumentation Diagrams Preface Using This Guide What's New? Getting Started Entering the Workbench Setting up Working Units and Grid Placing Components Routing a Piping Line or I & C
Introducing Gupta Report Builder
 Business Reporting Chapter 1 Introducing Gupta Report Builder You can use Report Builder to design reports. This chapter describes: Our approach to building reports. Some of the reports you can build.
Open Office Calc (Spreadsheet) Tutorial
 Tutorial") Open Office Calc (Spreadsheet) Tutorial Table of Contents Introduction...3 What is a Spreadsheet?...3 Starting OpenOffice Calc...3 OpenOffice Calc (Spreadsheet) Basics...4 Creating a New Document...5 Entering
Open Office Calc (Spreadsheet) Tutorial Table of Contents Introduction...3 What is a Spreadsheet?...3 Starting OpenOffice Calc...3 OpenOffice Calc (Spreadsheet) Basics...4 Creating a New Document...5 Entering
WebStudio User Guide. OpenL Tablets BRMS Release 5.18
 WebStudio User Guide OpenL Tablets BRMS Release 5.18 Document number: TP_OpenL_WS_UG_3.2_LSh Revised: 07-12-2017 OpenL Tablets Documentation is licensed under a Creative Commons Attribution 3.0 United
The Figure module. Use Figure to manipulate, edit and plot figure and phase diagrams already calculated by FactSage.
 Table of contents Section 1 Section 2 Section 3 Section 4 Section 5 Section 6 Section 7 Section 8 Section 9 Section 10 Section 11 Section 12 Section 13 Section 14 The module Use to manipulate, edit and
Layout and display. STILOG IST, all rights reserved
 2 Table of Contents I. Main Window... 1 1. DEFINITION... 1 2. LIST OF WINDOW ELEMENTS... 1 Quick Access Bar... 1 Menu Bar... 1 Windows... 2 Status bar... 2 Pop-up menu... 4 II. Menu Bar... 5 1. DEFINITION...
OpenForms360 Validation User Guide Notable Solutions Inc.
 OpenForms360 Validation User Guide 2011 Notable Solutions Inc. 1 T A B L E O F C O N T EN T S Introduction...5 What is OpenForms360 Validation?... 5 Using OpenForms360 Validation... 5 Features at a glance...
Introduction In this document, users will Llearn how to utilize SysQue Systems Pipe, and how to draw Pipe into their projects.
 Systems Pipe Summary Learn to utilize Systems Pipe for Revit 206. Contents Introduction SysQue Systems Pipes SysQue Systems Pipes Menu Modeling Using Systems Pipe Introduction In this document, users will
Manual Version 5. STIHL Service Communication. STIHL SC
 STIHL Service Communication Manual Version 5 STIHL SC STIHL Service Communication www.stihl.com Contents 1 System requirements... 4 1.1 Hardware... 4 1.2 Operating system... 4 1.3 Additional software required...
Excel 2013 Intermediate
 Instructor s Excel 2013 Tutorial 2 - Charts Excel 2013 Intermediate 103-124 Unit 2 - Charts Quick Links Chart Concepts Page EX197 EX199 EX200 Selecting Source Data Pages EX198 EX234 EX237 Creating a Chart