Information Visualization. Jing Yang Spring Time Series Data Visualization
|
|
|
- Bernard Clinton Porter
- 5 years ago
- Views:
Transcription
1 Information Visualization Jing Yang Spring Time Series Data Visualization 2 1
2 Time Series Data Fundamental chronological component to the data set Random sample of 4000 graphics from 15 of world s newspapers and magazines from found that 75% of graphics published were time series Tufte From John Stasko s class slides 3 Datasets Each data case is likely an event of some kind One of the variables can be the date and time of the event Examples: sunspot activity, baseball games, medicines taken, cities visited, stock prices, newswires, network resource measures Partially From John Stasko s class slides 4 2
3 Discussion Visualize these datasets: Dataset 1: Time 1, sunshine intensity, temperature Time 2, sunshine intensity, temperature Time m, sunshine intensity, temperature Dataset 2: Day 1, 5 news articles about Clinton, 7 news articles about oil, and 2 news about Iraq Day 2, Day m, Dataset 3: Lisa was born in Worcester in 2002, she weighted 11 lbs at that time She went to Austin in 2004 for 1 week, she weighted 23 lbs at that time She moved to Charlotte in 2005, she weighted 28 lbs at that time She visited China in 2006 for one month, she weighted 30 lbs at that time You can make the datasets more complex 5 Time Series Visualization Approaches Small Multiples Time-Series Plot Static State Replacement (Animation) Nested Visualization (embed time-series plot into other display) Brushing and linking 6 3

4 Small Multiples Small multiples are sets of thumbnail sized graphics on a single page that represent aspects of a single phenomenon. They: Depict comparison, enhance dimensionality, motion, and are good for multivariate displays Invite comparison, contrasts, and show the scope of alternatives or range of options Must use the same measures and scale. Can represent motion through ghosting of multiple images Are particularly useful in computers because they often permit the actual overlay of images, and rapid cycling. Graphics and Web Design Based on Edward Tufte's Principles, Larry Gales, Univ. of Washington 7 Small Multiples Three air pollutants in six counties in southern California Los Angeles Times,


5 Shape Coding Beddow J.: Shape Coding of Multidimensional Data on a Mircocomputer Display, Visualization 90, 1990, pp Time Series Plot Inclinations of the planetary orbits as a function of time Part of a text of monastery schools, tenth century 10 5


6 Time Series Plot 11 Time Series Plot 12 6


7 Time Series Plot 13 Time Series Plot 14 7

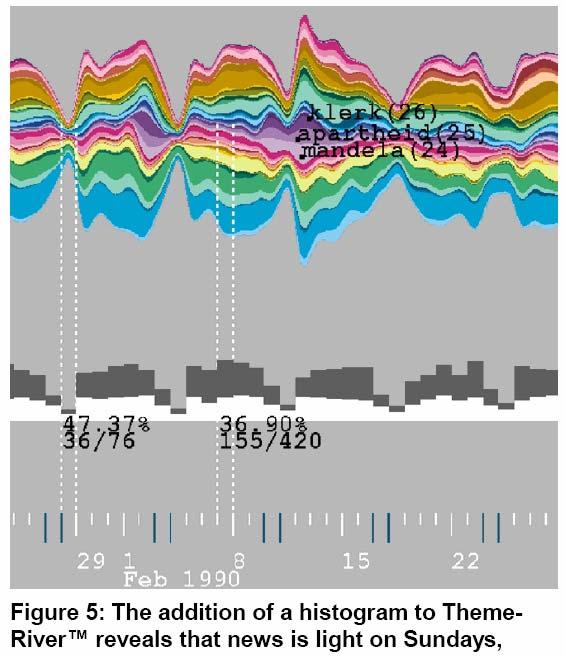
8 Paper: ThemeRiver: Visualizing Theme Changes Over Time [Havre et al. Infovis 00] Background: a user is less interested in document themselves than in theme changes within the whole collection over time ThemeRiver provides users with a macroview of thematic changes Example dataset used: 1990 Associated Press (AP) newswire data 15 A histogram depicting thematic changes 16 8

9 Problem The position of a particular theme within the bars may very considerably Users are required to integrating the themes across time Improvement :the river and currents metaphor -> ThemeRiver 17 ThemeRiver The river flows from left to right through time Colored currents flowing with the river narrow or widen to depict the strength of individual topics 18 9

10


11 21 Spiral Graphs History of Italian post office A. Gabaglio,

12 Paper: Visualizing Time-Series on Spirals [weber et al. Infovis 01] 23 Features Scale to large data sets Support identification of periodic structures in the data Compare multiple datasets Use Archimedes spiral: r = aө A ray emanating from the origin crosses two consecutive arcs of the spiral in a constant distance 2πa (equal distance between adjacent periods) 24 12


13 Periodic Pattern Identification Spectrum analysis Animation 25 Multiple Spirals 26 13


14 Scales & Legends 27 3D Overview and Selection 28 14


15 Pixel-Oriented Techniques Recursive pattern arrangements The figure is taken from Dr. D. Keim s tutorial notes in Infovis Pixel Oriented Techniques Recursive pattern arrangements The figure is taken from Dr. D. Keim s tutorial notes in Infovis
![Nested Visualization Embed time series plot into other displays Example: Time series plot embedded into a graph Visualization of Graphs with Associated Timeseries Data [Saraiya:05] 31 Static State](/docs-images/85/91859677/images/16-0.jpg "Replacement Treat time as a dimension hidden from the display Divide time into period (timeframe, or timepoint) Generate a visualization for each timeframe Replace a display of one timeframe using")
16 Nested Visualization Embed time series plot into other displays Example: Time series plot embedded into a graph Visualization of Graphs with Associated Timeseries Data [Saraiya:05] 31 Static State Replacement Treat time as a dimension hidden from the display Divide time into period (timeframe, or timepoint) Generate a visualization for each timeframe Replace a display of one timeframe using that of another timeframe Animations, trails 32 16

17 Static State Replacement Example: SPIRE Galaxies display Nowell et al. Infovis Motivation: Change Blindness Phenomenon people do not notice changes in visible elements of a scene Possible reasons: Overwriting Old scene is wholly replaced by the new one First impressions Accurately encode details of first scene and fail to encode the details of the changed scene Nothing is stored No need to develop any mental representation of the scene Nothing is compared Need to focus on changed items to recognition of changes Feature combination New scene and old scene are combined together 34 17


18 Change Blindness Galaxies slices depicting days 1-3 Nowell et al. Infovis Change Blindness Themeview slices depicting days 1-3 Nowell et al. Infovis

19 Paper: Change Blindness in Information Visualization: A Case Study [Nowell et al. Infovis01] Portraying document age in Galaxies Visualization Requirements: Relative age should be apparent Newest documents to be seen pre-attentively Other document ages to be intuitively ordered 37 Paper: Change Blindness in Information Visualization: A Case Study [Nowell et al. Infovis01] Check pre-attentive features: Spatial layout Size Shapes Angles Line length Color progression (such as yellow to green to blue) Bright to dim progression Perspective depth Left to right spatial progression 38 19


20 Perspective depth, line and length encoding 39 Line angle and length solution 40 20


21 Paper: Change Blindness in Information Visualization: A Case Study [Nowell et al. Infovis01] Candidate solutions for ThemeView Morphing What come before, what will eventually appear? Does not help users remember the changes Cross-fading Which part will get brighter, which part will fade away? Using a wireframe in combination with changes in color and translucency 41 Wireframe Solution Moving from one time slice to another with a wireframe and variable translucency


22 Theme Scan Solution ThemeScan visualization of changes between time slices 43 Brushing and Linking Link time series display with other displays Visualization of Graphs with Associated Timeseries Data [Saraiya:05] 44 22
 45")

23 Space and Time Napoleon s army in Russia, author: Charles Minard ( ) 45 Space and Time Life circle of Japanese Beetles L. Newman, Man and Insects,
![Paper: GeoTime Information Visualization [Kapler and Wright Infovis 04] A combined temporal-spatial space (X, Y, T coordinate space) Represent place](/docs-images/85/91859677/images/24-0.jpg "by 2D plane (or maybe 3D topography) Use 3rd dimension to encode time 47 Paper: GeoTime Information Visualization [Kapler and Wright Infovis 04] 48")
24 Paper: GeoTime Information Visualization [Kapler and Wright Infovis 04] A combined temporal-spatial space (X, Y, T coordinate space) Represent place by 2D plane (or maybe 3D topography) Use 3rd dimension to encode time 47 Paper: GeoTime Information Visualization [Kapler and Wright Infovis 04] 48 24


25 Timelines 3-D Z axis timelines 3-D viewer facing timelines 49 Example 50 25


26 Example 51 Information Model Entities People or things Locations Geospatial or conceptual Events Occurrences or discovered facts 52 26


27 Association Analysis Expanding search Connection search 53 Other Interactions Animation of entity movements Drilling down Annotations 54 27

28 Alternative View Afghanistan in 2002 Events in three weeks Shootings Bombings Fires Mines Kidnaps Thefts assaults 55 Paper: Time-Varying Data Visualization Using Information Flocking Boids [Moere Infovis04] Motivation: users are interested in how data values evolve in time, or in the context of the whole dataset, rather than exact data values Example: stock price A company performing significantly better than the day before A company performing significantly better than the day before 56 28
29 Flocking Boids Boids (bird-objects) within a flock Boids at the edge of a herb are easier to be selected Boids attempt to move as close to the center of the herd as possible Boids view the world from their own perspective rather than from a global one 57 Behavior Animation Each individual member contains its own set of rules and the future state of a member only depends on its neighbors Rules: Collision Avoidance Velocity Matching (move with about the same speed as neighbors) Data similarity (Stay close to boids experienced similar data value evolution during current timeframe) Data Dissimilarity (Stay away from boids experienced dissimilar data value evolution) Flock Centering (move toward the center as the boid perceives it) 58 29


30 Example 59 Shape 60 30
31 References E. Tufte. The Visual Display of Quantitative Information, 1983 Papers referred 61 Assignment Present a geo-spatial / time visualization paper in next class 62 31
Large Scale Information
 Large Scale Information Visualization Jing Yang Fall 2009 1 Relevant Information Course webpage: www.cs.uncc.edu/~jyang13 Schedule Grading policy Slides Assignments 2 1 Visualization Visualization - the
Information Visualization. Jing Yang Spring Multi-dimensional Visualization (1)
") Information Visualization Jing Yang Spring 2008 1 Multi-dimensional Visualization (1) 2 1 Multi-dimensional (Multivariate) Dataset 3 Data Item (Object, Record, Case) 4 2 Dimension (Variable, Attribute)
Information Visualization Jing Yang Spring 2008 1 Multi-dimensional Visualization (1) 2 1 Multi-dimensional (Multivariate) Dataset 3 Data Item (Object, Record, Case) 4 2 Dimension (Variable, Attribute)
Multiple Dimensional Visualization
 Multiple Dimensional Visualization Dimension 1 dimensional data Given price information of 200 or more houses, please find ways to visualization this dataset 2-Dimensional Dataset I also know the distances
Geometric Techniques. Part 1. Example: Scatter Plot. Basic Idea: Scatterplots. Basic Idea. House data: Price and Number of bedrooms
 Part 1 Geometric Techniques Scatterplots, Parallel Coordinates,... Geometric Techniques Basic Idea Visualization of Geometric Transformations and Projections of the Data Scatterplots [Cleveland 1993] Parallel
visualization of time-oriented data
 visualization of time-oriented data introduction Wolfgang Aigner aigner@ifs.tuwien.ac.at http://ieg.ifs.tuwien.ac.at/~aigner/ wolfgang.aigner@donau-uni.ac.at http://ike.donau-uni.ac.at/~aigner/ Version
3. Multidimensional Information Visualization II Concepts for visualizing univariate to hypervariate data
 3. Multidimensional Information Visualization II Concepts for visualizing univariate to hypervariate data Vorlesung Informationsvisualisierung Prof. Dr. Andreas Butz, WS 2009/10 Konzept und Basis für n:
Parallel Coordinates ++
 Parallel Coordinates ++ CS 4460/7450 - Information Visualization Feb. 2, 2010 John Stasko Last Time Viewed a number of techniques for portraying low-dimensional data (about 3
/5 Stacks. Displays the slice that follows the currently displayed slice. As a shortcut, press the > key.
 20-02-2018 1/5 Stacks Stacks This submenu contains commands that work with stacks. Add Slice Inserts a blank slice after the currently displayed slice. Hold down the Alt key to add the slice before the
Visual Perception. Basics
 Visual Perception Basics Please refer to Colin Ware s s Book Some materials are from Profs. Colin Ware, University of New Hampshire Klaus Mueller, SUNY Stony Brook Jürgen Döllner, University of Potsdam
3. Visual Analytics (Part 1: Visual Encoding) Jacobs University Visualization and Computer Graphics Lab
 Jacobs University Visualization and Computer Graphics Lab") 3. Visual Analytics (Part 1: Visual Encoding) 3.1 Introduction Motivation Big Data cannot be analyzed anymore without the help of computers. Computers are good in quickly processing large amounts of data.
3. Visual Analytics (Part 1: Visual Encoding) 3.1 Introduction Motivation Big Data cannot be analyzed anymore without the help of computers. Computers are good in quickly processing large amounts of data.
Information Visualization
 Information Visualization Text: Information visualization, Robert Spence, Addison-Wesley, 2001 What Visualization? Process of making a computer image or graph for giving an insight on data/information
Interactive Visual Exploration
 Interactive Visual Exploration of High Dimensional Datasets Jing Yang Spring 2010 1 Challenges of High Dimensional Datasets High dimensional datasets are common: digital libraries, bioinformatics, simulations,
We will start at 2:05 pm! Thanks for coming early!
 We will start at 2:05 pm! Thanks for coming early! Yesterday Fundamental 1. Value of visualization 2. Design principles 3. Graphical perception Record Information Support Analytical Reasoning Communicate
Interactive Inverted Perspective Rendering for Architectural Visualization
 Interactive Inverted Perspective Rendering for Architectural Visualization Vinod Srinivasan Ozan Ozener Ergun Akleman 2005 June 20th 22nd Vienna University of Technology Vienna, Austria Visualization Sciences
Maps as Numbers: Data Models
 Maps as Numbers: Data Models vertices E Reality S E S arcs S E Conceptual Models nodes E Logical Models S Start node E End node S Physical Models 1 The Task An accurate, registered, digital map that can
BCC Particle System Generator
 BCC Particle System Generator BCC Particle System is an auto-animated particle generator that provides in-depth control over individual particles as well as the overall shape and movement of the system.
Finally: Motion and tracking. Motion 4/20/2011. CS 376 Lecture 24 Motion 1. Video. Uses of motion. Motion parallax. Motion field
 Finally: Motion and tracking Tracking objects, video analysis, low level motion Motion Wed, April 20 Kristen Grauman UT-Austin Many slides adapted from S. Seitz, R. Szeliski, M. Pollefeys, and S. Lazebnik
Visual Computing. Lecture 2 Visualization, Data, and Process
 Visual Computing Lecture 2 Visualization, Data, and Process Pipeline 1 High Level Visualization Process 1. 2. 3. 4. 5. Data Modeling Data Selection Data to Visual Mappings Scene Parameter Settings (View
CS Information Visualization Sep. 19, 2016 John Stasko
 Multivariate Visual Representations 2 CS 7450 - Information Visualization Sep. 19, 2016 John Stasko Learning Objectives Explain the concept of dense pixel/small glyph visualization techniques Describe
Chapter 5. Creating Special Effects Delmar, Cengage Learning
 Chapter 5 Creating Special Effects 2011 Delmar, Cengage Learning Chapter 5 Lessons 1. Create a mask effect 2. Add sound 3. Add video 4. Create an animated navigation bar 5. Create character animations
Lecture 12: Video Representation, Summarisation, and Query
 Lecture 12: Video Representation, Summarisation, and Query Dr Jing Chen NICTA & CSE UNSW CS9519 Multimedia Systems S2 2006 jchen@cse.unsw.edu.au Last week Structure of video Frame Shot Scene Story Why
Spatial Data Structures
 CSCI 420 Computer Graphics Lecture 17 Spatial Data Structures Jernej Barbic University of Southern California Hierarchical Bounding Volumes Regular Grids Octrees BSP Trees [Angel Ch. 8] 1 Ray Tracing Acceleration
CP SC 8810 Data Visualization. Joshua Levine
 CP SC 8810 Data Visualization Joshua Levine levinej@clemson.edu Lecture 15 Text and Sets Oct. 14, 2014 Agenda Lab 02 Grades! Lab 03 due in 1 week Lab 2 Summary Preferences on x-axis label separation 10
TDWI strives to provide course books that are contentrich and that serve as useful reference documents after a class has ended.
 Previews of TDWI course books offer an opportunity to see the quality of our material and help you to select the courses that best fit your needs. The previews cannot be printed. TDWI strives to provide
University of Florida CISE department Gator Engineering. Visualization
 Visualization Dr. Sanjay Ranka Professor Computer and Information Science and Engineering University of Florida What is visualization? Visualization is the process of converting data (information) in to
CS Information Visualization March 4, 2004 John Stasko
 WWW and Internet CS 7450 - Information Visualization March 4, 2004 John Stasko Internet and WWW By nature, abstract, so good target for visualization Often described in terms of metaphors Information Superhighway
BCC Comet Generator Source XY Source Z Destination XY Destination Z Completion Time
 BCC Comet Generator Comet creates an auto-animated comet that streaks across the screen. The comet is compromised of particles whose sizes, shapes, and colors can be adjusted. You can also set the length
Visual Representation from Semiology of Graphics by J. Bertin
 Visual Representation from Semiology of Graphics by J. Bertin From a communication perspective Communication is too often taken for granted when it should be taken to pieces. (Fiske 91) Two basic schools
CS Information Visualization Sep. 2, 2015 John Stasko
 Multivariate Visual Representations 2 CS 7450 - Information Visualization Sep. 2, 2015 John Stasko Recap We examined a number of techniques for projecting >2 variables (modest number of dimensions) down
This research aims to present a new way of visualizing multi-dimensional data using generalized scatterplots by sensitivity coefficients to highlight
 This research aims to present a new way of visualizing multi-dimensional data using generalized scatterplots by sensitivity coefficients to highlight local variation of one variable with respect to another.
INTRODUCTION TO VISUALIZATION A OVERVIEW
 Cyberinfrastructure Technology Integration (CITI) Advanced Visualization Division INTRODUCTION TO VISUALIZATION A OVERVIEW Vetria L. Byrd, PhD REU Coordinator June 03, 2014 REU SITE Research Experience
Display. Introduction page 67 2D Images page 68. All Orientations page 69 Single Image page 70 3D Images page 71
 Display Introduction page 67 2D Images page 68 All Orientations page 69 Single Image page 70 3D Images page 71 Intersecting Sections page 71 Cube Sections page 72 Render page 73 1. Tissue Maps page 77
Stereo pairs from linear morphing
 Proc. of SPIE Vol. 3295, Stereoscopic Displays and Virtual Reality Systems V, ed. M T Bolas, S S Fisher, J O Merritt (Apr 1998) Copyright SPIE Stereo pairs from linear morphing David F. McAllister Multimedia
Design World. Graphical Integrity. largely from Edward Tufte, The Visual Display of Quantitative Information, Graphics Press, 1983.
 Design World Graphical Integrity largely from Edward Tufte, The Visual Display of Quantitative Information, Graphics Press, 1983. Graphical integrity Graphics can be a powerful communication tool Lies
CSE512 :: 4 Feb Animation. Jeffrey Heer University of Washington
 CSE512 :: 4 Feb 2014 Animation Jeffrey Heer University of Washington 1 Why use motion? Visual variable to encode data Direct attention Understand system dynamics Understand state transition Increase engagement
Visualisation of Abstract Information
 Visualisation of Abstract Information Visualisation Lecture 17 Institute for Perception, Action & Behaviour School of Informatics Abstract Information 1 Information Visualisation Previously data with inherent
Multimedia Database Systems. Retrieval by Content
 Multimedia Database Systems Retrieval by Content MIR Motivation Large volumes of data world-wide are not only based on text: Satellite images (oil spill), deep space images (NASA) Medical images (X-rays,
IAT 355 Visual Analytics. Animation 2. Lyn Bartram. Many of these slides were borrowed from M. Hearst and J. Heer
 IAT 355 Visual Analytics Animation 2 Lyn Bartram Many of these slides were borrowed from M. Hearst and J. Heer Today A Primer! Things to do when designing your visualization Project concerns Animation
cse 252c Fall 2004 Project Report: A Model of Perpendicular Texture for Determining Surface Geometry
 cse 252c Fall 2004 Project Report: A Model of Perpendicular Texture for Determining Surface Geometry Steven Scher December 2, 2004 Steven Scher SteveScher@alumni.princeton.edu Abstract Three-dimensional
Midterm Exam CS 184: Foundations of Computer Graphics page 1 of 11
 Midterm Exam CS 184: Foundations of Computer Graphics page 1 of 11 Student Name: Class Account Username: Instructions: Read them carefully! The exam begins at 2:40pm and ends at 4:00pm. You must turn your
Spatial Data Structures
 15-462 Computer Graphics I Lecture 17 Spatial Data Structures Hierarchical Bounding Volumes Regular Grids Octrees BSP Trees Constructive Solid Geometry (CSG) March 28, 2002 [Angel 8.9] Frank Pfenning Carnegie
Data and Image Models
 CSE 442 - Data Visualization Data and Image Models Jeffrey Heer University of Washington Last Week: Value of Visualization The Value of Visualization Record information Blueprints, photographs, seismographs,
Spatial Data Models. Raster uses individual cells in a matrix, or grid, format to represent real world entities
 Spatial Data Models Raster uses individual cells in a matrix, or grid, format to represent real world entities Vector uses coordinates to store the shape of spatial data objects David Tenenbaum GEOG 7
InfoVis: a semiotic perspective
 InfoVis: a semiotic perspective p based on Semiology of Graphics by J. Bertin Infovis is composed of Representation a mapping from raw data to a visible representation Presentation organizing this visible
TimeNotes: A Study on Effective Chart Visualization and Interaction Techniques for Time-Series Data. James Walker, Rita Borgo and Mark W.
 TimeNotes: A Study on Effective Chart Visualization and Interaction Techniques for Time-Series Data James Walker, Rita Borgo and Mark W. Jones 1 Outline Time-series Data Chronolens, Stack Zoom Domain Situation
Data Visualization. Fall 2017
 Data Visualization Fall 2017 Course Targets and Goals Getting acquainted with advanced techniques of visualization of scientific and technical data (spatial and non-spatial data) Application of selected
Particle Systems. Typical Time Step. Particle Generation. Controlling Groups of Objects: Particle Systems. Flocks and Schools
 Particle Systems Controlling Groups of Objects: Particle Systems Flocks and Schools A complex, fuzzy system represented by a large collection of individual elements. Each element has simple behavior and
Texture. Frequency Descriptors. Frequency Descriptors. Frequency Descriptors. Frequency Descriptors. Frequency Descriptors
 Texture The most fundamental question is: How can we measure texture, i.e., how can we quantitatively distinguish between different textures? Of course it is not enough to look at the intensity of individual
Depth. Common Classification Tasks. Example: AlexNet. Another Example: Inception. Another Example: Inception. Depth
 Common Classification Tasks Recognition of individual objects/faces Analyze object-specific features (e.g., key points) Train with images from different viewing angles Recognition of object classes Analyze
Week 4: Facet. Tamara Munzner Department of Computer Science University of British Columbia
 Week 4: Facet Tamara Munzner Department of Computer Science University of British Columbia JRNL 520M, Special Topics in Contemporary Journalism: Visualization for Journalists Week 4: 6 October 2015 http://www.cs.ubc.ca/~tmm/courses/journ15
Spatial Data Structures
 CSCI 480 Computer Graphics Lecture 7 Spatial Data Structures Hierarchical Bounding Volumes Regular Grids BSP Trees [Ch. 0.] March 8, 0 Jernej Barbic University of Southern California http://www-bcf.usc.edu/~jbarbic/cs480-s/
This lesson introduces Blender, covering the tools and concepts necessary to set up a minimal scene in virtual 3D space.
 3D Modeling with Blender: 01. Blender Basics Overview This lesson introduces Blender, covering the tools and concepts necessary to set up a minimal scene in virtual 3D space. Concepts Covered Blender s
Tecnologie per la ricostruzione di modelli 3D da immagini. Marco Callieri ISTI-CNR, Pisa, Italy
 Tecnologie per la ricostruzione di modelli 3D da immagini Marco Callieri ISTI-CNR, Pisa, Italy Who am I? Marco Callieri PhD in computer science Always had the like for 3D graphics... Researcher at the
Maps as Numbers: Data Models
 Maps as Numbers: Data Models vertices nodes tart node nd node arcs Reality Conceptual Models The Task An accurate, registered, digital map that can be queried and analyzed Translate: Real World Locations,
Integrating time-series visualizations within parallel coordinates for exploratory analysis of incident databases
 Integrating time-series visualizations within parallel coordinates for exploratory analysis of incident databases Michael Butkiewicz a, Thomas Butkiewicz b, William Ribarsky b, and Remco Chang b a University
CS 378: Computer Game Technology
 CS 378: Computer Game Technology Dynamic Path Planning, Flocking Spring 2012 University of Texas at Austin CS 378 Game Technology Don Fussell Dynamic Path Planning! What happens when the environment changes
Which is better? Sentential. Diagrammatic Indexed by location in a plane
 Jeanette Bautista Perceptual enhancement: text or diagrams? Why a Diagram is (Sometimes) Worth Ten Thousand Words Larkin, J. and Simon, H.A Structural object perception: 2D or 3D? Diagrams based on structural
Information Visualization. Overview. What is Information Visualization? SMD157 Human-Computer Interaction Fall 2003
 INSTITUTIONEN FÖR SYSTEMTEKNIK LULEÅ TEKNISKA UNIVERSITET Information Visualization SMD157 Human-Computer Interaction Fall 2003 Dec-1-03 SMD157, Information Visualization 1 L Overview What is information
Chapter 13. Creating Business Diagrams with SmartArt. Creating SmartArt Diagrams
 Chapter 13 Creating Business Diagrams with SmartArt Office 2007 adds support for 80 different types of business diagrams. These diagrams include list charts, process charts, cycle charts, hierarchy and
Spatial Data Structures
 15-462 Computer Graphics I Lecture 17 Spatial Data Structures Hierarchical Bounding Volumes Regular Grids Octrees BSP Trees Constructive Solid Geometry (CSG) April 1, 2003 [Angel 9.10] Frank Pfenning Carnegie
Projected Message Design Principles
 Projected Message Design Principles General Message Display Guidelines [G] G1. Screen display should follow the horizontal-vertical and left-right organization that is common to the culture of the intended
Perception Maneesh Agrawala CS : Visualization Fall 2013 Multidimensional Visualization
 Perception Maneesh Agrawala CS 294-10: Visualization Fall 2013 Multidimensional Visualization 1 Visual Encoding Variables Position Length Area Volume Value Texture Color Orientation Shape ~8 dimensions?
Computer Vision. Introduction
 Computer Vision Introduction Filippo Bergamasco (filippo.bergamasco@unive.it) http://www.dais.unive.it/~bergamasco DAIS, Ca Foscari University of Venice Academic year 2016/2017 About this course Official
: Easy 3D Calibration of laser triangulation systems. Fredrik Nilsson Product Manager, SICK, BU Vision
 : Easy 3D Calibration of laser triangulation systems Fredrik Nilsson Product Manager, SICK, BU Vision Using 3D for Machine Vision solutions : 3D imaging is becoming more important and well accepted for
VERY LARGE TELESCOPE 3D Visualization Tool Cookbook
 European Organisation for Astronomical Research in the Southern Hemisphere VERY LARGE TELESCOPE 3D Visualization Tool Cookbook VLT-SPE-ESO-19500-5652 Issue 1.0 10 July 2012 Prepared: Mark Westmoquette
ENHANCING THE CONTROL AND PERFORMANCE OF PARTICLE SYSTEMS THROUGH THE USE OF LOCAL ENVIRONMENTS. Abstract
 ENHANCING THE CONTROL AND PERFORMANCE OF PARTICLE SYSTEMS THROUGH THE USE OF LOCAL ENVIRONMENTS Daniel O. Kutz Richard R. Eckert State University of New York at Binghamton Binghamton, NY 13902 Abstract
Ray Tracing through Viewing Portals
 Ray Tracing through Viewing Portals Introduction Chris Young Igor Stolarsky April 23, 2008 This paper presents a method for ray tracing scenes containing viewing portals circular planes that act as windows
NUMB3RS Activity: Follow the Flock. Episode: In Plain Sight
 Teacher Page 1 NUMB3RS Activity: Follow the Flock Topic: Introduction to Flock Behavior Grade Level: 8-12 Objective: Use a mathematical model to simulate an aspect of birds flying in a flock Time: 30 minutes
Analysis of Image and Video Using Color, Texture and Shape Features for Object Identification
 IOSR Journal of Computer Engineering (IOSR-JCE) e-issn: 2278-0661,p-ISSN: 2278-8727, Volume 16, Issue 6, Ver. VI (Nov Dec. 2014), PP 29-33 Analysis of Image and Video Using Color, Texture and Shape Features
Tufte s Design Principles
 Tufte s Design Principles CS 7450 - Information Visualization January 27, 2004 John Stasko HW 2 - Minivan Data Vis What people did Classes of solutions Data aggregation, transformation Tasks - particular
Glyphs. Presentation Overview. What is a Glyph!? Cont. What is a Glyph!? Glyph Fundamentals. Goal of Paper. Presented by Bertrand Low
 Presentation Overview Glyphs Presented by Bertrand Low A Taxonomy of Glyph Placement Strategies for Multidimensional Data Visualization Matthew O. Ward, Information Visualization Journal, Palmgrave,, Volume
Multidimensional Interactive Visualization
 Multidimensional Interactive Visualization Cecilia R. Aragon I247 UC Berkeley Spring 2010 Acknowledgments Thanks to Marti Hearst, Tamara Munzner for the slides Spring 2010 I 247 2 Today Finish panning
Classification and Detection in Images. D.A. Forsyth
 Classification and Detection in Images D.A. Forsyth Classifying Images Motivating problems detecting explicit images classifying materials classifying scenes Strategy build appropriate image features train
Multimedia Technology CHAPTER 4. Video and Animation
 CHAPTER 4 Video and Animation - Both video and animation give us a sense of motion. They exploit some properties of human eye s ability of viewing pictures. - Motion video is the element of multimedia
Chapter 8 Visualization and Optimization
 Chapter 8 Visualization and Optimization Recommended reference books: [1] Edited by R. S. Gallagher: Computer Visualization, Graphics Techniques for Scientific and Engineering Analysis by CRC, 1994 [2]
Interactive Video Retrieval System Integrating Visual Search with Textual Search
 From: AAAI Technical Report SS-03-08. Compilation copyright 2003, AAAI (www.aaai.org). All rights reserved. Interactive Video Retrieval System Integrating Visual Search with Textual Search Shuichi Shiitani,
The Five Rooms Project
 The Five Rooms Project The Assignment If an artist is given the task of graphically designing a surface, then he is also left to decide which creative processes will be active and which criteria will then
Traffic/Flocking/Crowd AI. Gregory Miranda
 Traffic/Flocking/Crowd AI Gregory Miranda Introduction What is Flocking? Coordinated animal motion such as bird flocks and fish schools Initially described by Craig Reynolds Created boids in 1986, generic
Graphics for VEs. Ruth Aylett
 Graphics for VEs Ruth Aylett Overview VE Software Graphics for VEs The graphics pipeline Projections Lighting Shading Runtime VR systems Two major parts: initialisation and update loop. Initialisation
Clinical Importance. Aortic Stenosis. Aortic Regurgitation. Ultrasound vs. MRI. Carotid Artery Stenosis
 Clinical Importance Rapid cardiovascular flow quantitation using sliceselective Fourier velocity encoding with spiral readouts Valve disease affects 10% of patients with heart disease in the U.S. Most
Visualisation : Lecture 1. So what is visualisation? Visualisation
 So what is visualisation? UG4 / M.Sc. Course 2006 toby.breckon@ed.ac.uk Computer Vision Lab. Institute for Perception, Action & Behaviour Introducing 1 Application of interactive 3D computer graphics to
Exit: These control how the object exits the slide. For example, with the Fade animation the object will simply fade away.
 PowerPoint 2013 Animating Text and Objects Introduction In PowerPoint, you can animate text and objects such as clip art, shapes, and pictures. Animation or movement on the slide can be used to draw the
Scalable Object Classification using Range Images
 Scalable Object Classification using Range Images Eunyoung Kim and Gerard Medioni Institute for Robotics and Intelligent Systems University of Southern California 1 What is a Range Image? Depth measurement
Visualization? Information Visualization. Information Visualization? Ceci n est pas une visualization! So why two disciplines? So why two disciplines?
 Visualization? New Oxford Dictionary of English, 1999 Information Visualization Matt Cooper visualize - verb [with obj.] 1. form a mental image of; imagine: it is not easy to visualize the future. 2. make
NEURAL NETWORK VISUALIZATION
 Neural Network Visualization 465 NEURAL NETWORK VISUALIZATION Jakub Wejchert Gerald Tesauro IB M Research T.J. Watson Research Center Yorktown Heights NY 10598 ABSTRACT We have developed graphics to visualize
Computer Graphics and Visualization. What is computer graphics?
 CSCI 120 Computer Graphics and Visualization Shiaofen Fang Department of Computer and Information Science Indiana University Purdue University Indianapolis What is computer graphics? Computer graphics
Chapter 2: From Graphics to Visualization
 Exercises for Chapter 2: From Graphics to Visualization 1 EXERCISE 1 Consider the simple visualization example of plotting a graph of a two-variable scalar function z = f (x, y), which is discussed in
3D graphics, raster and colors CS312 Fall 2010
 Computer Graphics 3D graphics, raster and colors CS312 Fall 2010 Shift in CG Application Markets 1989-2000 2000 1989 3D Graphics Object description 3D graphics model Visualization 2D projection that simulates
8. Time-Based Data. Visualizing Change over time. Dr. Thorsten Büring, 13. Dezember 2007, Vorlesung Wintersemester 2007/08
 8. Time-Based Data Visualizing Change over time Dr. Thorsten Büring, 13. Dezember 2007, Vorlesung Wintersemester 2007/08 Slide 1 / 46 Outline Term clarification, user tasks & taxonomies Historic time-based
Available online at ScienceDirect. Energy Procedia 69 (2015 )
") Available online at www.sciencedirect.com ScienceDirect Energy Procedia 69 (2015 ) 1885 1894 International Conference on Concentrating Solar Power and Chemical Energy Systems, SolarPACES 2014 Heliostat
Available online at www.sciencedirect.com ScienceDirect Energy Procedia 69 (2015 ) 1885 1894 International Conference on Concentrating Solar Power and Chemical Energy Systems, SolarPACES 2014 Heliostat
BCC Rays Ripply Filter
 BCC Rays Ripply Filter The BCC Rays Ripply filter combines a light rays effect with a rippled light effect. The resulting light is generated from a selected channel in the source image and spreads from
Knowledge Discovery and Data Mining I
 Ludwig-Maximilians-Universität München Lehrstuhl für Datenbanksysteme und Data Mining Prof. Dr. Thomas Seidl Knowledge Discovery and Data Mining I Winter Semester 8/9 Agenda. Introduction. Basics. Data
Visualisation of Abstract Information
 Visualisation of Abstract Information Visualisation Lecture 17 Institute for Perception, Action & Behaviour School of Informatics Abstract Information 1 Information Visualisation Previously data with inherent
Understanding Tracking and StroMotion of Soccer Ball
 Understanding Tracking and StroMotion of Soccer Ball Nhat H. Nguyen Master Student 205 Witherspoon Hall Charlotte, NC 28223 704 656 2021 rich.uncc@gmail.com ABSTRACT Soccer requires rapid ball movements.
Digital Ink and Paint Week 5. Animation: Animated Symbols, Graphic Symbols vs Movie Clip Symbols, Bones, 3D Translation
 Digital Ink and Paint Week 5 Animation: Animated Symbols, Graphic Symbols vs Movie Clip Symbols, Bones, 3D Translation Graphic Symbols and Movie Clips have their own Time Line. You can create animation
Axes-Based Visualizations with Radial Layouts
 Axes-Based Visualizations with Radial Layouts Christian Tominski Institute for Computer Graphics University of Rostock Albert-Einstein-Straße 21 D-18055 Rostock +49 381 498 3418 ct@informatik.uni-rostock.de
Data Mining: Exploring Data. Lecture Notes for Chapter 3
 Data Mining: Exploring Data Lecture Notes for Chapter 3 1 What is data exploration? A preliminary exploration of the data to better understand its characteristics. Key motivations of data exploration include
Getting Started. What is SAS/SPECTRAVIEW Software? CHAPTER 1
 3 CHAPTER 1 Getting Started What is SAS/SPECTRAVIEW Software? 3 Using SAS/SPECTRAVIEW Software 5 Data Set Requirements 5 How the Software Displays Data 6 Spatial Data 6 Non-Spatial Data 7 Summary of Software
Texture Analysis. Selim Aksoy Department of Computer Engineering Bilkent University
 Texture Analysis Selim Aksoy Department of Computer Engineering Bilkent University saksoy@cs.bilkent.edu.tr Texture An important approach to image description is to quantify its texture content. Texture
3D Face and Hand Tracking for American Sign Language Recognition
 3D Face and Hand Tracking for American Sign Language Recognition NSF-ITR (2004-2008) D. Metaxas, A. Elgammal, V. Pavlovic (Rutgers Univ.) C. Neidle (Boston Univ.) C. Vogler (Gallaudet) The need for automated