Geometric Techniques. Part 1. Example: Scatter Plot. Basic Idea: Scatterplots. Basic Idea. House data: Price and Number of bedrooms
|
|
|
- Lizbeth O’Neal’
- 5 years ago
- Views:
Transcription
1 Part 1 Geometric Techniques Scatterplots, Parallel Coordinates,... Geometric Techniques Basic Idea Visualization of Geometric Transformations and Projections of the Data Scatterplots [Cleveland 1993] Parallel Coordinates [Inselberg 1985/1990] Prosection Views [Spence 95] Landscape [Wise, et al. 1995] ThemeRiver [Havre, et al 2000] Hyperslice [van Wijk, et al 1993] [Keim, 2001] Basic Idea: Scatterplots Visualizes a Relation (Correlation) between two Variables X and Y e.g., weight and height Individual Data Points are Represented in 2D where axes represent the variables X on the horizontal axis Y on the vertical axis in 3D in... Example: Scatter Plot House data: Price and Number of bedrooms User can identify global trends, local trade-offs and outliners. Number of Bedrooms K 100K 150K 200K 250K 300K Price ( )
2 Examples: Scatterplots (1/3) No relationship Strong linear (positive correlation) Examples: Scatterplots (2/3) Quadratic relationship Exponential relationship Exact linear (positive correlation) Strong linear (negative correlation) Sinusoidal relationship (damped) Outlier Examples: Scatterplots (3/3) Variation of Y doesn't depend on X (homoscedastic) Variation of Y does depend on X (heteroscedastic) Scatterplot - Conditioning Plot One limitation of the scatterplot matrix is that it cannot show interaction effects with another variable Purpose: Check pairwise relationship between two variables conditional on a third variable temp: torque versus time

![Cleveland, 1996] Example: Cars - Scatterplots Example 2 - Cars -](/docs-images/86/94325315/images/3-5.jpg "Scatterplot m x m scatterplots diagonal = same (m 2 - m) left -right the")
3 3 D Data in the Box 3 D Data Set of 50 Observations in the Box Scatterplot Matrix of all pairwise Scatterplots Example: Cars [Becker & Cleveland, 1996] Example: Cars - Scatterplots Example 2 - Cars - Scatterplot m x m scatterplots diagonal = same (m 2 - m) left -right the same (m 2 - m)/2


![variable Polygonal Line [Inselberg and Dimsdale, 1990] Every data item correspond to a](/docs-images/86/94325315/images/4-2.jpg "polygonal line Intersects each of the axes at the point Corresponds to the value for")
4 3 D Scatterplot plus Color Scatterplot & SDOF (1/2) Scatterplot & SDOF (2/2) Basic Idea: Parallel Coordinates Assigns one Vertical Axis to each Variable Evenly spaces these axes horizontally Traditional Cartesian Coordinates All axes are mutually perpendicular Layout: k Parallel Axes Axes to [min, max] Scaling individually for each variable Polygonal Line [Inselberg and Dimsdale, 1990] Every data item correspond to a polygonal line Intersects each of the axes at the point Corresponds to the value for the attribute
![Parallel Coordinates [Inselberg and Dimsdale, 1990]](/docs-images/86/94325315/images/5-3.jpg "Parallel Coordinates Parallel Coordinates Basic 6-dim.")

5 Parallel Coordinates [Inselberg and Dimsdale, 1990] Parallel Coordinates Parallel Coordinates Basic 6-dim. Point with cordinates (-5,3,4,-2,0,1) T Visualization of Correlation Discover the Correlation one line: point in PC one circle:


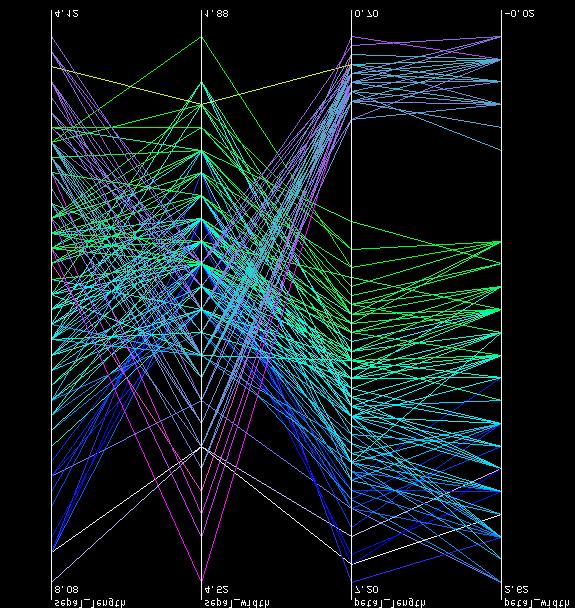
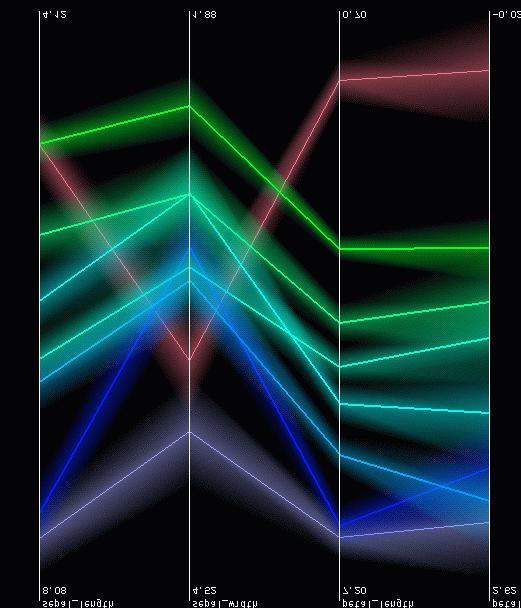


6 Problems with Parallel Cord. Color in Parallel Coordinates Polygons need to Much Space Hierach Parallele Coord. Example: Cars - Parallel Cord.

7 Parallel Coordinates Demo Programs: Parallel Coordinates Visualization Applet Benefits and Limitations Benefit Represent data greater than three dimensions Opportunities for human pattern recognition Flexibility: each coordinate can be individually scaled Zooming in or out: effectively brushing out or eliminating portions of the data set Limitations As the number of dimensions increases, the axes come closer to each other, making it more difficult to perceive patterns Prosection Views Similar to Scatterplots m-dim Data Sets Operators Projections Selections Color Coding customer s requirements (different limits) yes: red or green no: black, dark gray, light gray, and white [Spence, et al. 1995] The Prosection Matrix Design of a chair seat A design is represented by a point in Area-Thickness space Various performance limits restrict the range of possible designs Area Thickness Area too flexible too large too heavy too uncomfortable [ 2001 Robert Spence] Thickness
![The Prosection Matrix [ 2001 Robert Spence] The Prosection Matrix [ 2001 Robert Spence] Problem: we don t know where the green area is located Area Moreover, there are typically many parameters (not](/docs-images/86/94325315/images/8-0.jpg "2) and many performance limits (not 2) Thickness Solution? Either iterative search (human, automated or mixed) or generation of data to visualise.")
8 The Prosection Matrix [ 2001 Robert Spence] The Prosection Matrix [ 2001 Robert Spence] Problem: we don t know where the green area is located Area Moreover, there are typically many parameters (not 2) and many performance limits (not 2) Thickness Solution? Either iterative search (human, automated or mixed) or generation of data to visualise. Color Coding Parameter limits vs Performance limits Upper Limit S2 Par 2 Tolerance Region Satisfied all limits The Prosection Matrix A Prosection: Projection of a section [ 2001 Robert Spence] Lower Limit S2 Fail one performance limits, but manufactured Fail one or more performance limits, but manufactured Upper Limit S1 Fail one or more performance limits, not manufactured Lower Limit S1 Par 1 Satisfied all the performance limits, but outside one parameter limit = not manufactured
![The Prosection Matrix The Prosection Matrix [ 2001 Robert Spence] [ 2001 Robert Spence] Prosection Matrix for the lamp design Parameters Model Performances Raw Data User A difficult cognitive problem](/docs-images/86/94325315/images/9-0.jpg "is eased by a simple perceptual task Customer s Performance Requirements Selection Encoding Presentation Interaction Visualization tool designer Tolerances on parameter values The visualization tool")

9 The Prosection Matrix The Prosection Matrix [ 2001 Robert Spence] [ 2001 Robert Spence] Prosection Matrix for the lamp design Parameters Model Performances Raw Data User A difficult cognitive problem is eased by a simple perceptual task Customer s Performance Requirements Selection Encoding Presentation Interaction Visualization tool designer Tolerances on parameter values The visualization tool (e.g., Influence Explorer) designer must take into account the need of the user to specify the model, the exploratory range of parameter values and the customer s performance specifications, as well as the selection, encoding and presentation of data. Landscape [Wise, et al. 1995] Data needs to be transformed into a (possible artificial) 2D spatial representation which preserves the characteristics of the data ThemeRiver: Visualizing Theme Changes over Time Susan Havre, Beth Hetzler, and Lucy Nowell Battelle Pacific Northwest Division, Washington, USA Applications I: Document Visualization


10 Excursus IEEE Symposium on Information Visualization - InfoVis 2000 InfoVis 2000: Facts'n'Figures October 9-10, 2000 Salt Lake City, Utah, USA Annual Conference/Symposium 6th Parent Conference IEEE Visualization th Proceedings: CD Rom IEEE Computer Society, Los Alamitos, CA IEEE Visualization 2000 Annual Conference 11th
11 Types of Papers at InfoVis Session Topics Keynote Address Jock D. Mackinlay, University of Aarhus, Denmark Presentation, Visualization, What's Next Coining the term InfoVis Visual Data Mining Readings in InfoVis 20 Papers - 5 Sessions 6 Papers - Late Breaking Hot Topics Capstone Address Nahum Gershon, MITRE Visual Storytelling - Where Technology and Culture Meet Visual Querying and Data Exploration Graphs and Hierarchies Taxonomies, Frameworks, and Methodology Applications I: Document Visualization, Collaborative Visualization, Techniques Applications II: Algorithm Visualization, 3D Navigation ThemeRiver: Idea Visualizing Theme Changes over Time Susan Havre, Beth Hetzler, and Lucy Nowell Battelle Pacific Northwest Division, Washington, USA Applications I: Document Visualization A Large Collection of Documents Themes Changes River Metaphor - helps users to identify time-related patterns, trends, and relationships across a large collection of documents A Prototype System


12 ThemeRiver TM Histograms Data set: collection of speeches, interviews, articles, and other text associated with Fidel Castro Data set: collection of speeches, interviews, articles, and other text associated with Fidel Castro User Interactions Display Topic and Event Labels Display Time and Event Grid Lines Display the Raw Data Points Choose Among Drawing algorithms for the Currents and River Pan and Zoom Other Time Periods or Parts of the River More Detail or Broader Context Usability Evaluation 2 Users & Questions: Do users understand the metaphor? Can they identify themes that are more often discussed? Does the visualization help them raise new questions about the data? Do they interpret details of the visualization in ways we had not expected? How does their interpretation of the visualization differ from that of a histogram showing the same data?
 Total Number of Documents Features to Access the Documents User-Defined Ordering Reorder the")
 newswire data from the TREC5 distribution disks, a set of over 100,000 documents Data set: compare 1990 Associated")
13 Evaluation Results ThemeRiver Easy to Understand Useful + / - + River Metaphor + Abstraction to the Whole Collection + Identifying Macro Trends - Identifying Minor Trends Improvements Features of the Histogram Seeing Numeric Values (on demand) Total Number of Documents Features to Access the Documents User-Defined Ordering Reorder the Theme Currents Ordering by Correlation Parallel Rivers Impr.: Features of the Histogram Impr.: Parallel Rivers Data set: 1990 Associated Press (AP) newswire data from the TREC5 distribution disks, a set of over 100,000 documents Data set: compare 1990 Associated Press (AP) AP with data from Washington, D.C. and New York from the same time period

![Conclusion River Metaphors Perception Principles [Ware 2000] Improvements Needed Event Time Line -](/docs-images/86/94325315/images/14-1.jpg "Automatically Selecting and Ordering of Theme Currents More Information/Data on Demand Hyperslices (m 2 -")
14 Color Family Tracking related themes is simplified by assigning them to the same color family. This ensures related themes appear together and are identifiable as a group. Conclusion River Metaphors Perception Principles [Ware 2000] Improvements Needed Event Time Line - Automatically Selecting and Ordering of Theme Currents More Information/Data on Demand Hyperslices (m 2 - m)/2 2D slices Operator Selection [ van Wiik, et al 1993]
3. Multidimensional Information Visualization I Concepts for visualizing univariate to hypervariate data
 3. Multidimensional Information Visualization I Concepts for visualizing univariate to hypervariate data Vorlesung Informationsvisualisierung Prof. Dr. Andreas Butz, WS 2011/12 Konzept und Basis für n:
Information Visualisation
 Information Visualisation Computer Animation and Visualisation Lecture 18 Taku Komura tkomura@ed.ac.uk Institute for Perception, Action & Behaviour School of Informatics 1 Overview Information Visualisation
Information Visualization
 Information Visualization Text: Information visualization, Robert Spence, Addison-Wesley, 2001 What Visualization? Process of making a computer image or graph for giving an insight on data/information
Large Scale Information
 Large Scale Information Visualization Jing Yang Fall 2009 1 Relevant Information Course webpage: www.cs.uncc.edu/~jyang13 Schedule Grading policy Slides Assignments 2 1 Visualization Visualization - the
Multiple Dimensional Visualization
 Multiple Dimensional Visualization Dimension 1 dimensional data Given price information of 200 or more houses, please find ways to visualization this dataset 2-Dimensional Dataset I also know the distances
Multidimensional Interactive Visualization
 Multidimensional Interactive Visualization Cecilia R. Aragon I247 UC Berkeley Spring 2010 Acknowledgments Thanks to Marti Hearst, Tamara Munzner for the slides Spring 2010 I 247 2 Today Finish panning
Information Visualization. Jing Yang Spring Multi-dimensional Visualization (1)
") Information Visualization Jing Yang Spring 2008 1 Multi-dimensional Visualization (1) 2 1 Multi-dimensional (Multivariate) Dataset 3 Data Item (Object, Record, Case) 4 2 Dimension (Variable, Attribute)
Information Visualization Jing Yang Spring 2008 1 Multi-dimensional Visualization (1) 2 1 Multi-dimensional (Multivariate) Dataset 3 Data Item (Object, Record, Case) 4 2 Dimension (Variable, Attribute)
Courtesy of Prof. Shixia University
 Courtesy of Prof. Shixia Liu @Tsinghua University Outline Introduction Classification of Techniques Table Scatter Plot Matrices Projections Parallel Coordinates Summary Motivation Real world data contain
TNM093 Tillämpad visualisering och virtuell verklighet. Jimmy Johansson C-Research, Linköping University
 TNM093 Tillämpad visualisering och virtuell verklighet Jimmy Johansson C-Research, Linköping University Introduction to Visualization New Oxford Dictionary of English, 1999 visualize - verb [with obj.]
Data Sets. of Large. Visual Exploration. Daniel A. Keim
 Visual Exploration of Large Data Sets Computer systems today store vast amounts of data. Researchers, including those working on the How Much Information? project at the University of California, Berkeley,
Visual Encoding Design
 CSE 442 - Data Visualization Visual Encoding Design Jeffrey Heer University of Washington Review: Expressiveness & Effectiveness / APT Choosing Visual Encodings Assume k visual encodings and n data attributes.
Interactive Visualization of the Stock Market Graph
 Interactive Visualization of the Stock Market Graph Presented by Camilo Rostoker rostokec@cs.ubc.ca Department of Computer Science University of British Columbia Overview 1. Introduction 2. The Market
Visual Computing. Lecture 2 Visualization, Data, and Process
 Visual Computing Lecture 2 Visualization, Data, and Process Pipeline 1 High Level Visualization Process 1. 2. 3. 4. 5. Data Modeling Data Selection Data to Visual Mappings Scene Parameter Settings (View
Statistical graphics in analysis Multivariable data in PCP & scatter plot matrix. Paula Ahonen-Rainio Maa Visual Analysis in GIS
 Statistical graphics in analysis Multivariable data in PCP & scatter plot matrix Paula Ahonen-Rainio Maa-123.3530 Visual Analysis in GIS 11.11.2015 Topics today YOUR REPORTS OF A-2 Thematic maps with charts
Mathematics 9 Exploration Lab Scatter Plots and Lines of Best Fit. a line used to fit into data in order to make a prediction about the data.
 Mathematics 9 Exploration Lab Scatter Plots and Lines of Best Fit A. Definitions Line of Best Fit: a line used to fit into data in order to make a prediction about the data. Scatter Plot: a graph of unconnected
SAS Visual Analytics 8.2: Working with Report Content
 SAS Visual Analytics 8.2: Working with Report Content About Objects After selecting your data source and data items, add one or more objects to display the results. SAS Visual Analytics provides objects
Perception Maneesh Agrawala CS : Visualization Fall 2013 Multidimensional Visualization
 Perception Maneesh Agrawala CS 294-10: Visualization Fall 2013 Multidimensional Visualization 1 Visual Encoding Variables Position Length Area Volume Value Texture Color Orientation Shape ~8 dimensions?
Glyphs. Presentation Overview. What is a Glyph!? Cont. What is a Glyph!? Glyph Fundamentals. Goal of Paper. Presented by Bertrand Low
 Presentation Overview Glyphs Presented by Bertrand Low A Taxonomy of Glyph Placement Strategies for Multidimensional Data Visualization Matthew O. Ward, Information Visualization Journal, Palmgrave,, Volume
Parallel Coordinates ++
 Parallel Coordinates ++ CS 4460/7450 - Information Visualization Feb. 2, 2010 John Stasko Last Time Viewed a number of techniques for portraying low-dimensional data (about 3
Rational Numbers: Graphing: The Coordinate Plane
 Rational Numbers: Graphing: The Coordinate Plane A special kind of plane used in mathematics is the coordinate plane, sometimes called the Cartesian plane after its inventor, René Descartes. It is one
Introduc)on to Informa)on Visualiza)on
on to Informa)on Visualiza)on") Introduc)on to Informa)on Visualiza)on Seeing the Science with Visualiza)on Raw Data 01001101011001 11001010010101 00101010100110 11101101011011 00110010111010 Visualiza(on Applica(on Visualiza)on on
Introduc)on to Informa)on Visualiza)on Seeing the Science with Visualiza)on Raw Data 01001101011001 11001010010101 00101010100110 11101101011011 00110010111010 Visualiza(on Applica(on Visualiza)on on
Information Visualization - Introduction
 Information Visualization - Introduction Institute of Computer Graphics and Algorithms Information Visualization The use of computer-supported, interactive, visual representations of abstract data to amplify
Grundlagen methodischen Arbeitens Informationsvisualisierung [WS ] Monika Lanzenberger
![Grundlagen methodischen Arbeitens Informationsvisualisierung [WS ] Monika Lanzenberger](/thumbs/96/126572662.jpg "Grundlagen methodischen Arbeitens Informationsvisualisierung [WS ] Monika Lanzenberger") Grundlagen methodischen Arbeitens Informationsvisualisierung [WS0708 01 ] Monika Lanzenberger lanzenberger@ifs.tuwien.ac.at 17. 10. 2007 Current InfoVis Research Activities: AlViz 2 [Lanzenberger et al.,
Grundlagen methodischen Arbeitens Informationsvisualisierung [WS0708 01 ] Monika Lanzenberger lanzenberger@ifs.tuwien.ac.at 17. 10. 2007 Current InfoVis Research Activities: AlViz 2 [Lanzenberger et al.,
CP SC 8810 Data Visualization. Joshua Levine
 CP SC 8810 Data Visualization Joshua Levine levinej@clemson.edu Lecture 15 Text and Sets Oct. 14, 2014 Agenda Lab 02 Grades! Lab 03 due in 1 week Lab 2 Summary Preferences on x-axis label separation 10
Middle School Math Course 3
 Middle School Math Course 3 Correlation of the ALEKS course Middle School Math Course 3 to the Texas Essential Knowledge and Skills (TEKS) for Mathematics Grade 8 (2012) (1) Mathematical process standards.
YEAR 12 Core 1 & 2 Maths Curriculum (A Level Year 1)
") YEAR 12 Core 1 & 2 Maths Curriculum (A Level Year 1) Algebra and Functions Quadratic Functions Equations & Inequalities Binomial Expansion Sketching Curves Coordinate Geometry Radian Measures Sine and
YEAR 12 Core 1 & 2 Maths Curriculum (A Level Year 1) Algebra and Functions Quadratic Functions Equations & Inequalities Binomial Expansion Sketching Curves Coordinate Geometry Radian Measures Sine and
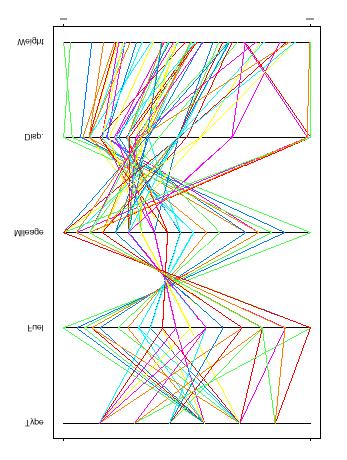
Vizcraft: A Multidimensional Visualization Tool for Aircraft Configuration Design
 Vizcraft: A Multidimensional Visualization Tool for Aircraft Configuration Design A. Goel*, C. Baked, C.A. Shaffer*, B. Grossmant, R.T. Haftkaf, W.H. Masont, L.T. Watson*t *Department of Computer Science,
Information Visualization. Jing Yang Spring Time Series Data Visualization
 Information Visualization Jing Yang Spring 2007 1 Time Series Data Visualization 2 1 Time Series Data Fundamental chronological component to the data set Random sample of 4000 graphics from 15 of world
Multivariate Data & Tables and Graphs. Agenda. Data and its characteristics Tables and graphs Design principles
 Multivariate Data & Tables and Graphs CS 7450 - Information Visualization Aug. 24, 2015 John Stasko Agenda Data and its characteristics Tables and graphs Design principles Fall 2015 CS 7450 2 1 Data Data
Exploratory Data Analysis EDA
 Exploratory Data Analysis EDA Luc Anselin http://spatial.uchicago.edu 1 from EDA to ESDA dynamic graphics primer on multivariate EDA interpretation and limitations 2 From EDA to ESDA 3 Exploratory Data
Multivariate Data & Tables and Graphs. Agenda. Data and its characteristics Tables and graphs Design principles
 Topic Notes Multivariate Data & Tables and Graphs CS 7450 - Information Visualization Aug. 27, 2012 John Stasko Agenda Data and its characteristics Tables and graphs Design principles Fall 2012 CS 7450
hvpcp.apr user s guide: set up and tour
 : set up and tour by Rob Edsall HVPCP (HealthVis-ParallelCoordinatePlot) is a visualization environment that serves as a follow-up to HealthVis (produced by Dan Haug and Alan MacEachren at Penn State)
Integrated Mathematics I Performance Level Descriptors
 Limited A student performing at the Limited Level demonstrates a minimal command of Ohio s Learning Standards for Integrated Mathematics I. A student at this level has an emerging ability to demonstrate
Linear Topics Notes and Homework DUE ON EXAM DAY. Name: Class period:
 Linear Topics Notes and Homework DUE ON EXAM DAY Name: Class period: Absolute Value Axis b Coordinate points Continuous graph Constant Correlation Dependent Variable Direct Variation Discrete graph Domain
Multi-Dimensional Vis
 CSE512 :: 21 Jan 2014 Multi-Dimensional Vis Jeffrey Heer University of Washington 1 Last Time: Exploratory Data Analysis 2 Exposure, the effective laying open of the data to display the unanticipated,
INTERACTION IN VISUALIZATION. Petra Isenberg
 INTERACTION IN VISUALIZATION Petra Isenberg RECAP Interaction is fundamental to the definition of visual exploration You have already seen examples for graphs for time series for multi-dimensional data
CS Information Visualization Sep. 2, 2015 John Stasko
 Multivariate Visual Representations 2 CS 7450 - Information Visualization Sep. 2, 2015 John Stasko Recap We examined a number of techniques for projecting >2 variables (modest number of dimensions) down
Big Mathematical Ideas and Understandings
 Big Mathematical Ideas and Understandings A Big Idea is a statement of an idea that is central to the learning of mathematics, one that links numerous mathematical understandings into a coherent whole.
CIS 467/602-01: Data Visualization
 CIS 467/602-01: Data Visualization Tables Dr. David Koop Assignment 2 http://www.cis.umassd.edu/ ~dkoop/cis467/assignment2.html Plagiarism on Assignment 1 Any questions? 2 Recap (Interaction) Important
 Specific Objectives Students will understand that that the family of equation corresponds with the shape of the graph. Students will be able to create a graph of an equation by plotting points. In lesson
Independence Diagrams: A Technique for Visual Data Mining
 Independence Diagrams: A Technique for Visual Data Mining Stefan Berchtold AT&T Laboratories H. V. Jagadish AT&T Laboratories Kenneth A. Ross Columbia University Abstract An important issue in data mining
ezimagex2 User s Guide Version 1.0
 ezimagex2 User s Guide Version 1.0 Copyright and Trademark Information The products described in this document are copyrighted works of AVEN, Inc. 2015 AVEN, Inc. 4595 Platt Rd Ann Arbor, MI 48108 All
Projected Message Design Principles
 Projected Message Design Principles General Message Display Guidelines [G] G1. Screen display should follow the horizontal-vertical and left-right organization that is common to the culture of the intended
Chapter 4 - Image. Digital Libraries and Content Management
 Prof. Dr.-Ing. Stefan Deßloch AG Heterogene Informationssysteme Geb. 36, Raum 329 Tel. 0631/205 3275 dessloch@informatik.uni-kl.de Chapter 4 - Image Vector Graphics Raw data: set (!) of lines and polygons
Interaction. CS Information Visualization. Chris Plaue Some Content from John Stasko s CS7450 Spring 2006
 Interaction CS 7450 - Information Visualization Chris Plaue Some Content from John Stasko s CS7450 Spring 2006 Hello. What is this?! Hand back HW! InfoVis Music Video! Interaction Lecture remindme.mov
Visualising File-Systems Using ENCCON Model
 Visualising File-Systems Using ENCCON Model Quang V. Nguyen and Mao L. Huang Faculty of Information Technology University of Technology, Sydney, Australia quvnguye@it.uts.edu.au, maolin@it.uts.edu.au Abstract
This research aims to present a new way of visualizing multi-dimensional data using generalized scatterplots by sensitivity coefficients to highlight
 This research aims to present a new way of visualizing multi-dimensional data using generalized scatterplots by sensitivity coefficients to highlight local variation of one variable with respect to another.
7 Fractions. Number Sense and Numeration Measurement Geometry and Spatial Sense Patterning and Algebra Data Management and Probability
 7 Fractions GRADE 7 FRACTIONS continue to develop proficiency by using fractions in mental strategies and in selecting and justifying use; develop proficiency in adding and subtracting simple fractions;
Appendix A: Graph Types Available in OBIEE
 Appendix A: Graph Types Available in OBIEE OBIEE provides a wide variety of graph types to assist with data analysis, including: Pie Scatter Bar Area Line Radar Line Bar Combo Step Pareto Bubble Each graph
A Web Application to Visualize Trends in Diabetes across the United States
 A Web Application to Visualize Trends in Diabetes across the United States Final Project Report Team: New Bee Team Members: Samyuktha Sridharan, Xuanyi Qi, Hanshu Lin Introduction This project develops
AQA GCSE Maths - Higher Self-Assessment Checklist
 AQA GCSE Maths - Higher Self-Assessment Checklist Number 1 Use place value when calculating with decimals. 1 Order positive and negative integers and decimals using the symbols =,, , and. 1 Round to
8. Time-Based Data. Visualizing Change over time. Dr. Thorsten Büring, 13. Dezember 2007, Vorlesung Wintersemester 2007/08
 8. Time-Based Data Visualizing Change over time Dr. Thorsten Büring, 13. Dezember 2007, Vorlesung Wintersemester 2007/08 Slide 1 / 46 Outline Term clarification, user tasks & taxonomies Historic time-based
Year 9: Long term plan
 Year 9: Long term plan Year 9: Long term plan Unit Hours Powerful procedures 7 Round and round 4 How to become an expert equation solver 6 Why scatter? 6 The construction site 7 Thinking proportionally
SAS Visual Analytics 8.2: Getting Started with Reports
 SAS Visual Analytics 8.2: Getting Started with Reports Introduction Reporting The SAS Visual Analytics tools give you everything you need to produce and distribute clear and compelling reports. SAS Visual
Unit Essential Questions: Does it matter which form of a linear equation that you use?
 Unit Essential Questions: Does it matter which form of a linear equation that you use? How do you use transformations to help graph absolute value functions? How can you model data with linear equations?
5. Interaction with Visualizations Dynamic linking, brushing and filtering in Information Visualization displays
 5. Interaction with Visualizations Dynamic linking, brushing and filtering in Information Visualization displays Vorlesung Informationsvisualisierung Prof. Dr. Andreas Butz, WS 20011/12 Konzept und Basis
Visualization process of Temporal Data
 Visualization process of Temporal Data Chaouki Daassi 1, Laurence Nigay 2 and Marie-Christine Fauvet 2 1 Laboratoire SysCom, Université de Savoie, Chambéry, France 2 Laboratoire CLIPS-IMAG BP 53-38041,
LINEAR TOPICS Notes and Homework: DUE ON EXAM
 NAME CLASS PERIOD LINEAR TOPICS Notes and Homework: DUE ON EXAM VOCABULARY: Make sure ou know the definitions of the terms listed below. These will be covered on the exam. Axis Scatter plot b Slope Coordinate
LAB 2: DATA FILTERING AND NOISE REDUCTION
 NAME: LAB TIME: LAB 2: DATA FILTERING AND NOISE REDUCTION In this exercise, you will use Microsoft Excel to generate several synthetic data sets based on a simplified model of daily high temperatures in
Color Bands: Visualizing Dynamic Eye Movement Patterns
 Color Bands: Visualizing Dynamic Eye Movement Patterns Michael Burch 1, Ayush Kumar 2,3, Klaus Mueller 3 and Daniel Weiskopf 1 1 VISUS, University of Stuttgart 2 SUNY Korea 3 Stony Brook University Figure
Correlation of the ALEKS courses Algebra 1 and High School Geometry to the Wyoming Mathematics Content Standards for Grade 11
 Correlation of the ALEKS courses Algebra 1 and High School Geometry to the Wyoming Mathematics Content Standards for Grade 11 1: Number Operations and Concepts Students use numbers, number sense, and number
PITSCO Math Individualized Prescriptive Lessons (IPLs)
") Orientation Integers 10-10 Orientation I 20-10 Speaking Math Define common math vocabulary. Explore the four basic operations and their solutions. Form equations and expressions. 20-20 Place Value Define
Orientation Integers 10-10 Orientation I 20-10 Speaking Math Define common math vocabulary. Explore the four basic operations and their solutions. Form equations and expressions. 20-20 Place Value Define
Nobody uploads till yesterday, difficult?
 Survey Result 1 Assignment II! Nobody uploads till yesterday, difficult? 2 Last Week: Text Visualization 3 Interaction IV Course Spring 14 Graduate Course of UCAS April 4th, 2014 4 InfoVis Pipeline Visualization
Grade 9 Math Terminology
 Unit 1 Basic Skills Review BEDMAS a way of remembering order of operations: Brackets, Exponents, Division, Multiplication, Addition, Subtraction Collect like terms gather all like terms and simplify as
Lab Activity #2- Statistics and Graphing
 Lab Activity #2- Statistics and Graphing Graphical Representation of Data and the Use of Google Sheets : Scientists answer posed questions by performing experiments which provide information about a given
Quality Metrics for Visual Analytics of High-Dimensional Data
 Quality Metrics for Visual Analytics of High-Dimensional Data Daniel A. Keim Data Analysis and Information Visualization Group University of Konstanz, Germany Workshop on Visual Analytics and Information
Vocabulary Unit 2-3: Linear Functions & Healthy Lifestyles. Scale model a three dimensional model that is similar to a three dimensional object.
 Scale a scale is the ratio of any length in a scale drawing to the corresponding actual length. The lengths may be in different units. Scale drawing a drawing that is similar to an actual object or place.
Data Mining: Exploring Data. Lecture Notes for Chapter 3
 Data Mining: Exploring Data Lecture Notes for Chapter 3 Slides by Tan, Steinbach, Kumar adapted by Michael Hahsler Look for accompanying R code on the course web site. Topics Exploratory Data Analysis
Multivariate Data & Tables and Graphs
 Multivariate Data & Tables and Graphs CS 4460/7450 - Information Visualization Jan. 13, 2009 John Stasko Agenda Data and its characteristics Tables and graphs Design principles Spring 2009 CS 4460/7450
SpringView: Cooperation of Radviz and Parallel Coordinates for View Optimization and Clutter Reduction
 SpringView: Cooperation of Radviz and Parallel Coordinates for View Optimization and Clutter Reduction Enrico Bertini, Luigi Dell Aquila, Giuseppe Santucci Dipartimento di Informatica e Sistemistica -
CS 4460 Intro. to Information Visualization Sep. 18, 2017 John Stasko
 Multivariate Visual Representations 1 CS 4460 Intro. to Information Visualization Sep. 18, 2017 John Stasko Learning Objectives For the following visualization techniques/systems, be able to describe each
Axes-Based Visualizations with Radial Layouts
 Axes-Based Visualizations with Radial Layouts Christian Tominski Institute for Computer Graphics University of Rostock Albert-Einstein-Straße 21 D-18055 Rostock +49 381 498 3418 ct@informatik.uni-rostock.de
Visual Encoding Design
 CSE 442 - Data Visualization Visual Encoding Design Jeffrey Heer University of Washington Last Time: Data & Image Models The Big Picture task questions, goals assumptions data physical data type conceptual
Using R-trees for Interactive Visualization of Large Multidimensional Datasets
 Using R-trees for Interactive Visualization of Large Multidimensional Datasets Alfredo Giménez, René Rosenbaum, Mario Hlawitschka, and Bernd Hamann Institute for Data Analysis and Visualization (IDAV),
Animator: A Tool for the Animation of Parallel Coordinates
 Animator: A Tool for the Animation of Parallel Coordinates N. Barlow, L. J. Stuart The Visualization Lab, Centre for Interactive Intelligent Systems, University of Plymouth, Plymouth, UK nigel.barlow@plymouth.ac.uk,
Many-to-Many Relational Parallel Coordinates Displays
 Many-to-Many Relational Parallel Coordinates Displays Mats Lind, Jimmy Johansson and Matthew Cooper Department of Information Science, Uppsala University, Sweden Norrköping Visualization and Interaction
Chapter 2: Linear Equations and Functions
 Chapter 2: Linear Equations and Functions Chapter 2: Linear Equations and Functions Assignment Sheet Date Topic Assignment Completed 2.1 Functions and their Graphs and 2.2 Slope and Rate of Change 2.1
Multidimensional (Multivariate)
") Multidimensional (Multivariate) Data Visualization IV Course Spring 14 Graduate Course of UCAS May 9th, 2014 1 Data by Dimensionality 1-D (Linear, Set and Sequences) SeeSoft, Info Mural 2-D (Map) GIS,
Multidimensional (Multivariate) Data Visualization IV Course Spring 14 Graduate Course of UCAS May 9th, 2014 1 Data by Dimensionality 1-D (Linear, Set and Sequences) SeeSoft, Info Mural 2-D (Map) GIS,
TDWI strives to provide course books that are contentrich and that serve as useful reference documents after a class has ended.
 Previews of TDWI course books offer an opportunity to see the quality of our material and help you to select the courses that best fit your needs. The previews cannot be printed. TDWI strives to provide
Lecture 2 Map design. Dr. Zhang Spring, 2017
 Lecture 2 Map design Dr. Zhang Spring, 2017 Model of the course Using and making maps Navigating GIS maps Map design Working with spatial data Geoprocessing Spatial data infrastructure Digitizing File
Facet: Multiple View Methods
 Facet: Multiple View Methods Large Data Visualization Torsten Möller Overview Combining views Partitioning Coordinating Multiple Side-by-Side Views Encoding Channels Shared Data Shared Navigation Synchronized
Information Visualization. SWE 432, Fall 2016 Design and Implementation of Software for the Web
 Information Visualization SWE 432, Fall 2016 Design and Implementation of Software for the Web Today What types of information visualization are there? Which one should you choose? What does usability
3 Visualizing quantitative Information
 Elective in Software and Services (Complementi di software e servizi per la società dell'informazione) Section Information Visualization Numbers of credit : 3 Giuseppe Santucci 3 Visualizing quantitative
Computer Science 426 Midterm 3/11/04, 1:30PM-2:50PM
 NAME: Login name: Computer Science 46 Midterm 3//4, :3PM-:5PM This test is 5 questions, of equal weight. Do all of your work on these pages (use the back for scratch space), giving the answer in the space
Information Visualization and Visual Analytics roles, challenges, and examples Giuseppe Santucci
 Information Visualization and Visual Analytics roles, challenges, and examples Giuseppe Santucci VisDis and the Database & User Interface The VisDis and the Database/Interface group background is about:
Lecture Topic Projects
 Lecture Topic Projects 1 Intro, schedule, and logistics 2 Applications of visual analytics, basic tasks, data types 3 Introduction to D3, basic vis techniques for non-spatial data Project #1 out 4 Data
GRAPHING BAYOUSIDE CLASSROOM DATA
 LUMCON S BAYOUSIDE CLASSROOM GRAPHING BAYOUSIDE CLASSROOM DATA Focus/Overview This activity allows students to answer questions about their environment using data collected during water sampling. Learning
Making Science Graphs and Interpreting Data
 Making Science Graphs and Interpreting Data Eye Opener: 5 mins What do you see? What do you think? Look up terms you don t know What do Graphs Tell You? A graph is a way of expressing a relationship between
COMMUNITY UNIT SCHOOL DISTRICT 200
 COMMUNITY UNIT SCHOOL DISTRICT 200 Regular Math Middle School Grade 8 1. Subject Expectation (State Goal 6) Essential Learning 1 (Learning Standard A) (Learning Standard D) Students will be able to demonstrate
Data Mining: Exploring Data. Lecture Notes for Chapter 3
 Data Mining: Exploring Data Lecture Notes for Chapter 3 1 What is data exploration? A preliminary exploration of the data to better understand its characteristics. Key motivations of data exploration include
CIS 602: Provenance & Scientific Data Management. Visualization & Provenance. Dr. David Koop
 CIS 602: Provenance & Scientific Data Management Visualization & Provenance Dr. David Koop Reminders Next class s reading response - Two papers on visualization & provenance - Only need to choose one Project
The Rectangular Coordinate System and Equations of Lines. College Algebra
 The Rectangular Coordinate System and Equations of Lines College Algebra Cartesian Coordinate System A grid system based on a two-dimensional plane with perpendicular axes: horizontal axis is the x-axis
Grade 7 Math Curriculum Map Erin Murphy
 Topic 1 Algebraic Expressions and Integers 2 Weeks Summative Topic Test: SWBAT use rules to add and subtract integers, Evaluate algebraic expressions, use the order of operations, identify numerical and
Dulwich College. SAMPLE PAPER Mathematics
 1+ Dulwich College YEAR 9 ENTRANCE AND SCHOLARSHIP EXAMINATION SAMPLE PAPER Mathematics 1 HOUR 0 MINUTES Use a calculator where appropriate. Answer all the questions. Show all your working. Marks for parts
ALGEBRA II A CURRICULUM OUTLINE
 ALGEBRA II A CURRICULUM OUTLINE 2013-2014 OVERVIEW: 1. Linear Equations and Inequalities 2. Polynomial Expressions and Equations 3. Rational Expressions and Equations 4. Radical Expressions and Equations
Data Analyst Nanodegree Syllabus
 Data Analyst Nanodegree Syllabus Discover Insights from Data with Python, R, SQL, and Tableau Before You Start Prerequisites : In order to succeed in this program, we recommend having experience working
Knowledge Discovery and Data Mining I
 Ludwig-Maximilians-Universität München Lehrstuhl für Datenbanksysteme und Data Mining Prof. Dr. Thomas Seidl Knowledge Discovery and Data Mining I Winter Semester 8/9 Agenda. Introduction. Basics. Data
Contents. About this Book...1 Audience... 1 Prerequisites... 1 Conventions... 2
 Contents About this Book...1 Audience... 1 Prerequisites... 1 Conventions... 2 1 About SAS Sentiment Analysis Workbench...3 1.1 What Is SAS Sentiment Analysis Workbench?... 3 1.2 Benefits of Using SAS
GLOSSARY OF TERMS. Commutative property. Numbers can be added or multiplied in either order. For example, = ; 3 x 8 = 8 x 3.
 GLOSSARY OF TERMS Algorithm. An established step-by-step procedure used 1 to achieve a desired result. For example, the 55 addition algorithm for the sum of two two-digit + 27 numbers where carrying is
Interactive Visual Exploration
 Interactive Visual Exploration of High Dimensional Datasets Jing Yang Spring 2010 1 Challenges of High Dimensional Datasets High dimensional datasets are common: digital libraries, bioinformatics, simulations,