HYPERVARIATE DATA VISUALIZATION
|
|
|
- Rodger Hart
- 5 years ago
- Views:
Transcription
1 HYPERVARIATE DATA VISUALIZATION Prof. Rahul C. Basole CS/MGT 8803-DV > January 25, 2017
2 Agenda Hypervariate Data Project Elevator Pitch
3 Hypervariate Data (n > 3) Many well-known visualization techniques exist for datasets of 1-3 dimensions. We discussed these last time. What about data sets with more than 3 variables (n>3)? Often the interesting, challenging ones Many problems are lower-dimensional hypervariate (4-20) Could use additional data mark properties to encode additional data variables
4 Consider the following Design Challenge Data set of 500 cases Attributes 5 quantitative 4 nominal 2 ordinal Design a Visualization

5 Here is one crazy idea Use a Spreadsheet Each variable is positioned into a column Data cases are rows This is a projection (mapping)
6 Or we can use Multiple Views A B C D E Case 1 Case 2 Case 3 Give each variable its own display. A B C D E Case 4

7 Scatterplot Matrix (n>3) Represent each possible pair of variables in their own 2D scatterplot. Good if pairwise correlation is key.
8 What if we want to handle all datasets generically?
9 Iconic Representations Glyph (graphical object) represents a data case Visual properties of glyph represent different variables
10
11 Chernoff Face (n>3) Encode different variables values in characteristics of human face n=11 Herman Chernoff (1973). "The Use of Faces to Represent Points in K-Dimensional Space Graphically". Journal of the American Statistical Association, 68 (342):
12
13 Star Plots (n>3) Also known by various other names such as radar chart, spider chart, cobweb chart, polar chart etc.
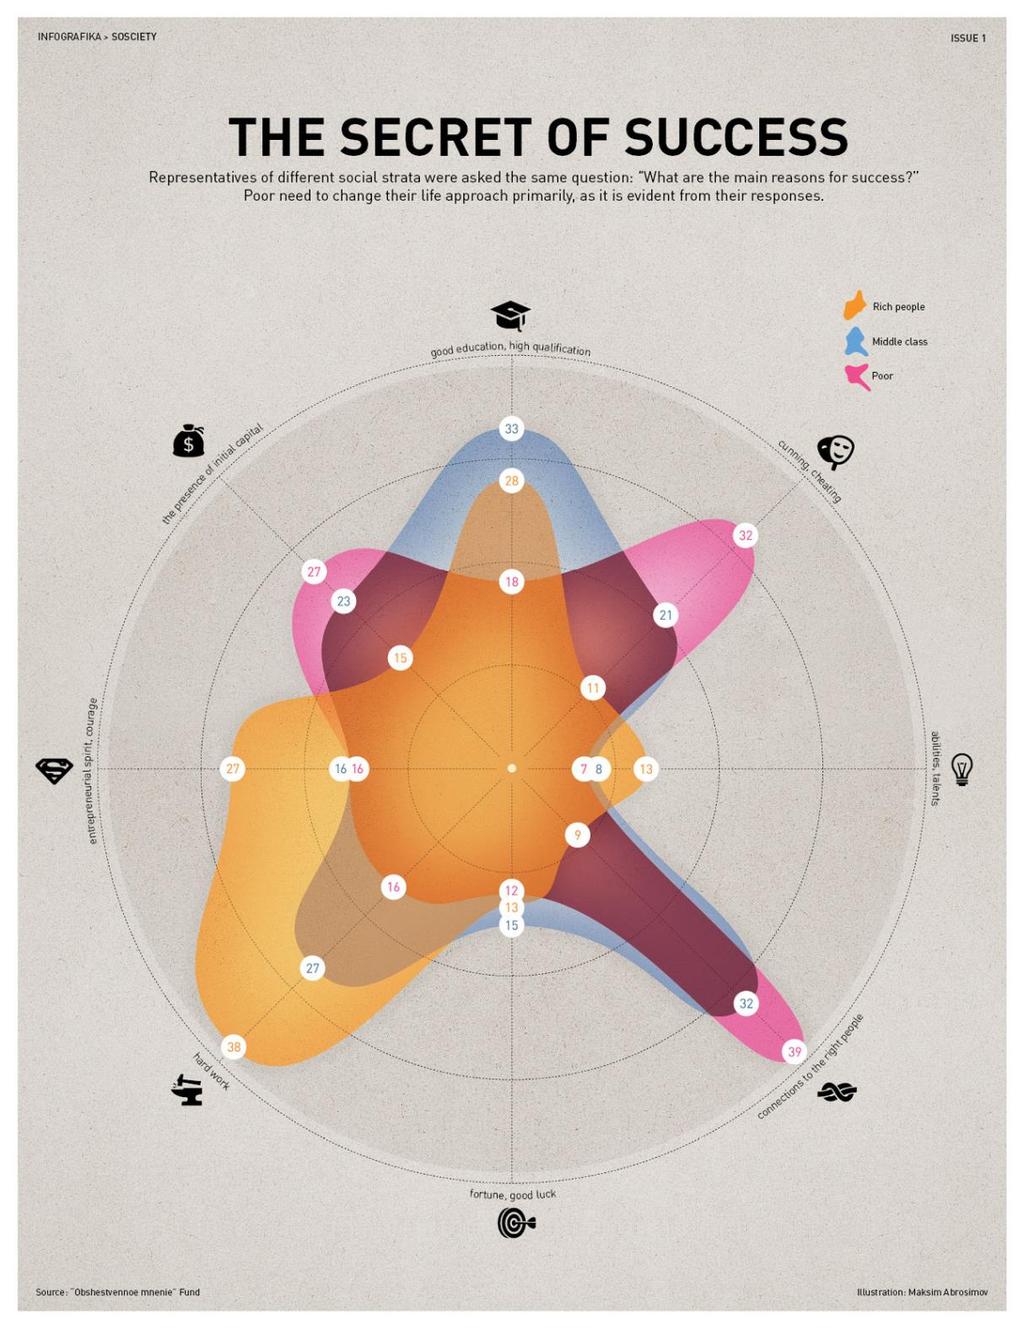
14
15 Small Multiples of Star Plots
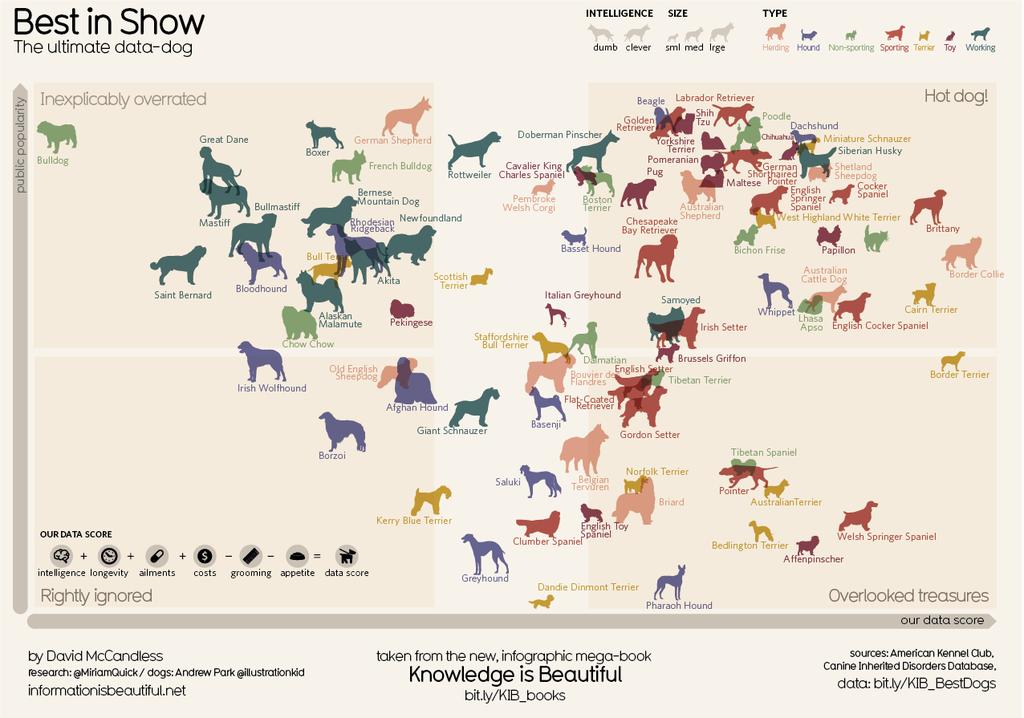
16 Glyphs (n > 3) Think of them as generalizations of star charts and Chernoff faces. A mark a shape or form that can be varied in n ways. 12 variables can be encoded 4 angles, 4 lengths, 4 thicknesses

17 Table Lens Idea: Make the text more visual and symbolic Just leverage basic bar chart idea Change quantitative values to bars What about nominal data?

18

19 LineUp
20 What about Categorical Data? How about multivariate categorical data? Students Gender: Female, male Eye color: Brown, blue, green, hazel Hair color: Black, red, brown, blonde, gray Home country: USA, China, Italy, India,...


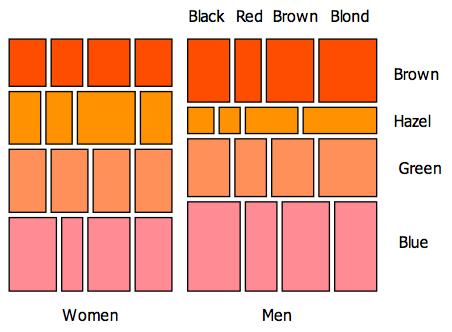

21 Mosaic Plot
 Reorderable Axes http://bl.ocks.")
22 Parallel Coordinates Brushable Reorderable Axes


23 Making Sense of Parallel Coordinates
24 Pixel Displays Represent data case or a variable as a pixel (or as a small glyph such as a circle) Million or more per display Seems to rely on use of color Can pack lots in Challenge: What s the layout? What does position mean?
25 One representation Grouping arrangement One pixel per variable Each data case has its own small rectangular icon Plot out variables for data point in that icon using a grid or spiral layout

26 Illustration Levkowitz Vis 91

27 Sand Dance
28 Design Exercise Pair Up. Visualize the data using any of the techniques we discussed in class. Use colored pencils if needed. Be prepared to discuss/present why you chose a particular technique and how you encoded it. Be creative. Name XONE PS4 PC Gamespot Meta Critic New Price Used Price Genre Titanfall 2 Yes Yes Yes Action Forza Horizon Yes No Yes Sports FIFA 17 Yes Yes Yes Sports Raven s Cry Yes Yes Yes Strategy Gravity Rush No Yes No Action Civilization VI No No Yes Strategy

29 PM1: Elevator Pitch
30 PM2: Teams List your team members + s Name your team. Provide one sentence description of your project topic. Include tag of your topic [Business, Health, Sports, Social Media] Submit PM2 on T-Square.
CS 4460 Intro. to Information Visualization Sep. 18, 2017 John Stasko
 Multivariate Visual Representations 1 CS 4460 Intro. to Information Visualization Sep. 18, 2017 John Stasko Learning Objectives For the following visualization techniques/systems, be able to describe each
VISUALIZATION OF MULTIVARIATE DATA
 VISUALIZATION OF MULTIVARIATE DATA Prof. Rahul C. Basole CS/MGT 8803-DV > January 18, 2017 True/False? Explain Why. InfoVis SciVis Name this Visual Representation Name this Interaction Technique Show of
CS Information Visualization Sep. 19, 2016 John Stasko
 Multivariate Visual Representations 2 CS 7450 - Information Visualization Sep. 19, 2016 John Stasko Learning Objectives Explain the concept of dense pixel/small glyph visualization techniques Describe
CS Information Visualization Sep. 2, 2015 John Stasko
 Multivariate Visual Representations 2 CS 7450 - Information Visualization Sep. 2, 2015 John Stasko Recap We examined a number of techniques for projecting >2 variables (modest number of dimensions) down
Multidimensional (Multivariate)
") Multidimensional (Multivariate) Data Visualization IV Course Spring 14 Graduate Course of UCAS May 9th, 2014 1 Data by Dimensionality 1-D (Linear, Set and Sequences) SeeSoft, Info Mural 2-D (Map) GIS,
Multidimensional (Multivariate) Data Visualization IV Course Spring 14 Graduate Course of UCAS May 9th, 2014 1 Data by Dimensionality 1-D (Linear, Set and Sequences) SeeSoft, Info Mural 2-D (Map) GIS,
Information Visualization
 Information Visualization Text: Information visualization, Robert Spence, Addison-Wesley, 2001 What Visualization? Process of making a computer image or graph for giving an insight on data/information
Multivariate Data More Overview
 Multivariate Data More Overview CS 4460 - Information Visualization Jim Foley Last Revision August 2016 Some Key Concepts Quick Review Data Types Data Marks Basic Data Types N-Nominal (categorical) Equal
3. Multidimensional Information Visualization I Concepts for visualizing univariate to hypervariate data
 3. Multidimensional Information Visualization I Concepts for visualizing univariate to hypervariate data Vorlesung Informationsvisualisierung Prof. Dr. Andreas Butz, WS 2011/12 Konzept und Basis für n:
Multivariate Data & Tables and Graphs. Agenda. Data and its characteristics Tables and graphs Design principles
 Multivariate Data & Tables and Graphs CS 7450 - Information Visualization Aug. 24, 2015 John Stasko Agenda Data and its characteristics Tables and graphs Design principles Fall 2015 CS 7450 2 1 Data Data
Multivariate Data & Tables and Graphs. Agenda. Data and its characteristics Tables and graphs Design principles
 Topic Notes Multivariate Data & Tables and Graphs CS 7450 - Information Visualization Aug. 27, 2012 John Stasko Agenda Data and its characteristics Tables and graphs Design principles Fall 2012 CS 7450
Multivariate Data & Tables and Graphs
 Multivariate Data & Tables and Graphs CS 4460/7450 - Information Visualization Jan. 13, 2009 John Stasko Agenda Data and its characteristics Tables and graphs Design principles Spring 2009 CS 4460/7450
Lab 1 (fall, 2017) Introduction to R and R Studio
 Introduction to R and R Studio") Lab 1 (fall, 201) Introduction to R and R Studio Introduction: Today we will use R, as presented in the R Studio environment (or front end), in an introductory setting. We will make some calculations,
Lab 1 (fall, 201) Introduction to R and R Studio Introduction: Today we will use R, as presented in the R Studio environment (or front end), in an introductory setting. We will make some calculations,
Multiple Dimensional Visualization
 Multiple Dimensional Visualization Dimension 1 dimensional data Given price information of 200 or more houses, please find ways to visualization this dataset 2-Dimensional Dataset I also know the distances
4. Basic Mapping Techniques
 4. Basic Mapping Techniques Mapping from (filtered) data to renderable representation Most important part of visualization Possible visual representations: Position Size Orientation Shape Brightness Color
DSC 201: Data Analysis & Visualization
 DSC 201: Data Analysis & Visualization Visualization Design Dr. David Koop Definition Computer-based visualization systems provide visual representations of datasets designed to help people carry out tasks
Visual Encoding Design
 CSE 442 - Data Visualization Visual Encoding Design Jeffrey Heer University of Washington Last Time: Data & Image Models The Big Picture task questions, goals assumptions data physical data type conceptual
Visual Encoding Design
 CSE 442 - Data Visualization Visual Encoding Design Jeffrey Heer University of Washington Review: Expressiveness & Effectiveness / APT Choosing Visual Encodings Assume k visual encodings and n data attributes.
Homework 1 Excel Basics
 Homework 1 Excel Basics Excel is a software program that is used to organize information, perform calculations, and create visual displays of the information. When you start up Excel, you will see the
Introduction to Minitab 1
 Introduction to Minitab 1 We begin by first starting Minitab. You may choose to either 1. click on the Minitab icon in the corner of your screen 2. go to the lower left and hit Start, then from All Programs,
TNM093 Tillämpad visualisering och virtuell verklighet. Jimmy Johansson C-Research, Linköping University
 TNM093 Tillämpad visualisering och virtuell verklighet Jimmy Johansson C-Research, Linköping University Introduction to Visualization New Oxford Dictionary of English, 1999 visualize - verb [with obj.]
Information Visualization. Jing Yang Spring Multi-dimensional Visualization (1)
") Information Visualization Jing Yang Spring 2008 1 Multi-dimensional Visualization (1) 2 1 Multi-dimensional (Multivariate) Dataset 3 Data Item (Object, Record, Case) 4 2 Dimension (Variable, Attribute)
Information Visualization Jing Yang Spring 2008 1 Multi-dimensional Visualization (1) 2 1 Multi-dimensional (Multivariate) Dataset 3 Data Item (Object, Record, Case) 4 2 Dimension (Variable, Attribute)
Parallel Coordinates ++
 Parallel Coordinates ++ CS 4460/7450 - Information Visualization Feb. 2, 2010 John Stasko Last Time Viewed a number of techniques for portraying low-dimensional data (about 3
Approaches to Visual Mappings
 Approaches to Visual Mappings CMPT 467/767 Visualization Torsten Möller Weiskopf/Machiraju/Möller Overview Effectiveness of mappings Mapping to positional quantities Mapping to shape Mapping to color Mapping
Bar Charts and Frequency Distributions
 Bar Charts and Frequency Distributions Use to display the distribution of categorical (nominal or ordinal) variables. For the continuous (numeric) variables, see the page Histograms, Descriptive Stats
Visual Computing. Lecture 2 Visualization, Data, and Process
 Visual Computing Lecture 2 Visualization, Data, and Process Pipeline 1 High Level Visualization Process 1. 2. 3. 4. 5. Data Modeling Data Selection Data to Visual Mappings Scene Parameter Settings (View
Data Mining: Exploring Data. Lecture Notes for Chapter 3
 Data Mining: Exploring Data Lecture Notes for Chapter 3 Slides by Tan, Steinbach, Kumar adapted by Michael Hahsler Look for accompanying R code on the course web site. Topics Exploratory Data Analysis
Statistical Package for the Social Sciences INTRODUCTION TO SPSS SPSS for Windows Version 16.0: Its first version in 1968 In 1975.
 Statistical Package for the Social Sciences INTRODUCTION TO SPSS SPSS for Windows Version 16.0: Its first version in 1968 In 1975. SPSS Statistics were designed INTRODUCTION TO SPSS Objective About the
LSP 121. LSP 121 Math and Tech Literacy II. Topics. Quartiles. Intro to Statistics. More Descriptive Statistics
 Greg Brewster, DePaul University Page 1 LSP 121 Math and Tech Literacy II More Descriptive Statistics Greg Brewster DePaul University Topics More Descriptive Statistics Quartiles Percentiles Categorical
CIS 467/602-01: Data Visualization
 CIS 467/602-01: Data Visualization Tables Dr. David Koop Assignment 2 http://www.cis.umassd.edu/ ~dkoop/cis467/assignment2.html Plagiarism on Assignment 1 Any questions? 2 Recap (Interaction) Important
DSC 201: Data Analysis & Visualization
 DSC 201: Data Analysis & Visualization Exploratory Data Analysis Dr. David Koop What is Exploratory Data Analysis? "Detective work" to summarize and explore datasets Includes: - Data acquisition and input
Multi-Dimensional Vis
 CSE512 :: 21 Jan 2014 Multi-Dimensional Vis Jeffrey Heer University of Washington 1 Last Time: Exploratory Data Analysis 2 Exposure, the effective laying open of the data to display the unanticipated,
8. MINITAB COMMANDS WEEK-BY-WEEK
 8. MINITAB COMMANDS WEEK-BY-WEEK In this section of the Study Guide, we give brief information about the Minitab commands that are needed to apply the statistical methods in each week s study. They are
3. Multidimensional Information Visualization II Concepts for visualizing univariate to hypervariate data
 3. Multidimensional Information Visualization II Concepts for visualizing univariate to hypervariate data Vorlesung Informationsvisualisierung Prof. Dr. Andreas Butz, WS 2009/10 Konzept und Basis für n:
INFORMATION VISUALIZATION
 CSE 557A Sep 26, 2016 INFORMATION VISUALIZATION Alvitta Ottley Washington University in St. Louis Slide Credits: Mariah Meyer, University of Utah Remco Chang, Tufts University HEIDELBERG LAUREATE FORUM
Charts in Excel 2003
 Charts in Excel 2003 Contents Introduction Charts in Excel 2003...1 Part 1: Generating a Basic Chart...1 Part 2: Adding Another Data Series...3 Part 3: Other Handy Options...5 Introduction Charts in Excel
JMP 10 Student Edition Quick Guide
 JMP 10 Student Edition Quick Guide Instructions presume an open data table, default preference settings and appropriately typed, user-specified variables of interest. RMC = Click Right Mouse Button Graphing
Scien&fic and Large Data Visualiza&on 22 November 2017 High Dimensional Data. Massimiliano Corsini Visual Compu,ng Lab, ISTI - CNR - Italy
 Scien&fic and Large Data Visualiza&on 22 November 2017 High Dimensional Data Massimiliano Corsini Visual Compu,ng Lab, ISTI - CNR - Italy Overview Graphs Extensions Glyphs Chernoff Faces Mul&-dimensional
Hands On Exploration of NETCONF and YANG
 Hands On Exploration of NETCONF and YANG Bryan Byrne, CCIE 25607 (R/S) Technical Solutions Architect Enterprise Networks @bryan25607 Agenda Introduction Module 1 YANG Data Modeling Module 2 Introduction
Data Analysis More Than Two Variables: Graphical Multivariate Analysis
 Data Analysis More Than Two Variables: Graphical Multivariate Analysis Prof. Dr. Jose Fernando Rodrigues Junior ICMC-USP 1 What is it about? More than two variables determine a tough analytical problem
CSE Data Visualization. Multidimensional Vis. Jeffrey Heer University of Washington
 CSE 512 - Data Visualization Multidimensional Vis Jeffrey Heer University of Washington Last Time: Exploratory Data Analysis Exposure, the effective laying open of the data to display the unanticipated,
TYPES OF VARIABLES, STRUCTURE OF DATASETS, AND BASIC STATA LAYOUT
 PRIMER FOR ACS OUTCOMES RESEARCH COURSE: TYPES OF VARIABLES, STRUCTURE OF DATASETS, AND BASIC STATA LAYOUT STEP 1: Install STATA statistical software. STEP 2: Read through this primer and complete the
Creating Vector Shapes Week 2 Assignment 1. Illustrator Defaults
 Illustrator Defaults Before we begin, we are going to make sure that all of us are using the same settings within our application. For this class, we will always want to make sure that our application
Glyphs. Presentation Overview. What is a Glyph!? Cont. What is a Glyph!? Glyph Fundamentals. Goal of Paper. Presented by Bertrand Low
 Presentation Overview Glyphs Presented by Bertrand Low A Taxonomy of Glyph Placement Strategies for Multidimensional Data Visualization Matthew O. Ward, Information Visualization Journal, Palmgrave,, Volume
Excel 2010 with XLSTAT
 Excel 2010 with XLSTAT J E N N I F E R LE W I S PR I E S T L E Y, PH.D. Introduction to Excel 2010 with XLSTAT The layout for Excel 2010 is slightly different from the layout for Excel 2007. However, with
Pre-Lab Excel Problem
 Pre-Lab Excel Problem Read and follow the instructions carefully! Below you are given a problem which you are to solve using Excel. If you have not used the Excel spreadsheet a limited tutorial is given
Chapter 2: Looking at Multivariate Data
 Chapter 2: Looking at Multivariate Data Multivariate data could be presented in tables, but graphical presentations are more effective at displaying patterns. We can see the patterns in one variable at
Perception Maneesh Agrawala CS : Visualization Fall 2013 Multidimensional Visualization
 Perception Maneesh Agrawala CS 294-10: Visualization Fall 2013 Multidimensional Visualization 1 Visual Encoding Variables Position Length Area Volume Value Texture Color Orientation Shape ~8 dimensions?
Courtesy of Prof. Shixia University
 Courtesy of Prof. Shixia Liu @Tsinghua University Outline Introduction Classification of Techniques Table Scatter Plot Matrices Projections Parallel Coordinates Summary Motivation Real world data contain
Applied Regression Modeling: A Business Approach
 i Applied Regression Modeling: A Business Approach Computer software help: SAS SAS (originally Statistical Analysis Software ) is a commercial statistical software package based on a powerful programming
Data Mining: Exploring Data. Lecture Notes for Chapter 3
 Data Mining: Exploring Data Lecture Notes for Chapter 3 1 What is data exploration? A preliminary exploration of the data to better understand its characteristics. Key motivations of data exploration include
Interactive Visualization for Computational Linguistics
 Interactive Visualization for Computational Linguistics ESSLII 2009 2 Interaction and animation References 3 Slides in this section are based on: Yi et al., Toward a Deeper Understanding of the Role of
Use Audacity to Make one long MP3 song from several songs
 Use Audacity to Make one long MP3 song from several songs Purpose: Some video producing sites such as Animoto may only let you add one song, which will not be long enough if you add a lot of pictures.
Data Visualization (CIS/DSC 468)
") Data Visualization (CIS/DSC 468) Tabular Data Dr. David Koop Channel Considerations Discriminability Separability Visual Popout Weber's Law Luminance Perception 2 Separability Cannot treat all channels
Data Visualization (CIS/DSC 468) Tabular Data Dr. David Koop Channel Considerations Discriminability Separability Visual Popout Weber's Law Luminance Perception 2 Separability Cannot treat all channels
Homework # 4. Example: Age in years. Answer: Discrete, quantitative, ratio. a) Year that an event happened, e.g., 1917, 1950, 2000.
 Year that an event happened, e.g., 1917, 1950, 2000.") Homework # 4 1. Attribute Types Classify the following attributes as binary, discrete, or continuous. Further classify the attributes as qualitative (nominal or ordinal) or quantitative (interval or ratio).
Homework # 4 1. Attribute Types Classify the following attributes as binary, discrete, or continuous. Further classify the attributes as qualitative (nominal or ordinal) or quantitative (interval or ratio).
CSE Data Visualization. Multidimensional Vis. Jeffrey Heer University of Washington
 CSE 512 - Data Visualization Multidimensional Vis Jeffrey Heer University of Washington Last Time: Exploratory Data Analysis Exposure, the effective laying open of the data to display the unanticipated,
Chord chart. Luca Rossato 2014/01/17 17:36
 Chord chart Luca Rossato 2014/01/17 17:36 Table of Contents 1 Introduction... 3 2 Dataset... 4 2.1 Filtered Dataset... 4 2.2 Dataset As-is... 4 3 Template... 5 4 Documents... 6 Page 2 - last modified by
Data Mining: Exploring Data. Lecture Notes for Chapter 3. Introduction to Data Mining
 Data Mining: Exploring Data Lecture Notes for Chapter 3 Introduction to Data Mining by Tan, Steinbach, Kumar What is data exploration? A preliminary exploration of the data to better understand its characteristics.
Entry Name: "INRIA-Perin-MC1" VAST 2013 Challenge Mini-Challenge 1: Box Office VAST
 Entry Name: "INRIA-Perin-MC1" VAST 2013 Challenge Mini-Challenge 1: Box Office VAST Team Members: Charles Perin, INRIA, Univ. Paris-Sud, CNRS-LIMSI, charles.perin@inria.fr PRIMARY Student Team: YES Analytic
Data Mining: Exploring Data. Lecture Notes for Data Exploration Chapter. Introduction to Data Mining
 Data Mining: Exploring Data Lecture Notes for Data Exploration Chapter Introduction to Data Mining by Tan, Steinbach, Karpatne, Kumar 02/03/2018 Introduction to Data Mining 1 What is data exploration?
Anatomy of Tables and Graphs. Matthew Wettergreen, PhD
 Anatomy of Tables and Graphs Matthew Wettergreen, PhD What You Will Learn Tables: Data in a Tabular Form Anatomy of a Table Types of Tables Graphs: Data in a Visual Form Anatomy of a Graph Commonly used
type. Hitting Enter C3 B Data Males Using formulas highlighted Hit Enter 6. Select cell D4 following: 7. Select cell B5
 Statistics and Data Analysis: Ch. 2 Using Excel for Categorical Displays 1. Get your laptop out of the cart in the front of the room and log on. 2. Open the Microsoft Excel 2010. Excel will open with a
Multidimensional Scaling Presentation. Spring Rob Goodman Paul Palisin
 1 Multidimensional Scaling Presentation Spring 2009 Rob Goodman Paul Palisin Social Networking Facebook MySpace Instant Messaging Email Youtube Text Messaging Twitter 2 Create a survey for your MDS Enter
Chapter 2 Assignment (due Thursday, April 19)
") (due Thursday, April 19) Introduction: The purpose of this assignment is to analyze data sets by creating histograms and scatterplots. You will use the STATDISK program for both. Therefore, you should
(due Thursday, April 19) Introduction: The purpose of this assignment is to analyze data sets by creating histograms and scatterplots. You will use the STATDISK program for both. Therefore, you should
Chapter 4 Multivariate Analysis
 Chapter 4 Multivariate Analysis We have already introduced the concept of multivariate data, which are collections of data in which many attributes (usually more than four) change with respect to one or
UW Oshkosh WordPress Training Manual. June 2015 Integrated Marketing Communications *Updated January 2016
 UW Oshkosh WordPress Training Manual June 2015 Integrated Marketing Communications *Updated January 2016 Table of Contents What is WordPress...3 WordPress Resources...3 Website Best Practices...4 How to
Error-Bar Charts from Summary Data
 Chapter 156 Error-Bar Charts from Summary Data Introduction Error-Bar Charts graphically display tables of means (or medians) and variability. Following are examples of the types of charts produced by
Research Methods for Business and Management. Session 8a- Analyzing Quantitative Data- using SPSS 16 Andre Samuel
 Research Methods for Business and Management Session 8a- Analyzing Quantitative Data- using SPSS 16 Andre Samuel A Simple Example- Gym Purpose of Questionnaire- to determine the participants involvement
Data Visualization. Fall 2016
 Data Visualization Fall 2016 Information Visualization Upon now, we dealt with scientific visualization (scivis) Scivisincludes visualization of physical simulations, engineering, medical imaging, Earth
Excel Tips and FAQs - MS 2010
 BIOL 211D Excel Tips and FAQs - MS 2010 Remember to save frequently! Part I. Managing and Summarizing Data NOTE IN EXCEL 2010, THERE ARE A NUMBER OF WAYS TO DO THE CORRECT THING! FAQ1: How do I sort my
PowerPoint Module 2: Modifying a Presentation
 1. In the Outline pane, a highlighted slide icon next to the slide number indicates that the slide is selected. True PowerPoint 26 LEARNING OBJECTIVES: BESK.OFIN.16.297 - Enter text in Outline view 2.
Large Scale Information
 Large Scale Information Visualization Jing Yang Fall 2009 1 Relevant Information Course webpage: www.cs.uncc.edu/~jyang13 Schedule Grading policy Slides Assignments 2 1 Visualization Visualization - the
Representation. (R. Spence, 2007)
") Representation (R. Spence, 2007) InfoVis, Universidade de Aveiro Beatriz Sousa Santos Data and gain insight We look at that picture Ah HA!! Information visualization The process of information visualization:
Representation (R. Spence, 2007) InfoVis, Universidade de Aveiro Beatriz Sousa Santos Data and gain insight We look at that picture Ah HA!! Information visualization The process of information visualization:
ENGR Fall Exam 1
 ENGR 13100 Fall 2012 Exam 1 INSTRUCTIONS: Duration: 60 minutes Keep your eyes on your own work! Keep your work covered at all times! 1. Each student is responsible for following directions. Read carefully.
Prior Knowledge Chart
 Prior Knowledge Chart Country Economic Status Physical Characteristics Cultural Characteristics Argentina Australia Bolivia Botswana Canada China Cote d' Ivoire Fiji Germany Guatemala Country Economic
Knowledge Discovery and Data Mining I
 Ludwig-Maximilians-Universität München Lehrstuhl für Datenbanksysteme und Data Mining Prof. Dr. Thomas Seidl Knowledge Discovery and Data Mining I Winter Semester 8/9 Agenda. Introduction. Basics. Data
BIO 360: Vertebrate Physiology Lab 9: Graphing in Excel. Lab 9: Graphing: how, why, when, and what does it mean? Due 3/26
 Lab 9: Graphing: how, why, when, and what does it mean? Due 3/26 INTRODUCTION Graphs are one of the most important aspects of data analysis and presentation of your of data. They are visual representations
Describable Visual Attributes for Face Verification and Image Search
 Advanced Topics in Multimedia Analysis and Indexing, Spring 2011, NTU. 1 Describable Visual Attributes for Face Verification and Image Search Kumar, Berg, Belhumeur, Nayar. PAMI, 2011. Ryan Lei 2011/05/05
An Introduction to Minitab Statistics 529
 An Introduction to Minitab Statistics 529 1 Introduction MINITAB is a computing package for performing simple statistical analyses. The current version on the PC is 15. MINITAB is no longer made for the
Brief Guide on Using SPSS 10.0
 Brief Guide on Using SPSS 10.0 (Use student data, 22 cases, studentp.dat in Dr. Chang s Data Directory Page) (Page address: http://www.cis.ysu.edu/~chang/stat/) I. Processing File and Data To open a new
POWERPOINT Build a Presentation to Remember
 POWERPOINT 2007 Build a Presentation to Remember Microsoft Office 2007 TABLE OF CONTENTS DOCUMENT THEMES... 1 THEMES... 1 COLOR SETS... 1 FONT SETS... 1 MASTER SLIDES... 2 USING THEMES IN THE SLIDE MASTER...
Today s Class. High Dimensional Data & Dimensionality Reduc8on. Readings for This Week: Today s Class. Scien8fic Data. Misc. Personal Data 2/22/12
 High Dimensional Data & Dimensionality Reduc8on Readings for This Week: Graphical Histories for Visualiza8on: Suppor8ng Analysis, Communica8on, and Evalua8on, Jeffrey Heer, Jock D. Mackinlay, Chris Stolte,
In this lesson, you ll learn how to:
 LESSON 5: ADVANCED DRAWING TECHNIQUES OBJECTIVES In this lesson, you ll learn how to: apply gradient fills modify graphics by smoothing, straightening, and optimizing understand the difference between
INTRODUCTION TO SPSS OUTLINE 6/17/2013. Assoc. Prof. Dr. Md. Mujibur Rahman Room No. BN Phone:
 INTRODUCTION TO SPSS Assoc. Prof. Dr. Md. Mujibur Rahman Room No. BN-0-024 Phone: 89287269 E-mail: mujibur@uniten.edu.my OUTLINE About the four-windows in SPSS The basics of managing data files The basic
1. Basic Steps for Data Analysis Data Editor. 2.4.To create a new SPSS file
 1 SPSS Guide 2009 Content 1. Basic Steps for Data Analysis. 3 2. Data Editor. 2.4.To create a new SPSS file 3 4 3. Data Analysis/ Frequencies. 5 4. Recoding the variable into classes.. 5 5. Data Analysis/
Course Number 432/433 Title Algebra II (A & B) H Grade # of Days 120
 H Grade # of Days 120") Whitman-Hanson Regional High School provides all students with a high- quality education in order to develop reflective, concerned citizens and contributing members of the global community. Course Number
Whitman-Hanson Regional High School provides all students with a high- quality education in order to develop reflective, concerned citizens and contributing members of the global community. Course Number
Lab 2. Task 1 : Learning basic tasks with PowerPoint. Estimated time
 Lab 2 Task 1 : Learning basic tasks with PowerPoint Objective : To familiarize with basic tasks in PowerPoint : 1. Create a presentation 2. Find and apply a template 3. Insert a new slide 4. Format text
CP SC 8810 Data Visualization. Joshua Levine
 CP SC 8810 Data Visualization Joshua Levine levinej@clemson.edu Lecture 15 Text and Sets Oct. 14, 2014 Agenda Lab 02 Grades! Lab 03 due in 1 week Lab 2 Summary Preferences on x-axis label separation 10
Breeding Guide. Customer Services PHENOME-NETWORKS 4Ben Gurion Street, 74032, Nes-Ziona, Israel
 Breeding Guide Customer Services PHENOME-NETWORKS 4Ben Gurion Street, 74032, Nes-Ziona, Israel www.phenome-netwoks.com Contents PHENOME ONE - INTRODUCTION... 3 THE PHENOME ONE LAYOUT... 4 THE JOBS ICON...
Statistical graphics in analysis Multivariable data in PCP & scatter plot matrix. Paula Ahonen-Rainio Maa Visual Analysis in GIS
 Statistical graphics in analysis Multivariable data in PCP & scatter plot matrix Paula Ahonen-Rainio Maa-123.3530 Visual Analysis in GIS 11.11.2015 Topics today YOUR REPORTS OF A-2 Thematic maps with charts
Instructional Improvement System (IIS) Dashboard District User Guide Statewide Longitudinal Data System (SLDS)
 Dashboard District User Guide Statewide Longitudinal Data System (SLDS)") Instructional Improvement System (IIS) Dashboard District User Guide Statewide Longitudinal Data System (SLDS) June 10, 2014 Page 1 of 36 IIS Dashboard District User Guide 2 Contents Project Overview...
Instructional Improvement System (IIS) Dashboard District User Guide Statewide Longitudinal Data System (SLDS) June 10, 2014 Page 1 of 36 IIS Dashboard District User Guide 2 Contents Project Overview...
Organisation and Presentation of Data in Medical Research Dr K Saji.MD(Hom)
") Organisation and Presentation of Data in Medical Research Dr K Saji.MD(Hom) Any data collected by a research or reference also known as raw data are always in an unorganized form and need to be organized
Organisation and Presentation of Data in Medical Research Dr K Saji.MD(Hom) Any data collected by a research or reference also known as raw data are always in an unorganized form and need to be organized
Arizona Academic Standards
 Arizona Academic Standards This chart correlates the Grade 8 performance objectives from the mathematics standard of the Arizona Academic Standards to the lessons in Review, Practice, and Mastery. Lesson
Microsoft Office Word 2013 Intermediate. Course 01 Working with Tables and Charts
 Microsoft Office Word 2013 Intermediate Course 01 Working with Tables and Charts Slide 1 Course 01: Working with Tables and Charts Sort Table Data Control Cell Layout Perform Calculations in a Table Create
Middle School Math Course 3
 Middle School Math Course 3 Correlation of the ALEKS course Middle School Math Course 3 to the Texas Essential Knowledge and Skills (TEKS) for Mathematics Grade 8 (2012) (1) Mathematical process standards.
Information Visualization in Data Mining. S.T. Balke Department of Chemical Engineering and Applied Chemistry University of Toronto
 Information Visualization in Data Mining S.T. Balke Department of Chemical Engineering and Applied Chemistry University of Toronto Motivation Data visualization relies primarily on human cognition for
IENG484 Quality Engineering Lab 1 RESEARCH ASSISTANT SHADI BOLOUKIFAR
 IENG484 Quality Engineering Lab 1 RESEARCH ASSISTANT SHADI BOLOUKIFAR SPSS (Statistical package for social science) Originally is acronym of Statistical Package for the Social Science but, now it stands
18.02 Multivariable Calculus Fall 2007
 MIT OpenCourseWare http://ocw.mit.edu 18.02 Multivariable Calculus Fall 2007 For information about citing these materials or our Terms of Use, visit: http://ocw.mit.edu/terms. 18.02 Problem Set 4 Due Thursday
Single Slit Diffraction
 Name: Date: PC1142 Physics II Single Slit Diffraction 5 Laboratory Worksheet Part A: Qualitative Observation of Single Slit Diffraction Pattern L = a 2y 0.20 mm 0.02 mm Data Table 1 Question A-1: Describe
POWERPOINT BASICS: MICROSOFT OFFICE 2010
 POWERPOINT BASICS: MICROSOFT OFFICE 2010 GETTING STARTED PAGE 02 Prerequisites What You Will Learn USING MICROSOFT POWERPOINT PAGE 03 Microsoft PowerPoint Components SIMPLE TASKS IN MICROSOFT POWERPOINT
EVOLVE : A Visualization Tool for Multi-Objective Optimization Featuring Linked View of Explanatory Variables and Objective Functions
 2014 18th International Conference on Information Visualisation EVOLVE : A Visualization Tool for Multi-Objective Optimization Featuring Linked View of Explanatory Variables and Objective Functions Maki