TNM093 Tillämpad visualisering och virtuell verklighet. Jimmy Johansson C-Research, Linköping University
|
|
|
- Verity Gardner
- 5 years ago
- Views:
Transcription
1 TNM093 Tillämpad visualisering och virtuell verklighet Jimmy Johansson C-Research, Linköping University
2 Introduction to Visualization New Oxford Dictionary of English, 1999 visualize - verb [with obj.] Form a mental image of; imagine: it is not easy to visualize the future. Make (something) visible to the eye: the DNA as visualized by staining with ethidium bromide. 2
3 Introduction to Visualization New Oxford Dictionary of English, 1999 visualize - verb [with obj.] Form a mental image of; imagine: it is not easy to visualize the future. Make (something) visible to the eye: the DNA as visualized by staining with ethidium bromide. 2
4 Visualization is... 3
5 Visualization is... The process by which we understand things 3
6 Visualization is... The process by which we understand things The process by which we interpret information - build our mental picture 3
7 4
8 This is not a visualization! 4
9 This is not a visualization! This is a picture! 4
10 This is not a visualization! This is a picture! A representation of data 4
11 This is not a visualization! This is a picture! A representation of data The visualization is all in *your* mind 4

12 This is not a visualization! This is a picture! A representation of data The visualization is all in *your* mind It s personal and unique 4
13 Visualization is... 5
14 Visualization is... Creating representations of data to allow the user to: 5
15 Visualization is... Creating representations of data to allow the user to: - visualize (understand) information 5
16 Visualization is... Creating representations of data to allow the user to: - visualize (understand) information - visualize (identify) patterns and relationships present 5
17 Visualization is... Creating representations of data to allow the user to: - visualize (understand) information - visualize (identify) patterns and relationships present - Gain understanding 5
18 Visualization is... Creating representations of data to allow the user to: - visualize (understand) information - visualize (identify) patterns and relationships present - Gain understanding - Acquire insight 5
19 What the user wants To be presented interpretable information 6
20 What the user wants To be presented interpretable information Representation 6
21 What the user wants To be presented interpretable information Representation Perception 6
22 What the user wants To be presented interpretable information Representation Perception Cognition 6
23 What the user wants To be presented interpretable information Representation Perception Insight Cognition 6
24 What the user wants To be presented interpretable information Representation Perception Insight Cognition 6
25 Representations 7
26 Representations Must be concise: All the information As simply as possible 7
27 Representations Must be concise: All the information As simply as possible Perceivable: Easy to sense (see, hear, feel, smell...) 7
28 Representations Must be concise: All the information As simply as possible Perceivable: Easy to sense (see, hear, feel, smell...) Interpretable: Provide cues which inform the user 7
29 Why Visualization? 8
30 Why Visualization? Large data 8
31 Why Visualization? Large data Multivariate data Lots of data sources Data fusion 8
32 Why Visualization? Large data Multivariate data Lots of data sources Data fusion Time-dependent data Measured or simulated 8
33 Why visualize? Mean x: 9 Mean y: 7.5 Var x: 11 Var y: 4.1 Corr (x,y): 0.8 LR: y = x

34 Representations Complex Simple 10
35 Visualization Pipeline Series of stages from data to representation 11
36 Visualization Pipeline Series of stages from data to representation Raw Data 11
37 Visualization Pipeline Series of stages from data to representation Internal Data Data Reader Raw Data 11
38 Visualization Pipeline Series of stages from data to representation Internal Data Filter Refined Data Data Reader Raw Data 11
39 Visualization Pipeline Series of stages from data to representation Internal Data Filter Refined Data Mapping Objects Data Reader Raw Data 11
40 Visualization Pipeline Series of stages from data to representation Internal Data Filter Refined Data Mapping Objects Data Reader Render Raw Data Representation 11
41 Visualization Pipeline Series of stages from data to representation Internal Data Filter Refined Data Mapping Objects Data Reader Render Raw Data Interaction Representation 11
42 VP: Filtering Internal Data Filter Refined Data Selecting data to seek specific relationships Reducing data to manageable sizes Modifying the internal structure 12
43 VP: Mapping Refined Data Mapping Objects Select representation Map refined data to model Driven by models of human perception 13
44 VP: Rendering Objects Render Representation 14
45 VP: Rendering Render (simple) shapes/ forces/sounds/... Objects Render Representation 14
46 VP: Rendering Render (simple) shapes/ forces/sounds/... Simple for ease of interpretation... Objects Render Representation 14

47 VP: Rendering Render (simple) shapes/ forces/sounds/... Simple for ease of interpretation... Objects Render...and ease of interaction Vital for exploration Representation 14
48 Visualization methods 15
49 Visualization methods 1D/2D: Graphs, charts, scatterplots, maps 15
50 Visualization methods 1D/2D: Graphs, charts, scatterplots, maps Multivariate: 15
51 Visualization methods 1D/2D: Graphs, charts, scatterplots, maps Multivariate: plot matrices 15
52 Visualization methods 1D/2D: Graphs, charts, scatterplots, maps Multivariate: plot matrices Parallel coordinates 15
53 Visualization methods 1D/2D: Graphs, charts, scatterplots, maps Multivariate: plot matrices Parallel coordinates Volume data: 15
54 Visualization methods 1D/2D: Graphs, charts, scatterplots, maps Multivariate: plot matrices Parallel coordinates Volume data: Direct volume rendering 15
55 Visualization methods 1D/2D: Graphs, charts, scatterplots, maps Multivariate: plot matrices Parallel coordinates Volume data: Direct volume rendering Geometric: isosurfacing 15
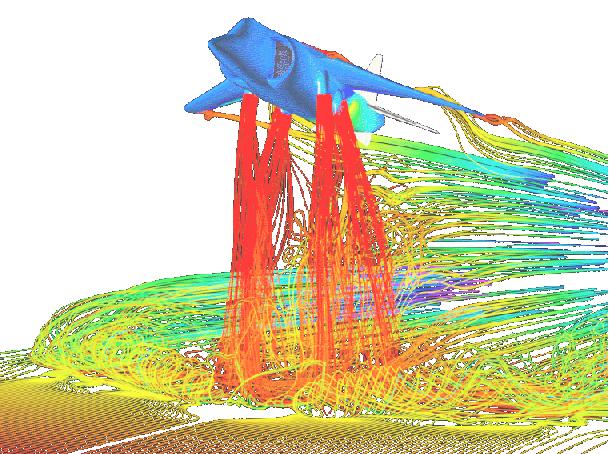
56 Visualization methods 1D/2D: Graphs, charts, scatterplots, maps Multivariate: plot matrices Parallel coordinates Volume data: Direct volume rendering Geometric: isosurfacing Vector data: glyphs (arrows etc), streamlines 15
57 Data Types Spatial Abstract 16
58 Data Types Spatial Abstract Direct mapping Intuitive 16
59 Data Types Spatial Abstract Direct mapping Intuitive 16
60 Data Types Spatial Abstract Direct mapping Intuitive 16
61 Data Types Spatial Abstract Direct mapping Intuitive No spatial mapping Non-intuitive 16


62 Data Types Spatial Abstract Direct mapping Intuitive No spatial mapping Non-intuitive 16
63 Types of data
64 Types of data Categorical / Qualitative Numerical / Quantitative
65 Types of data Categorical / Qualitative Numerical / Quantitative Nominal Ordinal Model Saab Volvo Opel Boot Large Medium Small
66 Types of data Categorical / Qualitative Numerical / Quantitative Nominal Ordinal Interval Ratio Model Boot Year Weight Saab Large Volvo Medium Opel Small


67 Information visualization Visualization of abstract data (Usually) no connection to any specific coordinate system Examples: financial data, internet logs (all types of statistics)


68 Internet History of Rock Frequency of words in a book Major causes of death in the 20th century

69 Encoding of value
70 Tabular data Model Boot Year Weight Saab Large Volvo Medium Opel Small
71 Tabular data Model Boot Year Weight Saab Large Volvo Medium Opel Small Data value
72 Tabular data Model Boot Year Weight Saab Large Volvo Medium Opel Small Variable / parameter / dimension
73 Tabular data Model Boot Year Weight Saab Large Volvo Medium Opel Small Variable / parameter / dimension
74 Tabular data Model Boot Year Weight Saab Large Volvo Medium Opel Small Object / item / tuple / record
75 Tabular data Model Boot Year Weight Saab Large Volvo Medium Opel Small Object / item / tuple / record

76 The encoding of value Bar chart

77 The encoding of value Stacked bar chart

78 The encoding of value Histogram
79 The encoding of value 2D scatter plots V1 V1 V1 V1 V2 V1 V2 V1 V2 V2 V2 Time
80 The encoding of value 2D scatter plots Pos. corr. V1 V1 V1 V1 V2 V1 V2 V1 V2 V2 V2 Time
81 The encoding of value 2D scatter plots Pos. corr. Neg. corr. V1 V1 V1 V1 V2 V1 V2 V1 V2 V2 V2 Time
82 The encoding of value 2D scatter plots Pos. corr. Neg. corr. No corr. V1 V1 V1 V1 V2 V1 V2 V1 V2 V2 V2 Time
83 The encoding of value 2D scatter plots Pos. corr. Neg. corr. No corr. V1 V1 V1 V1 V2 V1 V2 V1 V2 V2 V2 Time Cluster
84 The encoding of value 2D scatter plots Pos. corr. Neg. corr. No corr. V1 V1 V1 V1 V2 V1 V2 V1 V2 V2 Cluster Outlier V2 Time
85 The encoding of value 2D scatter plots Pos. corr. Neg. corr. No corr. V1 V1 V1 V1 V2 V1 V2 V1 V2 V2 Cluster Outlier Time V2 Time
86 The encoding of value 2D scatter plots Pos. corr. Neg. corr. No corr. V1 V1 V1 V1 V2 V1 V2 V1 V2 V2 Cluster Outlier Time V2 Time


87 The encoding of value Scatter plots of ND-data Variable1 Variable 2 Variable 3 Variable 4 X-axis Y-axis Size Colour
88 The encoding of value Scatter plot matrix

89 Table Lens MPG Horsepower Weight Acceleration Cylinders Year
90 Table Lens MPG Horsepower Weight Acceleration Cylinders Year
91 Mosaic plot Titanic
92 Mosaic plot 1st 2nd 3rd Crew
93 Mosaic plot 1st 2nd 3rd Crew Child Adult
94 Mosaic plot 1st 2nd 3rd Crew Child! Adult Female / Male

95 visadapt.info

96 Stacked area chart

97 Stacked area chart

98 Theme river

99 Theme river

100 3D Representations Use 3D wisely More dimensions do not mean that more information is simultaneously displayed

101 3D Representations Use 3D wisely More dimensions do not mean that more information is simultaneously displayed

102 3D Representations Use 3D wisely More dimensions do not mean that more information is simultaneously displayed

103 The encoding of value Glyphs and icons
104 Presentation

105 Overview + detail Focus+context Micro / macro readings No information is hidden

106 Overview + detail

107 Overview + detail

108 Overview + detail

109 Distortion Perspective wall
110 Distortion

111 Distortion MPG Horsepower Weight Acceleration Cylinders Year

112 Distortion MPG Horsepower Weight Acceleration Cylinders Year
113 Interaction

114 Interaction techniques Brushing A collection of techniques to dynamically query and directly select elements in visual representations
115 Interaction techniques Weight Details on demand Price
116 Interaction techniques Weight Model = Saab Boot = large Cylinders = 4 Details on demand Price


117 Interaction techniques Coordinated and multiple views (CMV An action in one view is immediately propagated to all other views
118 Analysis of (very) Large Data
")

119 Analysis of (very) Large Data
120 Data Mining 62
121 Data Mining Having an (enormous) amount of data Wonder what it can tell us Isolate (unexpected) relationships (Hopefully) find some which are - Interesting - Novel Informative 62
122 Data Mining: Extraction of interesting (non-trivial, previously unknown and potentially useful) information or patterns from data in ((very) large) databases 63
123 Data Mining and Visualization 64
124 Data Mining and Visualization Data mining provides complex representations 64
125 Data Mining and Visualization Data mining provides complex representations Fits (optimizes) them to the data 64
126 Data Mining and Visualization Data mining provides complex representations Fits (optimizes) them to the data Then visualize the data mining results. 64
127 Data Mining and Visualization Data mining provides complex representations Fits (optimizes) them to the data Then visualize the data mining results. 64
128 Data Mining and Visualization Data mining provides complex representations Fits (optimizes) them to the data Then visualize the data mining results. 64
129 DM for Vis 65
130 DM for Vis Modelling, Patterns and Rules are valid filters for mapping 65
131 DM for Vis Modelling, Patterns and Rules are valid filters for mapping Simplification of data - modelling 65
132 DM for Vis Modelling, Patterns and Rules are valid filters for mapping Simplification of data - modelling Extraction of interesting features: Patterns, Rules 65
133 DM for Vis Modelling, Patterns and Rules are valid filters for mapping Simplification of data - modelling Extraction of interesting features: Patterns, Rules Form valid representations for data features 65
134 Problems with Data Holes - Missing data values Errors and estimates Income of *exactly* ? Sample inconsistencies e.g. medical records with different numbers of readings for the same person 66

135 Sampling Take K items to be a representative set of M items Data abstraction Many ways of doing this Random Systematic Density-based 67
136 Cluster Analysis Cluster: a collection of data items Similar to one another within the same cluster Different from the items in other clusters Cluster analysis Grouping sets of data items into clusters Data abstraction Automatically 68
137 Major clustering approaches There are a number of approaches We will consider just one K-Means algorithm: Given a value k, find a partition of k clusters that minimizes the total intracluster variance 69
138 K-means, example with K=3 70
139 K-means, example with K=3 71
140 K-means, example with K=3 72
141 K-means, example with K=3 73
142 K-means, example with K=3 73
143 K-means, example with K=3 73
144 K-means, example with K=3 73
145 K-means, example with K=3 73
146 K-means, example with K=3 74
147 K-means, example with K=3 75
148 K-means, example with K=3 75
149 K-means, example with K=3 75
150 76
Visualization? Information Visualization. Information Visualization? Ceci n est pas une visualization! So why two disciplines? So why two disciplines?
 Visualization? New Oxford Dictionary of English, 1999 Information Visualization Matt Cooper visualize - verb [with obj.] 1. form a mental image of; imagine: it is not easy to visualize the future. 2. make
3. Visual Analytics (Part 1: Visual Encoding) Jacobs University Visualization and Computer Graphics Lab
 Jacobs University Visualization and Computer Graphics Lab") 3. Visual Analytics (Part 1: Visual Encoding) 3.1 Introduction Motivation Big Data cannot be analyzed anymore without the help of computers. Computers are good in quickly processing large amounts of data.
3. Visual Analytics (Part 1: Visual Encoding) 3.1 Introduction Motivation Big Data cannot be analyzed anymore without the help of computers. Computers are good in quickly processing large amounts of data.
Information Visualization
 Information Visualization Text: Information visualization, Robert Spence, Addison-Wesley, 2001 What Visualization? Process of making a computer image or graph for giving an insight on data/information
3. Multidimensional Information Visualization I Concepts for visualizing univariate to hypervariate data
 3. Multidimensional Information Visualization I Concepts for visualizing univariate to hypervariate data Vorlesung Informationsvisualisierung Prof. Dr. Andreas Butz, WS 2011/12 Konzept und Basis für n:
Visual Encoding Design
 CSE 442 - Data Visualization Visual Encoding Design Jeffrey Heer University of Washington Review: Expressiveness & Effectiveness / APT Choosing Visual Encodings Assume k visual encodings and n data attributes.
Multivariate Data More Overview
 Multivariate Data More Overview CS 4460 - Information Visualization Jim Foley Last Revision August 2016 Some Key Concepts Quick Review Data Types Data Marks Basic Data Types N-Nominal (categorical) Equal
Glyphs. Presentation Overview. What is a Glyph!? Cont. What is a Glyph!? Glyph Fundamentals. Goal of Paper. Presented by Bertrand Low
 Presentation Overview Glyphs Presented by Bertrand Low A Taxonomy of Glyph Placement Strategies for Multidimensional Data Visualization Matthew O. Ward, Information Visualization Journal, Palmgrave,, Volume
Multivariate Data & Tables and Graphs. Agenda. Data and its characteristics Tables and graphs Design principles
 Topic Notes Multivariate Data & Tables and Graphs CS 7450 - Information Visualization Aug. 27, 2012 John Stasko Agenda Data and its characteristics Tables and graphs Design principles Fall 2012 CS 7450
Visual Encoding Design
 CSE 442 - Data Visualization Visual Encoding Design Jeffrey Heer University of Washington Last Time: Data & Image Models The Big Picture task questions, goals assumptions data physical data type conceptual
Chapter 2: Understanding Data Distributions with Tables and Graphs
 Test Bank Chapter 2: Understanding Data with Tables and Graphs Multiple Choice 1. Which of the following would best depict nominal level data? a. pie chart b. line graph c. histogram d. polygon Ans: A
The basic arrangement of numeric data is called an ARRAY. Array is the derived data from fundamental data Example :- To store marks of 50 student
 Organizing data Learning Outcome 1. make an array 2. divide the array into class intervals 3. describe the characteristics of a table 4. construct a frequency distribution table 5. constructing a composite
Visual Computing. Lecture 2 Visualization, Data, and Process
 Visual Computing Lecture 2 Visualization, Data, and Process Pipeline 1 High Level Visualization Process 1. 2. 3. 4. 5. Data Modeling Data Selection Data to Visual Mappings Scene Parameter Settings (View
Visualisation : Lecture 1. So what is visualisation? Visualisation
 So what is visualisation? UG4 / M.Sc. Course 2006 toby.breckon@ed.ac.uk Computer Vision Lab. Institute for Perception, Action & Behaviour Introducing 1 Application of interactive 3D computer graphics to
WELCOME! Lecture 3 Thommy Perlinger
 Quantitative Methods II WELCOME! Lecture 3 Thommy Perlinger Program Lecture 3 Cleaning and transforming data Graphical examination of the data Missing Values Graphical examination of the data It is important
Perception Maneesh Agrawala CS : Visualization Fall 2013 Multidimensional Visualization
 Perception Maneesh Agrawala CS 294-10: Visualization Fall 2013 Multidimensional Visualization 1 Visual Encoding Variables Position Length Area Volume Value Texture Color Orientation Shape ~8 dimensions?
Multivariate Data & Tables and Graphs
 Multivariate Data & Tables and Graphs CS 4460/7450 - Information Visualization Jan. 13, 2009 John Stasko Agenda Data and its characteristics Tables and graphs Design principles Spring 2009 CS 4460/7450
Statistical Package for the Social Sciences INTRODUCTION TO SPSS SPSS for Windows Version 16.0: Its first version in 1968 In 1975.
 Statistical Package for the Social Sciences INTRODUCTION TO SPSS SPSS for Windows Version 16.0: Its first version in 1968 In 1975. SPSS Statistics were designed INTRODUCTION TO SPSS Objective About the
Multivariate Data & Tables and Graphs. Agenda. Data and its characteristics Tables and graphs Design principles
 Multivariate Data & Tables and Graphs CS 7450 - Information Visualization Aug. 24, 2015 John Stasko Agenda Data and its characteristics Tables and graphs Design principles Fall 2015 CS 7450 2 1 Data Data
Statistical graphics in analysis Multivariable data in PCP & scatter plot matrix. Paula Ahonen-Rainio Maa Visual Analysis in GIS
 Statistical graphics in analysis Multivariable data in PCP & scatter plot matrix Paula Ahonen-Rainio Maa-123.3530 Visual Analysis in GIS 11.11.2015 Topics today YOUR REPORTS OF A-2 Thematic maps with charts
CS 4460 Intro. to Information Visualization Sep. 18, 2017 John Stasko
 Multivariate Visual Representations 1 CS 4460 Intro. to Information Visualization Sep. 18, 2017 John Stasko Learning Objectives For the following visualization techniques/systems, be able to describe each
Exploratory Data Analysis EDA
 Exploratory Data Analysis EDA Luc Anselin http://spatial.uchicago.edu 1 from EDA to ESDA dynamic graphics primer on multivariate EDA interpretation and limitations 2 From EDA to ESDA 3 Exploratory Data
Multiple Dimensional Visualization
 Multiple Dimensional Visualization Dimension 1 dimensional data Given price information of 200 or more houses, please find ways to visualization this dataset 2-Dimensional Dataset I also know the distances
HYPERVARIATE DATA VISUALIZATION
 HYPERVARIATE DATA VISUALIZATION Prof. Rahul C. Basole CS/MGT 8803-DV > January 25, 2017 Agenda Hypervariate Data Project Elevator Pitch Hypervariate Data (n > 3) Many well-known visualization techniques
Data Mining Chapter 3: Visualizing and Exploring Data Fall 2011 Ming Li Department of Computer Science and Technology Nanjing University
 Data Mining Chapter 3: Visualizing and Exploring Data Fall 2011 Ming Li Department of Computer Science and Technology Nanjing University Exploratory data analysis tasks Examine the data, in search of structures
Acquisition Description Exploration Examination Understanding what data is collected. Characterizing properties of data.
 Summary Statistics Acquisition Description Exploration Examination what data is collected Characterizing properties of data. Exploring the data distribution(s). Identifying data quality problems. Selecting
Visual Analytics. Visualizing multivariate data:
 Visual Analytics 1 Visualizing multivariate data: High density time-series plots Scatterplot matrices Parallel coordinate plots Temporal and spectral correlation plots Box plots Wavelets Radar and /or
ay/bi199: methods of computational science visualization jumpstart+tools+techniques santiago v lombeyda center for advanced computing research caltech
 ay/bi199: methods of computational science visualization jumpstart+tools+techniques santiago v lombeyda center for advanced computing research caltech analytical answers new questions data questions visual
Introduction to Visualisation
 Introduction to Visualisation VU Visual Data Science Johanna Schmidt WS 2018/19 2 Definition Visualisation enables insight into data Visual information for humans Easier to interpret Allows faster analysis
DSC 201: Data Analysis & Visualization
 DSC 201: Data Analysis & Visualization Exploratory Data Analysis Dr. David Koop What is Exploratory Data Analysis? "Detective work" to summarize and explore datasets Includes: - Data acquisition and input
Multidimensional (Multivariate)
") Multidimensional (Multivariate) Data Visualization IV Course Spring 14 Graduate Course of UCAS May 9th, 2014 1 Data by Dimensionality 1-D (Linear, Set and Sequences) SeeSoft, Info Mural 2-D (Map) GIS,
Multidimensional (Multivariate) Data Visualization IV Course Spring 14 Graduate Course of UCAS May 9th, 2014 1 Data by Dimensionality 1-D (Linear, Set and Sequences) SeeSoft, Info Mural 2-D (Map) GIS,
Data can be in the form of numbers, words, measurements, observations or even just descriptions of things.
 + What is Data? Data is a collection of facts. Data can be in the form of numbers, words, measurements, observations or even just descriptions of things. In most cases, data needs to be interpreted and
Multi-Dimensional Vis
 CSE512 :: 21 Jan 2014 Multi-Dimensional Vis Jeffrey Heer University of Washington 1 Last Time: Exploratory Data Analysis 2 Exposure, the effective laying open of the data to display the unanticipated,
Introduction to Geospatial Analysis
 Introduction to Geospatial Analysis Introduction to Geospatial Analysis 1 Descriptive Statistics Descriptive statistics. 2 What and Why? Descriptive Statistics Quantitative description of data Why? Allow
Scientific Visualization
 Scientific Visualization Topics Motivation Color InfoVis vs. SciVis VisTrails Core Techniques Advanced Techniques 1 Check Assumptions: Why Visualize? Problem: How do you apprehend 100k tuples? when your
Information Visualization - Introduction
 Information Visualization - Introduction Institute of Computer Graphics and Algorithms Information Visualization The use of computer-supported, interactive, visual representations of abstract data to amplify
Geometric Techniques. Part 1. Example: Scatter Plot. Basic Idea: Scatterplots. Basic Idea. House data: Price and Number of bedrooms
 Part 1 Geometric Techniques Scatterplots, Parallel Coordinates,... Geometric Techniques Basic Idea Visualization of Geometric Transformations and Projections of the Data Scatterplots [Cleveland 1993] Parallel
Bar Charts and Frequency Distributions
 Bar Charts and Frequency Distributions Use to display the distribution of categorical (nominal or ordinal) variables. For the continuous (numeric) variables, see the page Histograms, Descriptive Stats
Visualization as an Analysis Tool: Presentation Supplement
 Visualization as an Analysis Tool: Presentation Supplement This document is a supplement to the presentation Visualization as an Analysis Tool given by Phil Groce and Jeff Janies on January 9, 2008 as
Knowledge Discovery and Data Mining I
 Ludwig-Maximilians-Universität München Lehrstuhl für Datenbanksysteme und Data Mining Prof. Dr. Thomas Seidl Knowledge Discovery and Data Mining I Winter Semester 8/9 Agenda. Introduction. Basics. Data
CP SC 8810 Data Visualization. Joshua Levine
 CP SC 8810 Data Visualization Joshua Levine levinej@clemson.edu Lecture 15 Text and Sets Oct. 14, 2014 Agenda Lab 02 Grades! Lab 03 due in 1 week Lab 2 Summary Preferences on x-axis label separation 10
At the end of the chapter, you will learn to: Present data in textual form. Construct different types of table and graphs
 DATA PRESENTATION At the end of the chapter, you will learn to: Present data in textual form Construct different types of table and graphs Identify the characteristics of a good table and graph Identify
Visualisierung W, VU, 2.0h, 3.0EC
 Visualisierung 1 2014W, VU, 2.0h, 3.0EC 186.827 Eduard Gröller Johanna Schmidt Oana Moraru Institute of Computer Graphics and Algorithms (ICGA), VUT Austria Visualization Examples VolVis InfoVis FlowVis
Introduction to Minitab 1
 Introduction to Minitab 1 We begin by first starting Minitab. You may choose to either 1. click on the Minitab icon in the corner of your screen 2. go to the lower left and hit Start, then from All Programs,
Section 2-2 Frequency Distributions. Copyright 2010, 2007, 2004 Pearson Education, Inc
 Section 2-2 Frequency Distributions Copyright 2010, 2007, 2004 Pearson Education, Inc. 2.1-1 Frequency Distribution Frequency Distribution (or Frequency Table) It shows how a data set is partitioned among
Data Analysis More Than Two Variables: Graphical Multivariate Analysis
 Data Analysis More Than Two Variables: Graphical Multivariate Analysis Prof. Dr. Jose Fernando Rodrigues Junior ICMC-USP 1 What is it about? More than two variables determine a tough analytical problem
Lecture Slides. Elementary Statistics Twelfth Edition. by Mario F. Triola. and the Triola Statistics Series. Section 2.1- #
 Lecture Slides Elementary Statistics Twelfth Edition and the Triola Statistics Series by Mario F. Triola Chapter 2 Summarizing and Graphing Data 2-1 Review and Preview 2-2 Frequency Distributions 2-3 Histograms
Information Visualisation
 Information Visualisation Computer Animation and Visualisation Lecture 18 Taku Komura tkomura@ed.ac.uk Institute for Perception, Action & Behaviour School of Informatics 1 Overview Information Visualisation
Lecture Slides. Elementary Statistics Tenth Edition. by Mario F. Triola. and the Triola Statistics Series. Slide 1
 Lecture Slides Elementary Statistics Tenth Edition and the Triola Statistics Series by Mario F. Triola Slide 1 Chapter 2 Summarizing and Graphing Data 2-1 Overview 2-2 Frequency Distributions 2-3 Histograms
Select Cases. Select Cases GRAPHS. The Select Cases command excludes from further. selection criteria. Select Use filter variables
 Select Cases GRAPHS The Select Cases command excludes from further analysis all those cases that do not meet specified selection criteria. Select Cases For a subset of the datafile, use Select Cases. In
Data Visualization. Fall 2016
 Data Visualization Fall 2016 Information Visualization Upon now, we dealt with scientific visualization (scivis) Scivisincludes visualization of physical simulations, engineering, medical imaging, Earth
Information Visualization. SWE 432, Fall 2016 Design and Implementation of Software for the Web
 Information Visualization SWE 432, Fall 2016 Design and Implementation of Software for the Web Today What types of information visualization are there? Which one should you choose? What does usability
Brief Guide on Using SPSS 10.0
 Brief Guide on Using SPSS 10.0 (Use student data, 22 cases, studentp.dat in Dr. Chang s Data Directory Page) (Page address: http://www.cis.ysu.edu/~chang/stat/) I. Processing File and Data To open a new
visualizing q uantitative quantitative information information
 visualizing quantitative information visualizing quantitative information martin krzywinski outline best practices of graphical data design data-to-ink ratio cartjunk circos the visual display of quantitative
Statistical Methods. Instructor: Lingsong Zhang. Any questions, ask me during the office hour, or me, I will answer promptly.
 Statistical Methods Instructor: Lingsong Zhang 1 Issues before Class Statistical Methods Lingsong Zhang Office: Math 544 Email: lingsong@purdue.edu Phone: 765-494-7913 Office Hour: Monday 1:00 pm - 2:00
TDWI strives to provide course books that are contentrich and that serve as useful reference documents after a class has ended.
 Previews of TDWI course books offer an opportunity to see the quality of our material and help you to select the courses that best fit your needs. The previews cannot be printed. TDWI strives to provide
Making Science Graphs and Interpreting Data
 Making Science Graphs and Interpreting Data Eye Opener: 5 mins What do you see? What do you think? Look up terms you don t know What do Graphs Tell You? A graph is a way of expressing a relationship between
Representation: Design Idioms 1
 IAT 814 Visualization Representation: Design Idioms 1 Lyn Bartram These slides borrow heavily from T. Munzner and S. Few, and may be incompletely attributed. Work in progress. Recall: Data Abstractions
Your Name: Section: INTRODUCTION TO STATISTICAL REASONING Computer Lab #4 Scatterplots and Regression
 Your Name: Section: 36-201 INTRODUCTION TO STATISTICAL REASONING Computer Lab #4 Scatterplots and Regression Objectives: 1. To learn how to interpret scatterplots. Specifically you will investigate, using
DSC 201: Data Analysis & Visualization
 DSC 201: Data Analysis & Visualization Visualization Design Dr. David Koop Definition Computer-based visualization systems provide visual representations of datasets designed to help people carry out tasks
SOCIAL MEDIA MINING. Data Mining Essentials
 SOCIAL MEDIA MINING Data Mining Essentials Dear instructors/users of these slides: Please feel free to include these slides in your own material, or modify them as you see fit. If you decide to incorporate
MHPE 494: Data Analysis. Welcome! The Analytic Process
 MHPE 494: Data Analysis Alan Schwartz, PhD Department of Medical Education Memoona Hasnain,, MD, PhD, MHPE Department of Family Medicine College of Medicine University of Illinois at Chicago Welcome! Your
PATTERN CLASSIFICATION AND SCENE ANALYSIS
 PATTERN CLASSIFICATION AND SCENE ANALYSIS RICHARD O. DUDA PETER E. HART Stanford Research Institute, Menlo Park, California A WILEY-INTERSCIENCE PUBLICATION JOHN WILEY & SONS New York Chichester Brisbane
Data Mining: Exploring Data. Lecture Notes for Chapter 3
 Data Mining: Exploring Data Lecture Notes for Chapter 3 1 What is data exploration? A preliminary exploration of the data to better understand its characteristics. Key motivations of data exploration include
Quality Metrics for Visual Analytics of High-Dimensional Data
 Quality Metrics for Visual Analytics of High-Dimensional Data Daniel A. Keim Data Analysis and Information Visualization Group University of Konstanz, Germany Workshop on Visual Analytics and Information
University of Florida CISE department Gator Engineering. Visualization
 Visualization Dr. Sanjay Ranka Professor Computer and Information Science and Engineering University of Florida What is visualization? Visualization is the process of converting data (information) in to
Enhancing the visualization of mixed multidimensional data in Parallel Coordinates
 Enhancing the visualization of mixed multidimensional data in Parallel Coordinates Raphaël Tuor 1 Supervisors: Prof. Dr. Denis Lalanne 2 Dr. Florian Evéquoz 3 December 14, 2016 Department of Informatics
Trellis Displays. Definition. Example. Trellising: Which plot is best? Historical Development. Technical Definition
 Trellis Displays The curse of dimensionality as described by Huber [6] is not restricted to mathematical statistical problems, but can be found in graphicbased data analysis as well. Most plots like histograms
CS Information Visualization Sep. 2, 2015 John Stasko
 Multivariate Visual Representations 2 CS 7450 - Information Visualization Sep. 2, 2015 John Stasko Recap We examined a number of techniques for projecting >2 variables (modest number of dimensions) down
CSE Data Visualization. Multidimensional Vis. Jeffrey Heer University of Washington
 CSE 512 - Data Visualization Multidimensional Vis Jeffrey Heer University of Washington Last Time: Exploratory Data Analysis Exposure, the effective laying open of the data to display the unanticipated,
CSE Data Visualization. Multidimensional Vis. Jeffrey Heer University of Washington
 CSE 512 - Data Visualization Multidimensional Vis Jeffrey Heer University of Washington Last Time: Exploratory Data Analysis Exposure, the effective laying open of the data to display the unanticipated,
Interactive Math Glossary Terms and Definitions
 Terms and Definitions Absolute Value the magnitude of a number, or the distance from 0 on a real number line Addend any number or quantity being added addend + addend = sum Additive Property of Area the
Data Mining: Exploring Data. Lecture Notes for Chapter 3. Introduction to Data Mining
 Data Mining: Exploring Data Lecture Notes for Chapter 3 Introduction to Data Mining by Tan, Steinbach, Kumar What is data exploration? A preliminary exploration of the data to better understand its characteristics.
Data Mining: Exploring Data. Lecture Notes for Chapter 3
 Data Mining: Exploring Data Lecture Notes for Chapter 3 Slides by Tan, Steinbach, Kumar adapted by Michael Hahsler Look for accompanying R code on the course web site. Topics Exploratory Data Analysis
Data Mining: Exploring Data. Lecture Notes for Data Exploration Chapter. Introduction to Data Mining
 Data Mining: Exploring Data Lecture Notes for Data Exploration Chapter Introduction to Data Mining by Tan, Steinbach, Karpatne, Kumar 02/03/2018 Introduction to Data Mining 1 What is data exploration?
Information Visualization. Jing Yang Spring Multi-dimensional Visualization (1)
") Information Visualization Jing Yang Spring 2008 1 Multi-dimensional Visualization (1) 2 1 Multi-dimensional (Multivariate) Dataset 3 Data Item (Object, Record, Case) 4 2 Dimension (Variable, Attribute)
Information Visualization Jing Yang Spring 2008 1 Multi-dimensional Visualization (1) 2 1 Multi-dimensional (Multivariate) Dataset 3 Data Item (Object, Record, Case) 4 2 Dimension (Variable, Attribute)
MODELS AND FRAMEWORKS. Information Visualization Fall 2009 Jinwook Seo SNU CSE
 MODELS AND FRAMEWORKS Information Visualization Fall 2009 Jinwook Seo SNU CSE Wednesday Prof. Hee-Joon Bae, Seoul National University Bundang Hostpital blood pressure and END (early neurologic deterioration)
Visualization Stages, Sensory vs. Arbitrary symbols, Data Characteristics, Visualization Goals. Trajectory Reminder
 Visualization Stages, Sensory vs. Arbitrary symbols, Data Characteristics, Visualization Goals Russell M. Taylor II Slide 1 Trajectory Reminder Where we ve been recently Seen nm system that displays 2D-in-3D
Volume Illumination & Vector Field Visualisation
 Volume Illumination & Vector Field Visualisation Visualisation Lecture 11 Institute for Perception, Action & Behaviour School of Informatics Volume Illumination & Vector Vis. 1 Previously : Volume Rendering
NOTES TO CONSIDER BEFORE ATTEMPTING EX 1A TYPES OF DATA
 NOTES TO CONSIDER BEFORE ATTEMPTING EX 1A TYPES OF DATA Statistics is concerned with scientific methods of collecting, recording, organising, summarising, presenting and analysing data from which future
ECLT 5810 Data Preprocessing. Prof. Wai Lam
 ECLT 5810 Data Preprocessing Prof. Wai Lam Why Data Preprocessing? Data in the real world is imperfect incomplete: lacking attribute values, lacking certain attributes of interest, or containing only aggregate
round decimals to the nearest decimal place and order negative numbers in context
 6 Numbers and the number system understand and use proportionality use the equivalence of fractions, decimals and percentages to compare proportions use understanding of place value to multiply and divide
MATH 117 Statistical Methods for Management I Chapter Two
 Jubail University College MATH 117 Statistical Methods for Management I Chapter Two There are a wide variety of ways to summarize, organize, and present data: I. Tables 1. Distribution Table (Categorical
SAS Visual Analytics 8.2: Working with Report Content
 SAS Visual Analytics 8.2: Working with Report Content About Objects After selecting your data source and data items, add one or more objects to display the results. SAS Visual Analytics provides objects
Chapter 2: The Normal Distribution
 Chapter 2: The Normal Distribution 2.1 Density Curves and the Normal Distributions 2.2 Standard Normal Calculations 1 2 Histogram for Strength of Yarn Bobbins 15.60 16.10 16.60 17.10 17.60 18.10 18.60
Representation. (R. Spence, 2007)
") Representation (R. Spence, 2007) InfoVis, Universidade de Aveiro Beatriz Sousa Santos Data and gain insight We look at that picture Ah HA!! Information visualization The process of information visualization:
Representation (R. Spence, 2007) InfoVis, Universidade de Aveiro Beatriz Sousa Santos Data and gain insight We look at that picture Ah HA!! Information visualization The process of information visualization:
Summarising Data. Mark Lunt 09/10/2018. Arthritis Research UK Epidemiology Unit University of Manchester
 Summarising Data Mark Lunt Arthritis Research UK Epidemiology Unit University of Manchester 09/10/2018 Summarising Data Today we will consider Different types of data Appropriate ways to summarise these
Parallel Coordinates CS 6630 Scientific Visualization
 Parallel Coordinates CS 6630 Scientific Visualization Yang Shen u0879466 Jason Davies Example Jason s parallel coordinates is fairly effective when it comes to interaction. I like the way creating filter
Data Preprocessing. Why Data Preprocessing? MIT-652 Data Mining Applications. Chapter 3: Data Preprocessing. Multi-Dimensional Measure of Data Quality
 Why Data Preprocessing? Data in the real world is dirty incomplete: lacking attribute values, lacking certain attributes of interest, or containing only aggregate data e.g., occupation = noisy: containing
M7D1.a: Formulate questions and collect data from a census of at least 30 objects and from samples of varying sizes.
 M7D1.a: Formulate questions and collect data from a census of at least 30 objects and from samples of varying sizes. Population: Census: Biased: Sample: The entire group of objects or individuals considered
Part I, Chapters 4 & 5. Data Tables and Data Analysis Statistics and Figures
 Part I, Chapters 4 & 5 Data Tables and Data Analysis Statistics and Figures Descriptive Statistics 1 Are data points clumped? (order variable / exp. variable) Concentrated around one value? Concentrated
1. Data Analysis Yields Numbers & Visualizations. 2. Why Visualize Data? 3. What do Visualizations do? 4. Research on Visualizations
 Data Analysis & Business Intelligence Made Easy with Excel Power Tools Excel Data Analysis Basics = E-DAB Notes for Video: E-DAB-05- Visualizations: Table, Charts, Conditional Formatting & Dashboards Outcomes
Information Visualization in Data Mining. S.T. Balke Department of Chemical Engineering and Applied Chemistry University of Toronto
 Information Visualization in Data Mining S.T. Balke Department of Chemical Engineering and Applied Chemistry University of Toronto Motivation Data visualization relies primarily on human cognition for
GRAPHING BAYOUSIDE CLASSROOM DATA
 LUMCON S BAYOUSIDE CLASSROOM GRAPHING BAYOUSIDE CLASSROOM DATA Focus/Overview This activity allows students to answer questions about their environment using data collected during water sampling. Learning
This chapter will show how to organize data and then construct appropriate graphs to represent the data in a concise, easy-to-understand form.
 CHAPTER 2 Frequency Distributions and Graphs Objectives Organize data using frequency distributions. Represent data in frequency distributions graphically using histograms, frequency polygons, and ogives.
EnSight 10 Basic Training Exercises
 Exercise 1: Color the Comanche helicopter EnSight 10 Basic Training Exercises 1. Start EnSight 10 and press the Cancel button on the Welcome screen 2. Click on File -> Open and select the Simple Interface
We will start at 2:05 pm! Thanks for coming early!
 We will start at 2:05 pm! Thanks for coming early! Yesterday Fundamental 1. Value of visualization 2. Design principles 3. Graphical perception Record Information Support Analytical Reasoning Communicate
Prentice Hall Mathematics: Course Correlated to: Massachusetts State Learning Standards Curriculum Frameworks (Grades 7-8)
") Massachusetts State Learning Standards Curriculum Frameworks (Grades 7-8) NUMBER SENSE AND OPERATIONS 8.N.1 8.N.2 8.N.3 8.N.4 8.N.5 8.N.6 8.N.7 8.N.8 Compare, order, estimate, and translate among integers,
Massachusetts State Learning Standards Curriculum Frameworks (Grades 7-8) NUMBER SENSE AND OPERATIONS 8.N.1 8.N.2 8.N.3 8.N.4 8.N.5 8.N.6 8.N.7 8.N.8 Compare, order, estimate, and translate among integers,
Knowledge Discovery and Data Mining
 Knowledge Discovery and Data Mining Unit # 2 Sajjad Haider Spring 2010 1 Structured vs. Non-Structured Data Most business databases contain structured data consisting of well-defined fields with numeric
Chapter 2 - Graphical Summaries of Data
 Chapter 2 - Graphical Summaries of Data Data recorded in the sequence in which they are collected and before they are processed or ranked are called raw data. Raw data is often difficult to make sense
Chapter 5: The beast of bias
 Chapter 5: The beast of bias Self-test answers SELF-TEST Compute the mean and sum of squared error for the new data set. First we need to compute the mean: + 3 + + 3 + 2 5 9 5 3. Then the sum of squared