Core dumped - on debuggers and other tools
|
|
|
- Jordan George
- 5 years ago
- Views:
Transcription
1 Pascal M. Vaudrevange
2
3
4 Motto Everyone knows that debugging is twice as hard as writing a program in the first place. So if you re as clever as you can be when you write it, how will you ever debug it? Brian Kernighan, The Elements of Programming Style, 2nd edition, chapter 2
5 Makefile CC=g++ CCOPTS=-O0 -g -W -Wall -Wunused -std=c++98 -pedantic #CCOPTS=-O2 -W -Wall -Wunused -std=c++98 FILES=test.o %.o: %.cpp test.h $(CC) $(CCOPTS) -c test: $(FILES) $(CC) $(CCOPTS) $(FILES) -o test clean: rm -f * *.o core
6 Makefile CC=g++ CCOPTS=-O0 -g -W -Wall -Wunused -std=c++98 -pedantic #CCOPTS=-O2 -W -Wall -Wunused -std=c++98 FILES=test.o %.o: %.cpp test.h $(CC) $(CCOPTS) -c test: $(FILES) $(CC) $(CCOPTS) $(FILES) -o test clean: rm -f * *.o core TABS!
7 Compiler Options Option -Wall -Wextra -Wunused -pedantic -std=c++98 Effect warn about questionable constructs warn about even more events (no return value for a function etc) unused variables disallow extensions that affect portability -g generate debugging information -O0 do not optimize -O2 optimize different options for different vendors/ languages, e.g. gfortran, icc, ifort auto-parallelization for openmp in intel-compilers -parallel -openmp
8 Sample Program #include<cstdlib> #define NUM 10 int mess_things_up(int * values){ int * tmp; int i; for(i=0; i<num; i++){ tmp[i]=*values[i]; int main(){ int i, j; int * values; int result result=mess_things_up(&values); return 0;
9 Compiling /projects/talks/cerca_mar_2008/source> make g++ -O0 -g -Wextra -Wall -Wunused -std=c++98 -pedantic -c test.cpp test.cpp: In function int main(): test.cpp:14: warning: unused variable i test.cpp:14: warning: unused variable j test.cpp: In function int mess_things_up(int*): test.cpp:11: warning: control reaches end of non-void function g++ -O0 -g -Wextra -Wall -Wunused -std=c++98 -pedantic test.o -o test pascal@octonion: /projects/talks/cerca_mar_2008/source>
10 Repair warnings #include<cstdlib> #define NUM 10 int mess_things_up(int * values){ int * tmp; int i; for(i=0; i<num; i++){ tmp[i]=values[i]; int main(){ int i, j; int * values; int result; result=mess_things_up(values); return 0;
11 Repair warnings #include<cstdlib> #define NUM 10 int mess_things_up(int * values){ int * tmp; int i; for(i=0; i<num; i++){ tmp[i]=values[i]; return 0; int main(){ int * values; int result; result=mess_things_up(values); return 0;
12 Compiling no more warnings: /projects/talks/cerca_mar_2008/source> make g++ -O0 -g -Wextra -Wall -Wunused -std=c++98 -pedantic -c test.cpp g++ -O0 -g -Wextra -Wall -Wunused -std=c++98 -pedantic test.o -o test /projects/talks/cerca_mar_2008/source> but /projects/talks/cerca_mar_2008/source>./test Segmentation fault (core dumped) /projects/talks/cerca_mar_2008/source>
13 My First Debugger Session /projects/talks/cerca_mar_2008/source> gdb -q --dbx./test Using host libthread_db library "/lib/libthread_db.so.1". (gdb) run Starting program: /home/pascal/projects/talks/cerca_mar_2008/source/test Program received signal SIGSEGV, Segmentation fault. 0x in mess_things_up (values=0x7fff3770dcf0) at test.cpp:9 9 tmp[i]=values[i]; (gdb) p i $1 = 0 (gdb) p tmp[i] Cannot access memory at address 0x0 (gdb)
14 Missing malloc() #include<cstdlib> #define NUM 10 int mess_things_up(int * values){ int * tmp; int i; for(i=0; i<num; i++){ tmp[i]=values[i]; return 0; int main(){ int * values; int result; result=mess_things_up(values); return 0;
15 Missing malloc() #include<cstdlib> #define NUM 10 int mess_things_up(int * values){ int * tmp; int i; tmp = (int*) malloc(num*sizeof(int)); for(i=0; i<num; i++){ tmp[i]=values[i]; return 0; int main(){ int * values; int result; result=mess_things_up(values); return 0;
16 The world is good /projects/talks/cerca_mar_2008/source> make g++ -O0 -g -Wextra -Wall -Wunused -std=c++98 -pedantic -c test.cpp g++ -O0 -g -Wextra -Wall -Wunused -std=c++98 -pedantic test.o -o test /projects/talks/cerca_mar_2008/source>./test /projects/talks/cerca_mar_2008/source>
17 More uses for gdb /projects/talks/cerca_mar_2008/source> gdb -q --dbx./test Using host libthread_db library "/lib/libthread_db.so.1". (gdb) file test.cpp:main 10 tmp[i]=values[i]; return 0; int main(){ 16 int * values; 17 int result; result=mess_things_up(values); (gdb) stop in main Breakpoint 1 at 0x4005e6: file test.cpp, line 19. (gdb) run Starting program: /home/pascal/projects/talks/cerca_mar_2008/source/test Breakpoint 1, main () at test.cpp:19 19 result=mess_things_up(values); (gdb) s mess_things_up (values=0x7fff2051fb00) at test.cpp:8 8 tmp = (int*) malloc(num*sizeof(int)); (gdb) n 9 for(i=0; i<num; i++){ (gdb) n 10 tmp[i]=values[i];
18 (gdb) p i $1 = 0 (gdb) n 9 for(i=0; i<num; i++){ (gdb) n 10 tmp[i]=values[i]; (gdb) p i $2 = 1 (gdb) n 9 for(i=0; i<num; i++){ (gdb) set variable i = 10 (gdb) n 12 return 0; (gdb) status Num Type Disp Enb Address What 1 breakpoint keep y 0x e6 in main at test.cpp:19 breakpoint already hit 1 time (gdb) del 1 (gdb) status No breakpoints or watchpoints. (gdb)
19 gdb Command file <filename:function line> stop in func stop at <line> bt run <parameters> n s p <var> set variable <var> = <value> status del <num> attach <pid> watch Function load source file <filename> set breakpoint in functions set breakpoint in line <line> backtrace the call-stack next instruction next step print value of <var> set <var> to value <value> show breakpoints delete breakpoint <num> attach to running process <pid> set watchpoint
20 valgrind detect memory management and threading bugs very detailed profiling to help find bottlenecks used by Firefox, Battlefield 1942, ROOT, R,... available modes memcheck fine-grained memory checker cachegrind annotate every line with the number of instructions executed and cache misses callgrind get call counts and inclusive cost for each call helgrind spots potential race conditions massif how much heap memory is used
21 Memory leaks /projects/talks/cerca_mar_2008/source> valgrind -q --leak-check=full./test ==7154== Use of uninitialised value of size 8 ==7154== at 0x4005C8: mess_things_up(int*) (test.cpp:10) ==7154== by 0x4005EE: main (test.cpp:19) ==7154== ==7154== ==7154== 40 bytes in 1 blocks are definitely lost in loss record 1 of 1 ==7154== at 0x4C21C16: malloc (vg_replace_malloc.c:149) ==7154== by 0x40059D: mess_things_up(int*) (test.cpp:8) ==7154== by 0x4005EE: main (test.cpp:19) pascal@octonion: /projects/talks/cerca_mar_2008/source>
22 More missing malloc() and free() #include<cstdlib> #define NUM 10 int mess_things_up(int * values){ int * tmp; int i; tmp = (int*) malloc(num*sizeof(int)); for(i=0; i<num; i++){ tmp[i]=values[i]; free(tmp); return 0; int main(){ int * values; int result; values=(int*) malloc(num*sizeof(int)); result=mess_things_up(values); free(values); return 0;
23 No more bugs!? /projects/talks/cerca_mar_2008/source> make g++ -O0 -g -Wextra -Wall -Wunused -std=c++98 -pedantic -c test.cpp g++ -O0 -g -Wextra -Wall -Wunused -std=c++98 -pedantic test.o -o test /projects/talks/cerca_mar_2008/source> valgrind -q --leak-check=full./test /projects/talks/cerca_mar_2008/source> /projects/talks/cerca_mar_2008/source> vi Makefile /projects/talks/cerca_mar_2008/source> make clean && make rm -f * *.o core test g++ -O2 -W -Wextra -Wall -Wunused -std=c++98 -pedantic -c test.cpp test.cpp: In function int main(): test.cpp:19: warning: values is used uninitialized in this function g++ -O2 -W -Wextra -Wall -Wunused -std=c++98 -pedantic test.o -o test pascal@octonion: /projects/talks/cerca_mar_2008/source>
24 screen Screen key bindings, page 1 of 2. Command key: ˆA Literal ˆA: a break ˆB b license, removebuf = clear C lockscreen ˆX x reset Z colon : log H screen ˆC c copy ˆ[ [ login L select detach ˆD d meta a silence _ digraph ˆV monitor M split S displays * next ˆ@ ˆN sp n suspend ˆZ z dumptermcap. number N time ˆT t fit F only Q title A flow ˆF f other ˆA vbell ˆG focus ˆI pow_break B version v hardcopy h pow_detach D width W help? prev ˆH ˆP p ˆ? windows ˆW w history { quit \ wrap ˆR r info i readbuf < writebuf > kill K k redisplay ˆL l xoff ˆS s lastmsg ˆM m remove X xon ˆQ q [Press Space for next page; Return to end.]
25 strace /projects/talks/cerca_mar_2008/source> strace./test 2>&1 grep open open("/etc/ld.so.cache", O_RDONLY) = 3 open("/usr/lib/libstdc++.so.6", O_RDONLY) = 3 open("/lib/libm.so.6", O_RDONLY) = 3 open("/lib/libgcc_s.so.1", O_RDONLY) = 3 open("/lib/libc.so.6", O_RDONLY) = 3 pascal@octonion: /projects/talks/cerca_mar_2008/source>
26 Other thoughts regular expressions with grep, awk, bash ( Pete) write short functions! vi and screen emacs and etags IDEs (Eclipse) versioning systems (CVS, Subversion, git) the right language for the job (C, Fortran, Perl, Python, Matlab) command line parameters ini-files libraries strip
27 Wise words from Turing award winners The competent programmer is fully aware of the strictly limited size of his own skull; therefore he approaches the programming task in full humility, and among other things he avoids clever tricks like the plague. Edsger Dijkstra (introduced RPN to computer science)
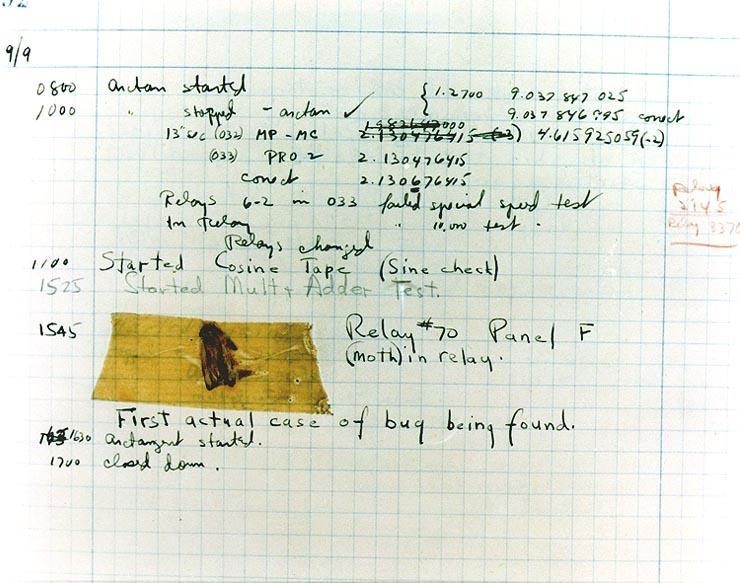
28 Wise words from Turing award winners As soon as we started programming, we found to our surprise that it wasn t as easy to get programs right as we had thought. Debugging had to be discovered. I can remember the exact instant when I realized that a large part of my life from then on was going to be spent in finding mistakes in my own programs. Maurice Wilkes discovers debugging, 1949
Data and File Structures Laboratory
 Tools: GDB, Valgrind Assistant Professor Machine Intelligence Unit Indian Statistical Institute, Kolkata August, 2018 1 GDB 2 Valgrind A programmer s experience Case I int x = 10, y = 25; x = x++ + y++;
CS2141 Software Development using C/C++ Debugging
 CS2141 Software Development using C/C++ Debugging Debugging Tips Examine the most recent change Error likely in, or exposed by, code most recently added Developing code incrementally and testing along
CptS 360 (System Programming) Unit 4: Debugging
 Unit 4: Debugging") CptS 360 (System Programming) Unit 4: Debugging Bob Lewis School of Engineering and Applied Sciences Washington State University Spring, 2018 Motivation You re probably going to spend most of your code
CptS 360 (System Programming) Unit 4: Debugging Bob Lewis School of Engineering and Applied Sciences Washington State University Spring, 2018 Motivation You re probably going to spend most of your code
CSE 160 Discussion Section. Winter 2017 Week 3
 CSE 160 Discussion Section Winter 2017 Week 3 Homework 1 - Recap & a few points ComputeMandelbrotPoint func() in smdb.cpp does the job serially. You will have to do the same task in parallel manner in
Debugging with GDB and DDT
 Debugging with GDB and DDT Ramses van Zon SciNet HPC Consortium University of Toronto June 28, 2012 1/41 Ontario HPC Summerschool 2012 Central Edition: Toronto Outline Debugging Basics Debugging with the
Embedded Software TI2726 B. 3. C tools. Koen Langendoen. Embedded Software Group
 Embedded Software 3. C tools TI2726 B Koen Langendoen Embedded Software Group C development cycle 1. [Think] 2. Edit 3. Compile 4. Test 5. Debug 6. Tune UNIX toolbox 2. vi, emacs, gedit 3. gcc, make 4.
Byobu. GNU Screen for Human Beings. Dustin Kirkland Ubuntu Core Developer
 Byobu GNU Screen for Human Beings Dustin Kirkland Ubuntu Core Developer kirkland@ubuntu.com What does it mean? 屏風 byo-bu: Japanese word for a decorative, multi-panel screen that serves as an elegant folding
GDB Tutorial. A Walkthrough with Examples. CMSC Spring Last modified March 22, GDB Tutorial
 A Walkthrough with Examples CMSC 212 - Spring 2009 Last modified March 22, 2009 What is gdb? GNU Debugger A debugger for several languages, including C and C++ It allows you to inspect what the program
Debugging. Marcelo Ponce SciNet HPC Consortium University of Toronto. July 15, /41 Ontario HPC Summerschool 2016 Central Edition: Toronto
 Debugging Marcelo Ponce SciNet HPC Consortium University of Toronto July 15, 2016 1/41 Ontario HPC Summerschool 2016 Central Edition: Toronto Outline Debugging Basics Debugging with the command line: GDB
GDB Linux GNU Linux Distribution. gdb gcc g++ -g gdb EB_01.cpp
 B Linux GDB GDB Linux GNU GPL Linux Distribution Linux E-B.1 gcc g++ -g EB_01.cpp EB_01.cpp E/EB/EB_01.cpp 1 2 3 4 5 6 7 8 9 10 11 12 13 14 15 16 17 18 19 /**** :EB_01.cpp : *****/ #include
Use Dynamic Analysis Tools on Linux
 Use Dynamic Analysis Tools on Linux FTF-SDS-F0407 Gene Fortanely Freescale Software Engineer Catalin Udma A P R. 2 0 1 4 Software Engineer, Digital Networking TM External Use Session Introduction This
valgrind overview: runtime memory checker and a bit more What can we do with it?
 Valgrind overview: Runtime memory checker and a bit more... What can we do with it? MLUG Mar 30, 2013 The problem When do we start thinking of weird bug in a program? The problem When do we start thinking
Welcome. HRSK Practical on Debugging, Zellescher Weg 12 Willers-Bau A106 Tel
 Center for Information Services and High Performance Computing (ZIH) Welcome HRSK Practical on Debugging, 03.04.2009 Zellescher Weg 12 Willers-Bau A106 Tel. +49 351-463 - 31945 Matthias Lieber (matthias.lieber@tu-dresden.de)
ICHEC. Using Valgrind. Using Valgrind :: detecting memory errors. Introduction. Program Compilation TECHNICAL REPORT
 ICHEC TECHNICAL REPORT Mr. Ivan Girotto ICHEC Computational Scientist Stoney Compute Node Bull Novascale R422-E2 Using Valgrind :: detecting memory errors Valgrind is a suite of command line tools both
DEBUGGING: DYNAMIC PROGRAM ANALYSIS
 DEBUGGING: DYNAMIC PROGRAM ANALYSIS WS 2017/2018 Martina Seidl Institute for Formal Models and Verification System Invariants properties of a program must hold over the entire run: integrity of data no
Lab 8. Follow along with your TA as they demo GDB. Make sure you understand all of the commands, how and when to use them.
 Lab 8 Each lab will begin with a recap of last lab and a brief demonstration by the TAs for the core concepts examined in this lab. As such, this document will not serve to tell you everything the TAs
6.S096: Introduction to C/C++
 6.S096: Introduction to C/C++ Frank Li, Tom Lieber, Kyle Murray Lecture 4: Data Structures and Debugging! January 17, 2012 Today Memory Leaks and Valgrind Tool Structs and Unions Opaque Types Enum and
emacs Know your tools emacs keys Minimal number of key commands for emacs GNU Emacs is an extensible, customisable text editor-and more
 Know your tools slide 1 emacs slide 2 abad workman blames his tools, Cambridge Idioms Dictionary we will examine: emacs, etags, grep, diff, patch, gcc, gm2, cvs, gdb, GNU Emacs is an extensible, customisable
CSE 410: Systems Programming
 CSE 410: Systems Programming Recitation 4: Introduction to gdb Introduction The GNU Debugger, or gdb, is a powerful symbolic debugger. Symbolic debuggers are available for many languages and platforms,
Debugging. ICS312 Machine-Level and Systems Programming. Henri Casanova
 Debugging ICS312 Machine-Level and Systems Programming Henri Casanova (henric@hawaii.edu) Debugging Even when written in high-level languages, programs have bugs Recall the thought that when moving away
Know your tools. For the GNU/Linux game developer GDB is the BFG. emacs. "a bad workman blames his tools", Cambridge Idioms Dictionary
 Know your tools slide 2 "a bad workman blames his tools", Cambridge Idioms Dictionary we will examine: emacs,etags,grep,diff,patch,gcc,gm2, cvs,gdb,svn although in this lecture we will only coveremacs
Using a debugger. Segmentation fault? GDB to the rescue!
 Using a debugger Segmentation fault? GDB to the rescue! But first... Let's talk about the quiz Let's talk about the previous homework assignment Let's talk about the current homework assignment K findkey(v
Using gdb to find the point of failure
 gdb gdb is the GNU debugger on our CS machines. gdb is most effective when it is debugging a program that has debugging symbols linked in to it. With gcc and g++, this is accomplished using the -g option,
Debugging with GDB and DDT
 Debugging with GDB and DDT Ramses van Zon SciNet HPC Consortium University of Toronto June 13, 2014 1/41 Ontario HPC Summerschool 2014 Central Edition: Toronto Outline Debugging Basics Debugging with the
Scientific Programming in C IX. Debugging
 Scientific Programming in C IX. Debugging Susi Lehtola 13 November 2012 Debugging Quite often you spend an hour to write a code, and then two hours debugging why it doesn t work properly. Scientific Programming
Debugging and Profiling
 Debugging and Profiling Dr. Axel Kohlmeyer Senior Scientific Computing Expert Information and Telecommunication Section The Abdus Salam International Centre for Theoretical Physics http://sites.google.com/site/akohlmey/
CSE 374 Programming Concepts & Tools. Brandon Myers Winter 2015 Lecture 11 gdb and Debugging (Thanks to Hal Perkins)
") CSE 374 Programming Concepts & Tools Brandon Myers Winter 2015 Lecture 11 gdb and Debugging (Thanks to Hal Perkins) Hacker tool of the week (tags) Problem: I want to find the definition of a function or
CSE 374 Programming Concepts & Tools Brandon Myers Winter 2015 Lecture 11 gdb and Debugging (Thanks to Hal Perkins) Hacker tool of the week (tags) Problem: I want to find the definition of a function or
Massif-Visualizer. Memory Profiling UI. Milian Wolff Desktop Summit
 Massif-Visualizer Memory Profiling UI Milian Wolff mail@milianw.de Desktop Summit 2011 08.08.2011 Agenda 1 Valgrind 2 Massif 3 Massif-Visualizer Milian Massif-Visualizer Desktop Summit Berlin 2/32 1 Valgrind
CSE 374 Final Exam 3/15/17. Name UW ID#
 Name UW ID# There are 10 questions worth a total of 110 points. Please budget your time so you get to all of the questions. Keep your answers brief and to the point. The exam is closed book, closed notes,
Debugging. P.Dagna, M.Cremonesi. May 2015
 Debugging P.Dagna, M.Cremonesi May 2015 Introduction Oneofthemostwidelyusedmethodstofindoutthereasonofa strange behavior in a program is the insertion of printf or write statements in the supposed critical
MPATE-GE 2618: C Programming for Music Technology. Unit 4.1
 MPATE-GE 2618: C Programming for Music Technology Unit 4.1 Memory Memory in the computer can be thought of as a long string of consecutive bytes. Each byte has a corresponding address. When we declare
TESTING AND DEBUGGING
 TESTING AND DEBUGGING zombie[1] zombie[3] Buuuuugs zombie[4] zombie[2] zombie[5] zombie[0] Fundamentals of Computer Science I Outline Debugging Types of Errors Syntax Errors Semantic Errors Logic Errors
Projet 0 - Correc,on. Structures de données et algorithmes
 Projet 0 - Correc,on Structures de données et algorithmes Code de base #include #define uint unsigned int #define N 101 int f(int m, int M, uint* s) *s ^= (uint)(*s
Making things work as expected
 Making things work as expected System Programming Lab Maksym Planeta Björn Döbel 20.09.2018 Table of Contents Introduction Hands-on Tracing made easy Dynamic intervention Compiler-based helpers The GNU
Debugging / Profiling
 The Center for Astrophysical Thermonuclear Flashes Debugging / Profiling Chris Daley 23 rd June An Advanced Simulation & Computing (ASC) Academic Strategic Alliances Program (ASAP) Center at Motivation
Section 1: Tools. Kaifei Chen, Luca Zuccarini. January 23, Make Motivation How... 2
 Kaifei Chen, Luca Zuccarini January 23, 2015 Contents 1 Make 2 1.1 Motivation............................................ 2 1.2 How................................................ 2 2 Git 2 2.1 Learn by
Debugging. John Lockman Texas Advanced Computing Center
 Debugging John Lockman Texas Advanced Computing Center Debugging Outline GDB Basic use Attaching to a running job DDT Identify MPI problems using Message Queues Catch memory errors PTP For the extremely
SGI Altix Getting Correct Code Reiner Vogelsang SGI GmbH
 SGI Altix Getting Correct Code Reiner Vogelsang SGI GmbH reiner@sgi.com Module Objectives After completing the module, you will able to Find caveats and hidden errors in application codes Handle debuggers
Debugging. Erwan Demairy Dream
 1 Debugging Erwan Demairy Dream 2 Where are we? Tools Requirements Global architecture UML Local architecture Implementation Compilation Link Editor Compiler Linker Tests Debug Profiling Build IDE Debugger
Valgrind. Philip Blakely. Laboratory for Scientific Computing, University of Cambridge. Philip Blakely (LSC) Valgrind 1 / 21
 Valgrind 1 / 21") Valgrind Philip Blakely Laboratory for Scientific Computing, University of Cambridge Philip Blakely (LSC) Valgrind 1 / 21 Part I Valgrind Philip Blakely (LSC) Valgrind 2 / 21 Valgrind http://valgrind.org/
Valgrind Philip Blakely Laboratory for Scientific Computing, University of Cambridge Philip Blakely (LSC) Valgrind 1 / 21 Part I Valgrind Philip Blakely (LSC) Valgrind 2 / 21 Valgrind http://valgrind.org/
Programming Tips for CS758/858
 Programming Tips for CS758/858 January 28, 2016 1 Introduction The programming assignments for CS758/858 will all be done in C. If you are not very familiar with the C programming language we recommend
Programming Studio #9 ECE 190
 Programming Studio #9 ECE 190 Programming Studio #9 Concepts: Functions review 2D Arrays GDB Announcements EXAM 3 CONFLICT REQUESTS, ON COMPASS, DUE THIS MONDAY 5PM. NO EXTENSIONS, NO EXCEPTIONS. Functions
Debug for GDB Users. Action Description Debug GDB $debug <program> <args> >create <program> <args>
 Page 1 of 5 Debug for GDB Users Basic Control To be useful, a debugger must be capable of basic process control. This functionally allows the user to create a debugging session and instruct the process
Introduction to debugging. Martin Čuma Center for High Performance Computing University of Utah
 Introduction to debugging Martin Čuma Center for High Performance Computing University of Utah m.cuma@utah.edu Overview Program errors Simple debugging Graphical debugging DDT and Totalview Intel tools
Performance Measurement
 ECPE 170 Jeff Shafer University of the Pacific Performance Measurement 2 Lab Schedule Activities Today / Thursday Background discussion Lab 5 Performance Measurement Next Week Lab 6 Performance Optimization
CS168: Debugging. Introduc)on to GDB, Wireshark and Valgrind. CS168 - Debugging Helpsession
on to GDB, Wireshark and Valgrind. CS168 - Debugging Helpsession") CS168: Debugging Introduc)on to GDB, Wireshark and Valgrind GDB: The GNU Debugger gdb is an executable file that serves as a portable debugger Works for Ada, C, C++, Objec)ve- C, Pascal, and others Useful
CS168: Debugging Introduc)on to GDB, Wireshark and Valgrind GDB: The GNU Debugger gdb is an executable file that serves as a portable debugger Works for Ada, C, C++, Objec)ve- C, Pascal, and others Useful
GDB 1 GDB 2 GDB. Fortran Pascal GDB 4. hoge.c. Fig. 1. calc.c. Fig GDB. GDB Debian. # apt-get install gdb
 2003 advanced seminar Intelligent Systems Design Lab. 1 GDB 2003 3 31 : GDB GDB GDB 1 GDB GDB ( ) Free Software Foundation(FSF) GDB 5.3 C,C++ 1 Fortran Pascal GDB 4 GDB 2 GDB Fig. 1 hoge.c calc.c GDB Fig.
Problem Set 1: Unix Commands 1
 Problem Set 1: Unix Commands 1 WARNING: IF YOU DO NOT FIND THIS PROBLEM SET TRIVIAL, I WOULD NOT RECOMMEND YOU TAKE THIS OFFERING OF 300 AS YOU DO NOT POSSESS THE REQUISITE BACKGROUND TO PASS THE COURSE.
ECE/ME/EMA/CS 759 High Performance Computing for Engineering Applications
 ECE/ME/EMA/CS 759 High Performance Computing for Engineering Applications Elements of Program Debugging Dan Negrut, 2017 ECE/ME/EMA/CS 759 UW-Madison Debugging on Euler [with gdb] Slides on gdb include
DAY 4. CS3600, Northeastern University. Alan Mislove
 C BOOTCAMP DAY 4 CS3600, Northeastern University Slides adapted from Anandha Gopalan s CS132 course at Univ. of Pittsburgh and the CS240 course at Purdue C Debugging 2 Debugging with gdb GDB is a debugger
High Performance Computing and Programming. Performance Analysis
 High Performance Computing and Programming Performance Analysis What is performance? Performance is a total effectiveness of a program What are the measures of the performance? execution time FLOPS memory
Debugging with gdb and valgrind
 Debugging with gdb and valgrind Dr. Axel Kohlmeyer Associate Dean for Scientific Computing, CST Associate Director, Institute for Computational Science Assistant Vice President for High-Performance Computing
Bug Hunting and Static Analysis
 Bug Hunting and Red Hat Ondřej Vašík and Petr Müller 2011-02-11 Abstract Basic overview of common error patterns in C/C++, few words about defensive programming
Debugging process. The debugging process can be divided into four main steps: 1. Start your program, specifying anything that might affect its
 Debugging Introduction One of the most widely used methods to find out the reason of a strange behavior in a program is the insertion of printf or write statements in the supposed critical area. However
Section 1: Tools. Contents CS162. January 19, Make More details about Make Git Commands to know... 3
 CS162 January 19, 2017 Contents 1 Make 2 1.1 More details about Make.................................... 2 2 Git 3 2.1 Commands to know....................................... 3 3 GDB: The GNU Debugger
Today s presentation. Git gdb Project 1
 CS3214: Project 1 Today s presentation Git gdb Project 1 Project 1 Due Monday, February 20 at 11:59 PM Office hours are on course website Check Piazza for updates Git Version Control System Keep snapshots
Guillimin HPC Users Meeting July 14, 2016
 Guillimin HPC Users Meeting July 14, 2016 guillimin@calculquebec.ca McGill University / Calcul Québec / Compute Canada Montréal, QC Canada Outline Compute Canada News System Status Software Updates Training
Lecture 14 Notes. Brent Edmunds
 Lecture 14 Notes Brent Edmunds October 5, 2012 Table of Contents 1 Sins of Coding 3 1.1 Accessing Undeclared Variables and Pointers...................... 3 1.2 Playing With What Isn t Yours..............................
Recitation 10: Malloc Lab
 Recitation 10: Malloc Lab Instructors Nov. 5, 2018 1 Administrivia Malloc checkpoint due Thursday, Nov. 8! wooooooooooo Malloc final due the week after, Nov. 15! wooooooooooo Malloc Bootcamp Sunday, Nov.
Timing programs with time
 Profiling Profiling measures the performance of a program and can be used to find CPU or memory bottlenecks. time A stopwatch gprof The GNU (CPU) Profiler callgrind Valgrind s CPU profiling tool massif
Reviewing gcc, make, gdb, and Linux Editors 1
 Reviewing gcc, make, gdb, and Linux Editors 1 Colin Gordon csgordon@cs.washington.edu University of Washington CSE333 Section 1, 3/31/11 1 Lots of material borrowed from 351/303 slides Colin Gordon (University
Introduction to GDB for System Administrators and Programmers. Nikolai Fetissov New York City BSD User Group. June 2, 2010
 Introduction to GDB for System Administrators and Programmers Nikolai Fetissov New York City BSD User Group. June 2, 2010 About GDB * Source-level (symbolic) and machine-level debugger * Originally written
1. Allowed you to see the value of one or more variables, or 2. Indicated where you were in the execution of a program
 CS0449 GDB Lab What is a debugger? A debugger is a program that helps you find logical mistakes in your programs by running them in a controlled way. Undoubtedly by this point in your programming life,
Typical Bugs in parallel Programs
 Center for Information Services and High Performance Computing (ZIH) Typical Bugs in parallel Programs Parallel Programming Course, Dresden, 8.- 12. February 2016 Joachim Protze (protze@rz.rwth-aachen.de)
CS480. Compilers Eclipse, SVN, Makefile examples
 CS480 Compilers Eclipse, SVN, Makefile examples January 26, 2015 New Project New Project C/C++ Project Create a New C Project Choose Makefile Project EmptyProject Toolchain: Linux GCC Next Advanced C/C++
GDB QUICK REFERENCE GDB Version 4
 GDB QUICK REFERENCE GDB Version 4 Essential Commands gdb program [core] debug program [using coredump core] b [file:]function run [arglist] bt p expr c n s set breakpoint at function [in file] start your
LAB #8. GDB can do four main kinds of things (plus other things in support of these) to help you catch bugs in the act:
 to help you catch bugs in the act:") LAB #8 Each lab will begin with a brief demonstration by the TAs for the core concepts examined in this lab. As such, this document will not serve to tell you everything the TAs will in the demo. It is
LAB #8 Each lab will begin with a brief demonstration by the TAs for the core concepts examined in this lab. As such, this document will not serve to tell you everything the TAs will in the demo. It is
Performance Analysis and Debugging Tools
 Performance Analysis and Debugging Tools Performance analysis and debugging intimately connected since they both involve monitoring of the software execution. Just different goals: Debugging -- achieve
Recitation #12 Malloc Lab - Part 2. November 14th, 2017
 18-600 Recitation #12 Malloc Lab - Part 2 November 14th, 2017 1 2 REMINDER Malloc Lab checkpoint is due on 11/17 This is Friday (instead of the usual Thursday deadline) No late days available Final submission
Intermediate Programming, Spring Misha Kazhdan
 600.120 Intermediate Programming, Spring 2017 Misha Kazhdan Outline Unix/Linux command line Basics of the Emacs editor Compiling and running a simple C program Cloning a repository Connecting to ugrad
The Dynamic Debugger gdb
 Introduction The Dynamic Debugger gdb This handout introduces the basics of using gdb, a very powerful dynamic debugging tool. No-one always writes programs that execute perfectly every time, and while
Program Design: Using the Debugger
 rogram Design, February 2, 2004 1 Program Design: Using the Debugger A debugger is an alternative to putting print (printf in C) statements in your program, recompiling and trying to find out what values
Computer Labs: Debugging
 Computer Labs: Debugging 2 o MIEIC Pedro F. Souto (pfs@fe.up.pt) November 23, 2010 Bugs and Debugging Problem To err is human This is specially true when the human is a programmer :( Solution There is
Cache Profiling with Callgrind
 Center for Information Services and High Performance Computing (ZIH) Cache Profiling with Callgrind Linux/x86 Performance Practical, 17.06.2009 Zellescher Weg 12 Willers-Bau A106 Tel. +49 351-463 - 31945
CSE 374 Final Exam 3/15/17 Sample Solution. Question 1. (8 points) Suppose we have the following two statements in a C program:
 Suppose we have the following two statements in a C program:") Question 1. (8 points) Suppose we have the following two statements in a C program: int *x = malloc(sizeof(int)); int *y = malloc(sizeof(int)); For each of the following expressions, write true if the
Question 1. (8 points) Suppose we have the following two statements in a C program: int *x = malloc(sizeof(int)); int *y = malloc(sizeof(int)); For each of the following expressions, write true if the
Tips on Using GDB to Track Down and Stamp Out Software Bugs
 Tips on Using GDB to Track Down and Stamp Out Software Bugs Brett Viren Physics Department MINOS Week In The Woods, 2005 Brett Viren (Brookhaven National Lab) Using GDB to Debug Ely 2005 1 / 34 Outline
GDB cheatsheet - page 1
 Running # gdb [core dump] Start GDB (with optional core dump). # gdb --args Start GDB and pass arguments # gdb --pid Start GDB and attach to process. set args
Memory Allocation in C C Programming and Software Tools. N.C. State Department of Computer Science
 Memory Allocation in C C Programming and Software Tools N.C. State Department of Computer Science The Easy Way Java (JVM) automatically allocates and reclaims memory for you, e.g... Removed object is implicitly
CSE 374 Programming Concepts & Tools
 CSE 374 Programming Concepts & Tools Hal Perkins Fall 2017 Lecture 11 gdb and Debugging 1 Administrivia HW4 out now, due next Thursday, Oct. 26, 11 pm: C code and libraries. Some tools: gdb (debugger)
Laboratory Assignment #4 Debugging in Eclipse CDT 1
 Lab 4 (10 points) November 20, 2013 CS-2301, System Programming for Non-majors, B-term 2013 Objective Laboratory Assignment #4 Debugging in Eclipse CDT 1 Due: at 11:59 pm on the day of your lab session
{C} Tools of the Trade
 {C} Tools of the Trade make Building Software 3 gcc is our compiler Turns C code into machine code ar is our librarian Gathers machine code files into groups called libraries But calling these over and
Programming in C First meeting
 Programming in C First meeting 8.9.2016 Tiina Niklander Faculty of Science Department of Computer Science www.cs.helsinki.fi 8.9.2016 1 Course structure Weekly exercise deadline on Wednesday, lectures
Praktische Aspekte der Informatik
 Praktische Aspekte der Informatik Moritz Mühlhausen Prof. Marcus Magnor Optimization valgrind, gprof, and callgrind Further Reading Warning! The following slides are meant to give you a very superficial
Coding Tools. (Lectures on High-performance Computing for Economists VI) Jesús Fernández-Villaverde 1 and Pablo Guerrón 2 March 25, 2018
 Jesús Fernández-Villaverde 1 and Pablo Guerrón 2 March 25, 2018") Coding Tools (Lectures on High-performance Computing for Economists VI) Jesús Fernández-Villaverde 1 and Pablo Guerrón 2 March 25, 2018 1 University of Pennsylvania 2 Boston College Compilers Compilers
Coding Tools (Lectures on High-performance Computing for Economists VI) Jesús Fernández-Villaverde 1 and Pablo Guerrón 2 March 25, 2018 1 University of Pennsylvania 2 Boston College Compilers Compilers
CMPSC 311- Introduction to Systems Programming Module: Debugging
 CMPSC 311- Introduction to Systems Programming Module: Debugging Professor Patrick McDaniel Fall 2016 Debugging Often the most complicated and time-consuming part of developing a program is debugging.
Pointers. Héctor Menéndez 1. November 28, AIDA Research Group Computer Science Department Universidad Autónoma de Madrid.
 Pointers Héctor Menéndez 1 AIDA Research Group Computer Science Department Universidad Autónoma de Madrid November 28, 2013 1 based on the original slides of the subject Index 1 Dynamic Memory 2 Arrays
Jackson State University Department of Computer Science CSC / Advanced Information Security Spring 2013 Lab Project # 5
 Jackson State University Department of Computer Science CSC 439-01/539-02 Advanced Information Security Spring 2013 Lab Project # 5 Use of GNU Debugger (GDB) for Reverse Engineering of C Programs in a
CSCI 2132 Software Development. Lecture 29: Dynamic Memory Allocation
 CSCI 2132 Software Development Lecture 29: Dynamic Memory Allocation Instructor: Vlado Keselj Faculty of Computer Science Dalhousie University 22-Nov-2017 (29) CSCI 2132 1 Previous Lecture Protecting header
Debugging: Love It, Hate It Or Reverse It?
 Debugging: Love It, Hate It Or Reverse It? Debugging: Love It, Hate It Or Reverse It?. Julian Smith, co-founder and CTO, Undo. jsmith@undo.io http://undo.io/ Overview Testing. Debugging: Debugging with
Programming (ERIM) Lecture 1: Introduction to programming paradigms and typing systems. Tommi Tervonen
 Lecture 1: Introduction to programming paradigms and typing systems. Tommi Tervonen") Programming (ERIM) Lecture 1: Introduction to programming paradigms and typing systems Tommi Tervonen Econometric Institute, Erasmus School of Economics Course learning objectives After this course, you
Programming (ERIM) Lecture 1: Introduction to programming paradigms and typing systems Tommi Tervonen Econometric Institute, Erasmus School of Economics Course learning objectives After this course, you
CS631 - Advanced Programming in the UNIX Environment. UNIX development tools
 CS631 - Advanced Programming in the UNIX Environment Slide 1 CS631 - Advanced Programming in the UNIX Environment UNIX development tools Department of Computer Science Stevens Institute of Technology Jan
Using the Unix system. UNIX Introduction
 Using the Unix system Navigating the Unix file system Editing with emacs Compiling with gcc UNIX Introduction The UNIX operating system is made up of three parts: the kernel, the shell and the programs
CMPSC 311- Introduction to Systems Programming Module: Debugging
 CMPSC 311- Introduction to Systems Programming Module: Debugging Professor Patrick McDaniel Fall 2014 Debugging Often the most complicated and time-consuming part of developing a program is debugging.
LAB #8. Last Survey, I promise!!! Please fill out this really quick survey about paired programming and information about your declared major and CS.
 LAB #8 Each lab will begin with a brief demonstration by the TAs for the core concepts examined in this lab. As such, this document will not serve to tell you everything the TAs will in the demo. It is
Project #1: Tracing, System Calls, and Processes
 Project #1: Tracing, System Calls, and Processes Objectives In this project, you will learn about system calls, process control and several different techniques for tracing and instrumenting process behaviors.
CIS 190: C/C++ Programming. Lecture 3 Memory Management in C
 CIS 190: C/C++ Programming Lecture 3 Memory Management in C Outline Memory allocation Memory errors Debugging Makefiles Memory each process gets its own memory chunk, or address space 0x000000 Stack Function
GDB Tutorial. Young W. Lim Tue. Young W. Lim GDB Tutorial Tue 1 / 32
 GDB Tutorial Young W. Lim 2017-02-14 Tue Young W. Lim GDB Tutorial 2017-02-14 Tue 1 / 32 Outline 1 Introduction Young W. Lim GDB Tutorial 2017-02-14 Tue 2 / 32 Based on "Self-service Linux: Mastering the
Pointers and Memory Management
 Pointers and Memory Management Timo Karvi 2013 Timo Karvi () Pointers and Memory Management 2013 1 / 58 Memory and C I In most modern computers, main memory is divided into bytes, with each byte capable
When you add a number to a pointer, that number is added, but first it is multiplied by the sizeof the type the pointer points to.
 Refresher When you add a number to a pointer, that number is added, but first it is multiplied by the sizeof the type the pointer points to. i.e. char *ptr1 = malloc(1); ptr1 + 1; // adds 1 to pointer
Boot Camp. Dave Eckhardt Bruce Maggs
 Boot Camp Dave Eckhardt de0u@andrew.cmu.edu Bruce Maggs bmm@cs.cmu.edu 1 This Is a Hard Class Traditional hazards 410 letter grade one lower than other classes All other classes this semester: one grade