Welcome. HRSK Practical on Debugging, Zellescher Weg 12 Willers-Bau A106 Tel
|
|
|
- Alison Richardson
- 5 years ago
- Views:
Transcription
 Welcome HRSK")

 Tobias Hilbrich (tobias.")
1 Center for Information Services and High Performance Computing (ZIH) Welcome HRSK Practical on Debugging, Zellescher Weg 12 Willers-Bau A106 Tel Matthias Lieber (matthias.lieber@tu-dresden.de) Tobias Hilbrich (tobias.hilbrich@zih.tu-dresden.de)
2 Agenda 08:00 Introduction 08:30 Typical Bugs and how to avoid them 09:00 The Heat Equation Example 09:30 COFFEE BREAK 09:45 First Steps with GDB 10:30 DDT and Totalview I 11:30 LUNCH BREAK 12:30 DDT and Totalview II 13:30 Memory Debugging 14:00 COFFEE BREAK 14:15 Debugging Multithreaded Applications 15:00 Debugging MPI Applications 16:00 THE END Introduction 2
3 Center for Information Services and High Performance Computing (ZIH) Introduction HRSK Practical on Debugging, Zellescher Weg 12 Willers-Bau A106 Tel Matthias Lieber (matthias.lieber@tu-dresden.de) Tobias Hilbrich (tobias.hilbrich@zih.tu-dresden.de)
4 Why using a Debugger? Your program terminates abnormally produces wrong results shows incomprehensible behavior You want to know what your program is (really) doing Typical example: your program crashes with a segmentation fault % gcc myprog.c o myprog %./myprog Segmentation fault % What s going wrong? Introduction 4
5 What can a Debugger do? Observe a running program: Print variables (scalars, arrays, structures / derived types, classes) Inform about current source code line and function (function call stack) Control the program execution: Stop the program at a specific source code line (Breakpoints) Stop the program by evaluating variable expressions (Conditional Breakpoints and Watchpoints) Stop the program before terminating abnormally Execute the program line-by-line (Stepping) Introduction 5
6 Function call stack program main... call print_date... end program main subroutine print_date... call date_and_time... end subroutine print_date calls calls Function call stack: information of all active functions of a process which have been called but not yet finished. Stack: #0: date_and_time #1: print_date #2: main subroutine date_and_time... program is here Introduction 6
7 Typical Usage of a Debugger Compile the program with the g compiler flag gcc g myprog.c o myprog Run the program under control of the debugger: ddt./myprog Locate the position of the problem and examine variables Find out why the program shows unexpected behavior Edit the source code, modify parameters, etc. Repeat until problem is solved Introduction 7
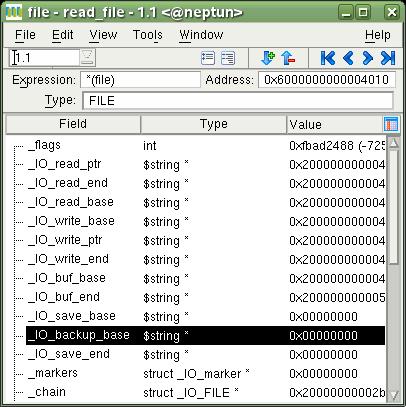
8 Advanced Debugger Features Support for parallel applications, i.e. observe N processes at a time Graphical display of type structures and pointers Visualization of array contents Memory debugging Modify variables Reverse stepping Introduction 8
9 Debugging Tools at HRSK vendor / name command graphical user interface parallel support Mars Deimos GNU Debugger gdb Threads GNU Data Display Debugger ddd Threads Allinea Distributed Debugging Tool ddt Totalview totalview Threads, MPI Threads, MPI Valgrind valgrind Threads DUMA duma (yes) Introduction 9
")
10 Example: Allinea DDT (Distributed Debugging Tool) Introduction 10

11 Example: Totalview Introduction 11
12 Example: GNU Debugger (gdb) Introduction 12
 Introduction")
13 Example: GNU DDD (GUI for GDB) Introduction 13
14 Debugger Usage at HRSK On login CPUs (not recommended) Works for short runs only (10 minutes runtime limit) As batch job Start your program like normal batch job, but under control of the debugger Closing the debugger finishes the batch job new job necessary for next debugging run From interactive batch session (recommended) Start a shell on compute CPUs and start program from there Very useful if you plan to do multiple debugging sessions: consecutive program runs in one batch job In the interactive batch session you can work like on the login CPUs but with your own private CPUs Introduction 14
15 DDT Usage at HRSK Compile your code with the g compiler flag (common across all compilers) icc g O0 myprog.c o myprog Set the environment for DDT module load ddt Start the program under control of DDT on the login CPUs (short runs only): ddt./myprog as batch job: bsub W 2:00 n 1 ddt./myprog from interactive batch session: bsub W 2:00 n 1 Is bash ddt./myprog Introduction 15
16 Debugger Operation Modes: Start program under Debugger Most common way to use a debugger Fully interactive Not useful if you want to observe what the program does after a long runtime Introduction 16
17 Debugger Operation Modes: Attach to a running Program Debuggers can attach to an already running program Useful if program has been running for a long time You observe incomprehensive behavior (hangs, wrong results) Program was not started under debugger You don t want to rerun the program Introduction 17
18 Debugger Operation Modes: Core File Debugging Core dumps are memory and register state of a crashed program written to disk These files can be analyzed after program termination with a debugger Must be enabled before starting the program ulimit c <corefile size limit> in the bash Shell Useful if you don t expect a crash or don t want to wait until a crash happens (probably after long runtime) Drawback: Program is not alive anymore Only static analysis of program s data Corefile can become huge, especially for parallel production codes Introduction 18
19 More Tools Memory debugger Detect dynamic memory management bugs Today: Valgrind, DUMA Correctness checking tools for multithreaded applications Detect faulty use of thread parallelization (e.g. deadlocks) Today: Intel Thread Checker Correctness checking tools for MPI applications Detect wrong use of the MPI library Today: MARMOT Introduction 19
20 Remarks on Compiler Flags Use compiler s check capabilities like -Wall etc. Read compiler s manual: man {gcc ifort pathcc pgf90...} Intel C Compiler: -Wall -Wp64 -Wuninitialized -strict-ansi Intel Fortran Compiler: -warn all -std95 -C -fpe0 -traceback Always compile your application with the g flag, especially during developing and testing Optimizations often interfere with debugging (e.g. functions or variables of interest are optimized away ) If necessary, compile with O0 to disable optimizations Introduction 20
Introduction to debugging. Martin Čuma Center for High Performance Computing University of Utah
 Introduction to debugging Martin Čuma Center for High Performance Computing University of Utah m.cuma@utah.edu Overview Program errors Simple debugging Graphical debugging DDT and Totalview Intel tools
Debugging with GDB and DDT
 Debugging with GDB and DDT Ramses van Zon SciNet HPC Consortium University of Toronto June 28, 2012 1/41 Ontario HPC Summerschool 2012 Central Edition: Toronto Outline Debugging Basics Debugging with the
Typical Bugs in parallel Programs
 Center for Information Services and High Performance Computing (ZIH) Typical Bugs in parallel Programs Parallel Programming Course, Dresden, 8.- 12. February 2016 Joachim Protze (protze@rz.rwth-aachen.de)
Debugging with GDB and DDT
 Debugging with GDB and DDT Ramses van Zon SciNet HPC Consortium University of Toronto June 13, 2014 1/41 Ontario HPC Summerschool 2014 Central Edition: Toronto Outline Debugging Basics Debugging with the
TotalView. Debugging Tool Presentation. Josip Jakić
 TotalView Debugging Tool Presentation Josip Jakić josipjakic@ipb.ac.rs Agenda Introduction Getting started with TotalView Primary windows Basic functions Further functions Debugging parallel programs Topics
Compiler Options. Linux/x86 Performance Practical,
 Center for Information Services and High Performance Computing (ZIH) Compiler Options Linux/x86 Performance Practical, 17.06.2009 Zellescher Weg 12 Willers-Bau A106 Tel. +49 351-463 - 31945 Ulf Markwardt
Parallel Debugging with TotalView BSC-CNS
 Parallel Debugging with TotalView BSC-CNS AGENDA What debugging means? Debugging Tools in the RES Allinea DDT as alternative (RogueWave Software) What is TotalView Compiling Your Program Starting totalview
DDT: A visual, parallel debugger on Ra
 DDT: A visual, parallel debugger on Ra David M. Larue dlarue@mines.edu High Performance & Research Computing Campus Computing, Communications, and Information Technologies Colorado School of Mines March,
SGI Altix Getting Correct Code Reiner Vogelsang SGI GmbH
 SGI Altix Getting Correct Code Reiner Vogelsang SGI GmbH reiner@sgi.com Module Objectives After completing the module, you will able to Find caveats and hidden errors in application codes Handle debuggers
Cache Profiling with Callgrind
 Center for Information Services and High Performance Computing (ZIH) Cache Profiling with Callgrind Linux/x86 Performance Practical, 17.06.2009 Zellescher Weg 12 Willers-Bau A106 Tel. +49 351-463 - 31945
Debugging. John Lockman Texas Advanced Computing Center
 Debugging John Lockman Texas Advanced Computing Center Debugging Outline GDB Basic use Attaching to a running job DDT Identify MPI problems using Message Queues Catch memory errors PTP For the extremely
Altix Usage and Application Programming
 Center for Information Services and High Performance Computing (ZIH) Altix Usage and Application Programming Discussion And Important Information For Users Zellescher Weg 12 Willers-Bau A113 Tel. +49 351-463
Debugging. Marcelo Ponce SciNet HPC Consortium University of Toronto. July 15, /41 Ontario HPC Summerschool 2016 Central Edition: Toronto
 Debugging Marcelo Ponce SciNet HPC Consortium University of Toronto July 15, 2016 1/41 Ontario HPC Summerschool 2016 Central Edition: Toronto Outline Debugging Basics Debugging with the command line: GDB
Short Introduction to Debugging Tools on the Cray XC40
 Short Introduction to Debugging Tools on the Cray XC40 Overview Debugging Get your code up and running correctly. Profiling Locate performance bottlenecks. Light weight At most relinking. Get a first picture
Intro to Segmentation Fault Handling in Linux. By Khanh Ngo-Duy
 Intro to Segmentation Fault Handling in Linux By Khanh Ngo-Duy Khanhnd@elarion.com Seminar What is Segmentation Fault (Segfault) Examples and Screenshots Tips to get Segfault information What is Segmentation
Short Introduction to tools on the Cray XC system. Making it easier to port and optimise apps on the Cray XC30
 Short Introduction to tools on the Cray XC system Making it easier to port and optimise apps on the Cray XC30 Cray Inc 2013 The Porting/Optimisation Cycle Modify Optimise Debug Cray Performance Analysis
Debugging with TotalView
 Debugging with TotalView Le Yan HPC Consultant User Services Goals Learn how to start TotalView on Linux clusters Get familiar with TotalView graphic user interface Learn basic debugging functions of TotalView
DDT Debugging Techniques
 DDT Debugging Techniques Carlos Rosales carlos@tacc.utexas.edu Scaling to Petascale 2010 July 7, 2010 Debugging Parallel Programs Usual problems Memory access issues Special cases not accounted for in
Guillimin HPC Users Meeting July 14, 2016
 Guillimin HPC Users Meeting July 14, 2016 guillimin@calculquebec.ca McGill University / Calcul Québec / Compute Canada Montréal, QC Canada Outline Compute Canada News System Status Software Updates Training
Debugging with Totalview. Martin Čuma Center for High Performance Computing University of Utah
 Debugging with Totalview Martin Čuma Center for High Performance Computing University of Utah mcuma@chpc.utah.edu Overview Totalview introduction. Basic operation. Serial debugging. Parallel debugging.
CS354 gdb Tutorial Written by Chris Feilbach
 CS354 gdb Tutorial Written by Chris Feilbach Purpose This tutorial aims to show you the basics of using gdb to debug C programs. gdb is the GNU debugger, and is provided on systems that
Short Introduction to Tools on the Cray XC systems
 Short Introduction to Tools on the Cray XC systems Assisting the port/debug/optimize cycle 4/11/2015 1 The Porting/Optimisation Cycle Modify Optimise Debug Cray Performance Analysis Toolkit (CrayPAT) ATP,
Exercise Session 6 Computer Architecture and Systems Programming
 Systems Group Department of Computer Science ETH Zürich Exercise Session 6 Computer Architecture and Systems Programming Herbstsemester 2016 Agenda GDB Outlook on assignment 6 GDB The GNU Debugger 3 Debugging..
12. Debugging. Overview. COMP1917: Computing 1. Developing Programs. The Programming Cycle. Programming cycle. Do-it-yourself debugging
 COMP1917 12s2 Debugging 1 COMP1917: Computing 1 12. Debugging Overview Programming cycle Do-it-yourself debugging Debugging withgdb Nastier bugs Memory leaks COMP1917 12s2 Debugging 2 Developing Programs
COSC 6374 Parallel Computation. Debugging MPI applications. Edgar Gabriel. Spring 2008
 COSC 6374 Parallel Computation Debugging MPI applications Spring 2008 How to use a cluster A cluster usually consists of a front-end node and compute nodes Name of the front-end node: shark.cs.uh.edu You
Allinea DDT Debugger. Dan Mazur, McGill HPC March 5,
 Allinea DDT Debugger Dan Mazur, McGill HPC daniel.mazur@mcgill.ca guillimin@calculquebec.ca March 5, 2015 1 Outline Introduction and motivation Guillimin login and DDT configuration Compiling for a debugger
Debugging, benchmarking, tuning i.e. software development tools. Martin Čuma Center for High Performance Computing University of Utah
 Debugging, benchmarking, tuning i.e. software development tools Martin Čuma Center for High Performance Computing University of Utah m.cuma@utah.edu SW development tools Development environments Compilers
CSE 374 Programming Concepts & Tools
 CSE 374 Programming Concepts & Tools Hal Perkins Fall 2017 Lecture 11 gdb and Debugging 1 Administrivia HW4 out now, due next Thursday, Oct. 26, 11 pm: C code and libraries. Some tools: gdb (debugger)
Scientific Programming in C IX. Debugging
 Scientific Programming in C IX. Debugging Susi Lehtola 13 November 2012 Debugging Quite often you spend an hour to write a code, and then two hours debugging why it doesn t work properly. Scientific Programming
Addressing the Increasing Challenges of Debugging on Accelerated HPC Systems. Ed Hinkel Senior Sales Engineer
 Addressing the Increasing Challenges of Debugging on Accelerated HPC Systems Ed Hinkel Senior Sales Engineer Agenda Overview - Rogue Wave & TotalView GPU Debugging with TotalView Nvdia CUDA Intel Phi 2
Debugging. Erwan Demairy Dream
 1 Debugging Erwan Demairy Dream 2 Where are we? Tools Requirements Global architecture UML Local architecture Implementation Compilation Link Editor Compiler Linker Tests Debug Profiling Build IDE Debugger
Debugging with TotalView
 Debugging with TotalView Dieter an Mey Center for Computing and Communication Aachen University of Technology anmey@rz.rwth-aachen.de 1 TotalView, Dieter an Mey, SunHPC 2006 Debugging on Sun dbx line mode
GPU Debugging Made Easy. David Lecomber CTO, Allinea Software
 GPU Debugging Made Easy David Lecomber CTO, Allinea Software david@allinea.com Allinea Software HPC development tools company Leading in HPC software tools market Wide customer base Blue-chip engineering,
ECE/ME/EMA/CS 759 High Performance Computing for Engineering Applications
 ECE/ME/EMA/CS 759 High Performance Computing for Engineering Applications Elements of Program Debugging Dan Negrut, 2017 ECE/ME/EMA/CS 759 UW-Madison Debugging on Euler [with gdb] Slides on gdb include
Blue Gene/Q User Workshop. Debugging
 Blue Gene/Q User Workshop Debugging Topics GDB Core Files Coreprocessor 2 GNU Debugger (GDB) The GNU Debugger (GDB) The Blue Gene/Q system includes support for running GDB with applications that run on
Debugging and Profiling
 Debugging and Profiling Dr. Axel Kohlmeyer Senior Scientific Computing Expert Information and Telecommunication Section The Abdus Salam International Centre for Theoretical Physics http://sites.google.com/site/akohlmey/
Programming Studio #9 ECE 190
 Programming Studio #9 ECE 190 Programming Studio #9 Concepts: Functions review 2D Arrays GDB Announcements EXAM 3 CONFLICT REQUESTS, ON COMPASS, DUE THIS MONDAY 5PM. NO EXTENSIONS, NO EXCEPTIONS. Functions
Debugging on Intel Platforms
 White Paper Robert Mueller-Albrecht Developer Products Division Intel Corporation Debugging on Intel Platforms Introduction...3 Overview...3 Servers and Workstations...4 Support for Linux*, Mac OS X*,
Coupling DDT and Marmot for Debugging of MPI Applications
 Coupling DDT and Marmot for Debugging of MPI Applications Bettina Krammer 1, Valentin Himmler 1, and David Lecomber 2 1 HLRS - High Performance Computing Center Stuttgart, Nobelstrasse 19, 70569 Stuttgart,
Debugging with gdb and valgrind
 Debugging with gdb and valgrind Dr. Axel Kohlmeyer Associate Dean for Scientific Computing, CST Associate Director, Institute for Computational Science Assistant Vice President for High-Performance Computing
Laboratory 1 Semester 1 11/12
 CS2106 National University of Singapore School of Computing Laboratory 1 Semester 1 11/12 MATRICULATION NUMBER: In this lab exercise, you will get familiarize with some basic UNIX commands, editing and
Programming Environment 4/11/2015
 Programming Environment 4/11/2015 1 Vision Cray systems are designed to be High Productivity as well as High Performance Computers The Cray Programming Environment (PE) provides a simple consistent interface
Debugging. ICS312 Machine-Level and Systems Programming. Henri Casanova
 Debugging ICS312 Machine-Level and Systems Programming Henri Casanova (henric@hawaii.edu) Debugging Even when written in high-level languages, programs have bugs Recall the thought that when moving away
Profiling and debugging. Carlos Rosales September 18 th 2009 Texas Advanced Computing Center The University of Texas at Austin
 Profiling and debugging Carlos Rosales carlos@tacc.utexas.edu September 18 th 2009 Texas Advanced Computing Center The University of Texas at Austin Outline Debugging Profiling GDB DDT Basic use Attaching
COSC 6374 Parallel Computation. Analytical Modeling of Parallel Programs (I) Edgar Gabriel Fall Execution Time
 Edgar Gabriel Fall Execution Time") COSC 6374 Parallel Computation Analytical Modeling of Parallel Programs (I) Edgar Gabriel Fall 2015 Execution Time Serial runtime T s : time elapsed between beginning and the end of the execution of a
COSC 6374 Parallel Computation Analytical Modeling of Parallel Programs (I) Edgar Gabriel Fall 2015 Execution Time Serial runtime T s : time elapsed between beginning and the end of the execution of a
Lab 8. Follow along with your TA as they demo GDB. Make sure you understand all of the commands, how and when to use them.
 Lab 8 Each lab will begin with a recap of last lab and a brief demonstration by the TAs for the core concepts examined in this lab. As such, this document will not serve to tell you everything the TAs
Debugging. P.Dagna, M.Cremonesi. May 2015
 Debugging P.Dagna, M.Cremonesi May 2015 Introduction Oneofthemostwidelyusedmethodstofindoutthereasonofa strange behavior in a program is the insertion of printf or write statements in the supposed critical
Introduction to Parallel Programming. Martin Čuma Center for High Performance Computing University of Utah
 Introduction to Parallel Programming Martin Čuma Center for High Performance Computing University of Utah mcuma@chpc.utah.edu Overview Types of parallel computers. Parallel programming options. How to
MPI Application Development with MARMOT
 MPI Application Development with MARMOT Bettina Krammer University of Stuttgart High-Performance Computing-Center Stuttgart (HLRS) www.hlrs.de Matthias Müller University of Dresden Centre for Information
Introduction to Parallel Programming. Martin Čuma Center for High Performance Computing University of Utah
 Introduction to Parallel Programming Martin Čuma Center for High Performance Computing University of Utah m.cuma@utah.edu Overview Types of parallel computers. Parallel programming options. How to write
GPU Technology Conference Three Ways to Debug Parallel CUDA Applications: Interactive, Batch, and Corefile
 GPU Technology Conference 2015 Three Ways to Debug Parallel CUDA Applications: Interactive, Batch, and Corefile Three Ways to Debug Parallel CUDA Applications: Interactive, Batch, and Corefile What do
Debugging Your CUDA Applications With CUDA-GDB
 Debugging Your CUDA Applications With CUDA-GDB Outline Introduction Installation & Usage Program Execution Control Thread Focus Program State Inspection Run-Time Error Detection Tips & Miscellaneous Notes
Data and File Structures Laboratory
 Tools: GDB, Valgrind Assistant Professor Machine Intelligence Unit Indian Statistical Institute, Kolkata August, 2018 1 GDB 2 Valgrind A programmer s experience Case I int x = 10, y = 25; x = x++ + y++;
Tips on Using GDB to Track Down and Stamp Out Software Bugs
 Tips on Using GDB to Track Down and Stamp Out Software Bugs Brett Viren Physics Department MINOS Week In The Woods, 2005 Brett Viren (Brookhaven National Lab) Using GDB to Debug Ely 2005 1 / 34 Outline
DEBUGGING ON FERMI PREPARING A DEBUGGABLE APPLICATION GDB. GDB on front-end nodes
 DEBUGGING ON FERMI Debugging your application on a system based on a BG/Q architecture like FERMI could be an hard task due to the following problems: the core files generated by a crashing job on FERMI
IBM PSSC Montpellier Customer Center. Content
 Content IBM PSSC Montpellier Customer Center Standard Tools Compiler Options GDB IBM System Blue Gene/P Specifics Core Files + addr2line Coreprocessor Supported Commercial Software TotalView Debugger Allinea
Intel Parallel Studio XE 2017 Composer Edition BETA C++ - Debug Solutions Release Notes
 Developer Zone Intel Parallel Studio XE 2017 Composer Edition BETA C++ - Debug Solutions Release Notes Submitted by Georg Z. (Intel) on August 5, 2016 This page provides the current Release Notes for the
CSE 374 Programming Concepts & Tools. Brandon Myers Winter 2015 Lecture 11 gdb and Debugging (Thanks to Hal Perkins)
") CSE 374 Programming Concepts & Tools Brandon Myers Winter 2015 Lecture 11 gdb and Debugging (Thanks to Hal Perkins) Hacker tool of the week (tags) Problem: I want to find the definition of a function or
CSE 374 Programming Concepts & Tools Brandon Myers Winter 2015 Lecture 11 gdb and Debugging (Thanks to Hal Perkins) Hacker tool of the week (tags) Problem: I want to find the definition of a function or
Tool for Analysing and Checking MPI Applications
 Tool for Analysing and Checking MPI Applications April 30, 2010 1 CONTENTS CONTENTS Contents 1 Introduction 3 1.1 What is Marmot?........................... 3 1.2 Design of Marmot..........................
Hands-on Workshop on How To Debug Codes at the Institute
 Hands-on Workshop on How To Debug Codes at the Institute H. Birali Runesha, Shuxia Zhang and Ben Lynch (612) 626 0802 (help) help@msi.umn.edu October 13, 2005 Outline Debuggers at the Institute Totalview
Debugging at Scale Lindon Locks
 Debugging at Scale Lindon Locks llocks@allinea.com Debugging at Scale At scale debugging - from 100 cores to 250,000 Problems faced by developers on real systems Alternative approaches to debugging and
Basic functions of a debugger
 UNIVERSITY OF CALIFORNIA Department of Electrical Engineering and Computer Sciences Computer Science Division CS61B Spring 1998 P. N. Hilfinger Simple Use of GDB A debugger is a program that runs other
ECMWF Workshop on High Performance Computing in Meteorology. 3 rd November Dean Stewart
 ECMWF Workshop on High Performance Computing in Meteorology 3 rd November 2010 Dean Stewart Agenda Company Overview Rogue Wave Product Overview IMSL Fortran TotalView Debugger Acumem ThreadSpotter 1 Copyright
Improving the Productivity of Scalable Application Development with TotalView May 18th, 2010
 Improving the Productivity of Scalable Application Development with TotalView May 18th, 2010 Chris Gottbrath Principal Product Manager Rogue Wave Major Product Offerings 2 TotalView Technologies Family
Debugging and profiling of MPI programs
 Debugging and profiling of MPI programs The code examples: http://syam.sharcnet.ca/mpi_debugging.tgz Sergey Mashchenko (SHARCNET / Compute Ontario / Compute Canada) Outline Introduction MPI debugging MPI
Debugging HPC Applications. David Lecomber CTO, Allinea Software
 Debugging HPC Applications David Lecomber CTO, Allinea Software david@allinea.com Agenda Bugs and Debugging Debugging parallel applications Debugging OpenACC and other hybrid codes Debugging for Petascale
Understanding Dynamic Parallelism
 Understanding Dynamic Parallelism Know your code and know yourself Presenter: Mark O Connor, VP Product Management Agenda Introduction and Background Fixing a Dynamic Parallelism Bug Understanding Dynamic
18-600: Recitation #3
 18-600: Recitation #3 Bomb Lab & GDB Overview September 12th, 2017 1 Today X86-64 Overview Bomb Lab Introduction GDB Tutorial 2 3 x86-64: Register Conventions Arguments passed in registers: %rdi, %rsi,
Debugging Applications Using Totalview
 Debugging Applications Using Totalview Timothy H. Kaiser tkaiser@sdsc.edu Slides by:nicholas J Wright First things first.. There is no point in optimising a program that has a bug in it a really fast code
1. Allowed you to see the value of one or more variables, or 2. Indicated where you were in the execution of a program
 CS0449 GDB Lab What is a debugger? A debugger is a program that helps you find logical mistakes in your programs by running them in a controlled way. Undoubtedly by this point in your programming life,
GDB Tutorial. A Walkthrough with Examples. CMSC Spring Last modified March 22, GDB Tutorial
 A Walkthrough with Examples CMSC 212 - Spring 2009 Last modified March 22, 2009 What is gdb? GNU Debugger A debugger for several languages, including C and C++ It allows you to inspect what the program
Debugging for the hybrid-multicore age (A HPC Perspective) David Lecomber CTO, Allinea Software
 David Lecomber CTO, Allinea Software") Debugging for the hybrid-multicore age (A HPC Perspective) David Lecomber CTO, Allinea Software david@allinea.com Agenda What is HPC? How is scale affecting HPC? Achieving tool scalability Scale in practice
Debugging for the hybrid-multicore age (A HPC Perspective) David Lecomber CTO, Allinea Software david@allinea.com Agenda What is HPC? How is scale affecting HPC? Achieving tool scalability Scale in practice
Performance Analysis and Debugging Tools
 Performance Analysis and Debugging Tools Performance analysis and debugging intimately connected since they both involve monitoring of the software execution. Just different goals: Debugging -- achieve
CS2141 Software Development using C/C++ Debugging
 CS2141 Software Development using C/C++ Debugging Debugging Tips Examine the most recent change Error likely in, or exposed by, code most recently added Developing code incrementally and testing along
Introduction to Parallel Programming. Martin Čuma Center for High Performance Computing University of Utah
 Introduction to Parallel Programming Martin Čuma Center for High Performance Computing University of Utah mcuma@chpc.utah.edu Overview Types of parallel computers. Parallel programming options. How to
Tools and Methodology for Ensuring HPC Programs Correctness and Performance. Beau Paisley
 Tools and Methodology for Ensuring HPC Programs Correctness and Performance Beau Paisley bpaisley@allinea.com About Allinea Over 15 years of business focused on parallel programming development tools Strong
Allinea Unified Environment
 Allinea Unified Environment Allinea s unified tools for debugging and profiling HPC Codes Beau Paisley Allinea Software bpaisley@allinea.com 720.583.0380 Today s Challenge Q: What is the impact of current
MPI Runtime Error Detection with MUST and Marmot For the 8th VI-HPS Tuning Workshop
 MPI Runtime Error Detection with MUST and Marmot For the 8th VI-HPS Tuning Workshop Tobias Hilbrich and Joachim Protze ZIH, Technische Universität Dresden September 2011 Content MPI Usage Errors Error
Reviewing gcc, make, gdb, and Linux Editors 1
 Reviewing gcc, make, gdb, and Linux Editors 1 Colin Gordon csgordon@cs.washington.edu University of Washington CSE333 Section 1, 3/31/11 1 Lots of material borrowed from 351/303 slides Colin Gordon (University
Scout. A Source-to-Source Transformator for SIMD-Optimizations. Zellescher Weg 12 Willers-Bau A 105 Tel
 Center for Information Services and High Performance Computing (ZIH) Scout A Source-to-Source Transformator for SIMD-Optimizations Zellescher Weg 12 Willers-Bau A 105 Tel. +49 351-463 - 32442 (olaf.krzikalla@tu-dresden.de)
Scalable Debugging with TotalView on Blue Gene. John DelSignore, CTO TotalView Technologies
 Scalable Debugging with TotalView on Blue Gene John DelSignore, CTO TotalView Technologies Agenda TotalView on Blue Gene A little history Current status Recent TotalView improvements ReplayEngine (reverse
Introduction to High Performance Computing at ZIH
 Center for Information Services and High Performance Computing (ZIH) Introduction to High Performance Computing at ZIH Architecture of the PC Farm (Deimos) Zellescher Weg 12 Trefftz-Bau/HRSK 151 Phone
Debugging, Profiling and Optimising Scientific Codes. Wadud Miah Research Computing Group
 Debugging, Profiling and Optimising Scientific Codes Wadud Miah Research Computing Group Scientific Code Performance Lifecycle Debugging Scientific Codes Software Bugs A bug in a program is an unwanted
Debugging process. The debugging process can be divided into four main steps: 1. Start your program, specifying anything that might affect its
 Debugging Introduction One of the most widely used methods to find out the reason of a strange behavior in a program is the insertion of printf or write statements in the supposed critical area. However
Development in code_aster Debugging a code_aster execution
 Development in code_aster Debugging a code_aster execution Code_Aster, Salome-Meca course material GNU FDL licence (http://www.gnu.org/copyleft/fdl.html) How to debug a code_aster execution? Requirements
Performance Metrics (I)
") COSC 6374 Parallel Computation Parallel Metrics and Debugging MPI application Edgar Gabriel Fall 2014 Performance Metrics (I) Strong Scaling: how much faster does a problem run on p processors compared
COSC 6374 Parallel Computation Parallel Metrics and Debugging MPI application Edgar Gabriel Fall 2014 Performance Metrics (I) Strong Scaling: how much faster does a problem run on p processors compared
Source level debugging. October 18, 2016
 Source level debugging October 18, 2016 Source level debugging Source debugging is a nice tool for debugging execution problems; it can be particularly useful when working with crashed programs that leave
Using the Debugger. Michael Jantz Dr. Prasad Kulkarni
 Using the Debugger Michael Jantz Dr. Prasad Kulkarni 1 Debugger What is it a powerful tool that supports examination of your program during execution. Idea behind debugging programs. Creates additional
Developing, Debugging, and Optimizing GPU Codes for High Performance Computing with Allinea Forge
 Developing, Debugging, and Optimizing GPU Codes for High Performance Computing with Allinea Forge Ryan Hulguin Applications Engineer ryan.hulguin@arm.com Agenda Introduction Overview of Allinea Products
Systems software design. Software build configurations; Debugging, profiling & Quality Assurance tools
 Systems software design Software build configurations; Debugging, profiling & Quality Assurance tools Who are we? Krzysztof Kąkol Software Developer Jarosław Świniarski Software Developer Presentation
LAB #8. Last Survey, I promise!!! Please fill out this really quick survey about paired programming and information about your declared major and CS.
 LAB #8 Each lab will begin with a brief demonstration by the TAs for the core concepts examined in this lab. As such, this document will not serve to tell you everything the TAs will in the demo. It is
MPI Runtime Error Detection with MUST
 MPI Runtime Error Detection with MUST At the 25th VI-HPS Tuning Workshop Joachim Protze IT Center RWTH Aachen University March 2017 How many issues can you spot in this tiny example? #include #include
Parallel Programming and Debugging with CUDA C. Geoff Gerfin Sr. System Software Engineer
 Parallel Programming and Debugging with CUDA C Geoff Gerfin Sr. System Software Engineer CUDA - NVIDIA s Architecture for GPU Computing Broad Adoption Over 250M installed CUDA-enabled GPUs GPU Computing
The Dynamic Debugger gdb
 Introduction The Dynamic Debugger gdb This handout introduces the basics of using gdb, a very powerful dynamic debugging tool. No-one always writes programs that execute perfectly every time, and while
Intel MPI Cluster Edition on Graham A First Look! Doug Roberts
 Intel MPI Cluster Edition on Graham A First Look! Doug Roberts SHARCNET / COMPUTE CANADA Intel Parallel Studio XE 2016 Update 4 Cluster Edition for Linux 1. Intel(R) MPI Library 5.1 Update 3 Cluster Ed
STARTING THE DDT DEBUGGER ON MIO, AUN, & MC2. (Mouse over to the left to see thumbnails of all of the slides)
") STARTING THE DDT DEBUGGER ON MIO, AUN, & MC2 (Mouse over to the left to see thumbnails of all of the slides) ALLINEA DDT Allinea DDT is a powerful, easy-to-use graphical debugger capable of debugging a
STARTING THE DDT DEBUGGER ON MIO, AUN, & MC2 (Mouse over to the left to see thumbnails of all of the slides) ALLINEA DDT Allinea DDT is a powerful, easy-to-use graphical debugger capable of debugging a
LAB #8. GDB can do four main kinds of things (plus other things in support of these) to help you catch bugs in the act:
 to help you catch bugs in the act:") LAB #8 Each lab will begin with a brief demonstration by the TAs for the core concepts examined in this lab. As such, this document will not serve to tell you everything the TAs will in the demo. It is
LAB #8 Each lab will begin with a brief demonstration by the TAs for the core concepts examined in this lab. As such, this document will not serve to tell you everything the TAs will in the demo. It is
The Cray Programming Environment. An Introduction
 The Cray Programming Environment An Introduction Vision Cray systems are designed to be High Productivity as well as High Performance Computers The Cray Programming Environment (PE) provides a simple consistent
Using gdb to find the point of failure
 gdb gdb is the GNU debugger on our CS machines. gdb is most effective when it is debugging a program that has debugging symbols linked in to it. With gcc and g++, this is accomplished using the -g option,
Introduction to Parallel Programming. Martin Čuma Center for High Performance Computing University of Utah
 Introduction to Parallel Programming Martin Čuma Center for High Performance Computing University of Utah mcuma@chpc.utah.edu Overview Types of parallel computers. Parallel programming options. How to