SGI Altix Getting Correct Code Reiner Vogelsang SGI GmbH
|
|
|
- Jody Bailey
- 5 years ago
- Views:
Transcription


1 SGI Altix Getting Correct Code Reiner Vogelsang SGI GmbH
2 Module Objectives After completing the module, you will able to Find caveats and hidden errors in application codes Handle debuggers Follow system calls and interrupts Understand the relationship between correct code and performance Page 2
3 Correct Code Before performance tuning ensure that your code gives correct answers! Stick to standards first before you boost your code with non-standard features! Try to answer the following questions: Same results with different levels of compiler optimizations? Given that a code is parallel are the results independent from the numbers of threads or processes? Have you ever run your code with array bound and subroutine argument checking? Have you checked that your code is not causing floating point exceptions? Does your code work with a different link order of objects? Have you made any assumptions regarding storage of data objects in memory? Page 3
4 Array Bound Checking ifort supports array bound checking and check for temporary argument creation: Compile with -check all -traceback forrtl: severe (408): fort: (2): Subscript #1 of the array DIST has value 601 which is greater than the upper bound of 600 Image PC Routine Line Source mat_dist 0x f9b0 Unknown Unknown Unknown mat_dist 0x f40 Unknown Unknown Unknown mat_dist 0x Unknown Unknown Unknown mat_dist 0x a20 dodist_ 40 dodist.f mat_dist 0x MAIN 86 main.f mat_dist 0x d0 Unknown Unknown Unknown libc.so.6.1 0x fa890 Unknown Unknown Unknown Page 4
5 Hidden Floating Point Exceptions Check with dmesg for messages within the system log: a.out(28282): floating-point assist fault at ip d11, isr Single Step Trap mat_dist(28703): floating-point assist fault at ip , isr Divide by zero Look into Intel Itanium Architecture Software Developer's Manual for a description of the ISR. Assist faults are managed by the kernel. Can be a killer of performance and scalability if assist faults ocure at high rates. Reason for assist faults: Wrong precision chosen for the floating point operations Code was run in single precision, should be double precision. Programming errors and/or bad algorithmic design Speculative floating point operations due to high opt. levels Try to compile with -IPF_fp_speculation [saveoff] Page 5
6 Hidden Floating Point Exceptions Make hidden floating point exceptions visible by compiling with -fpe0 -traceback 107> ifort -fpe0 -traceback -g -O2 matmult.f 108>./a.out forrtl: error (73): floating divide by zero Image PC Routine Line Source a.out 0x e2 setup_ 79 matmult.f a.out 0x MAIN 17 matmult.f a.out 0x Unknown Unknown Unknown libc.so.6.1 0x fe990 Unknown Abort (core dumped) 109> Unknown Unknown Page 6
7 Unaligned address faults Example PARAMETER(MAXUNT=20) CHARACTER*4 GCHARS COMMON/SCRT2/GCHARS(2048) C CHARACTER*20 SI2IMP(3,MAXUNT) DATA SI2IMP / + 'J ','BTU ',' E-04', + 'J/(kg K) ','BTU/lbm F ',' E-04', DO I = 1,MAXUNT DO K = 1,3 DO J = 1,17,4 N1 = N1+1 GCHARS(N1) = & SI2IMP(K,I)(J:J+3) END DO END DO END DO Page 7
8 Unaligned address faults (cont.) Example causes the following messages: unaligned access to 0x a9b0b9, ip=0x a81 Such faults can be trapped by running under control of prctl prctl --unaligned=always-signal./a.out Consult section Memory Datum Alignment and Atomicity in Intel IA-64 Architecture Software Developer s Manual: Volume 2 To turn off any loging create a new instance of a shell by prctl --fpemu=silent --unaligned=silent Page 8
9 Detecting Memory Corruption Glibc malloc()/ free() MALLOC_CHECK_ environment variable: Set to 0: silently ignore any heap corruption Set to 1: print diagnostic message when heap corruption detected Set to 2: abort immediately upon heap corruption Only detects simple errors such as one-byte overruns and multiple free() calls Page 9
10 Detecting Memory Corruption (cont.) Electric Fence Detects invalid reads as well as writes Pinpoints exact instruction causing problem Places invalid pages immediately after or before allocated blocks Controlled via environment variables To use: Link with lefence man efence for environment variable details Page 10
11 Available debuggers idb: The Intel debugger -- available if you have licenses for the Intel compilers Fully symbolic debugger Supports debugging of Fortran, C and C++ programs gdb: The GNU project debugger Supports debugging of C, C++, and Modula-2 Supports Fortran 95 debugging when gdbf95 patch is installed The patch can be found at ddd: A graphical interface to gdb and other debuggers Simple command line option allows selecting debugger to use Totalview by Etnus Your Rolls among the debuggers Let you even debug multiple MPI tasks Excellent F90 array browser Page 11
12 Debugger Syntax The basic command-line syntax to start the various debuggers is as follows: gdb [exec_file [core_fileprocess_id]] idb [-pid process_id] [-gdb] [exec_file [core_file]] ddd [-debugger name] [exec_file [core_file process_id]] [-pid] process_id lets you debug a running process with the specified process id (as long as there does not exist a file whose name is process_id, if gdb or ddd are used) exec_file specifies the executable file (optional) You can specify a core file (with its executable) to help determine and localize the cause of segmentation violations or other abnormal termination conditions; if an executable core file exists, it is used by default Page 12
13 gdb Help is available gdb's own help command info gdb at the shell command prompt Debugging gcc-optimized code (-g -O[123]) works fine Some challenges with ifort at levels 2 and 3 Can't print values of register variables Assembly level debugging works gdb understands rotating registers: useful for stepping through software-pipelined loops. Page 13
14 idb Intel debugger, part of Intel compiler installation Supports C, C++, Fortran 77, Fortran 90 dbx- (default) and gdb-like interfaces Debugging of optimized code limited Good for getting Fortran stack traces Supports multithreaded applications (pthreads and OpenMP) Page 14
15 Data Display Debugger -- ddd Front end GUI to gdb and other debuggers, written by Dorothea Lütkehaus and Andreas Zeller Home page at Features an interactive graphical data display, where data structures are displayed as graphs Works best with gdb, but can work with idb in dbx mode ddd -debugger idb -dbx./a.out Page 15

16 Main Window By default displays the Menu Bar, Tool Bar, Source Window, Debugger Console and Status Line. The Data Window, when invoked, appears above the Source Window, and an optional Machine Code Window appears below the Source Window. Page 16

.")
17 Command Tool/Program Menu A free-standing window displayed when ddd starts. Can be respositioned with Alt-8 or selecting ViewCommand Tool on the Main Window. Can be configured to appear as a command tool bar above the source window (Edit > Preferences > Source Tool Buttons Location). The tool provides easy access to many frequently-used debugger commands The same functions are accessible from the Program Menu and the keyboard shortcuts listed in i.t Page 17
18 Execution Window By default the program being debugged will run in the Debugger Console. Selecting View Execution Window will open an xterm window and enable the Run in Execution Window item in the Program menu. Alternately, enabling Run in Execution Window in the Program menu will cause an Execution Window to be opened when you click on Run in the Command Tool. Page 18
19 Tool Bar The Tool Bar has two parts: The argument field, labeled (), where any item may be entered. The tool icons, which represent functions that can be applied to the item in the argument field; only those functions that make sense for the argument will be enabled. Page 19
20 Debugger Console A command-line interface to the debugger is at the bottom of the main window. You can use the underlying debugger's commands here. You can type in debugger commands instead of using the GUI. Page 20

21 File Menu The File menu groups file-related operations Page 21

22 Edit Menu The Edit menu allows setting preferences and debugger configuration parameters, besides the usual editing functions Page 22

23 View and Command Menus The View menu allows displaying the optional standalone windows and showing or hiding the main view windows The Command menu helps perform operations related to ddd commands Page 23

24 Status Menue The status menu has options for examining and modifying the program state; call stack, machine register contents, threads and signals, as well as moving up and down the call stack Page 24
25 Setting/Clearing Breakpoints There are several ways to set breakpoints: Left-click on the whitespace to the left of the source line where you want to set a breakpoint so that it appears in the Argument Field, then use the Stop icon on the Tool Bar (which should be labeled ``Break'') Triple left-click on the whitespace to the left of the source line where you want to set a breakpoint. Right click-and-hold, choose from the resulting pop-up menu. Type the appropriate break command in the Debugger Console To clear a breakpoint: Left click on the stop sign next to the line with the breakpoint to make it appear in the Argument Field, then use the Stop icon on the Tool Bar (which should now be labeled ``Clear'') Right click-and-hold, choose from the resulting pop-up menu Type the appropriate delete command in the Debugger Console Page 25
26 Examining Variables There are three ways of showing the value of a variable: Point to it with the cursor: The answer will appear in the Status Line at the bottom margin of the main window Print it on the debugger console with the print() command Display it graphically with the display() command Printing or displaying can be achieved by Left-clicking on the data item, which places it on the Argument Field, and then selecting the appropriate tool Using the right mouse button to click-and-hold on the data item, and selecting from the resulting pop-up menu Page 26

27 Backtrace Window The call stack is shown in the Backtrace window, displayed from Status Backtrace Page 27
28 Edit - Compile - Debug Loop Editing, compiling, and debugging are tightly integrated in ddd: EDIT Clicking on Edit in the Command Tool opens a window with your favorite X-Windows editor if the environment variable XEDITOR is defined, or else an xterm with either the editor given by the environment variable EDITOR, or vi. The program being displayed in the Source Window will be loaded into the editor window. COMPILE Clicking on Make in the Command Tool executes make. A makefile should be present; you can choose a target from the File Make menu option. The new executable is attached automatically when you click on Run. Note that idb does not support the make command; however, a shell make target command may be typed in the Debugger Console. DEBUG Continue debugging your code. Page 28
29 Traps Traps are used to inspect data at points during execution of the program. There are two types of traps: Breakpoint Halts the process so you can examine data manually You can add conditions to control in detail whether the program stops at the breakpoint Watchpoint Stops the program when the value of an expression changes Page 29
30 Setting and Clearing Breakpoints Triple click on a line with the left mouse button (to set) Click and hold the right mouse button, select from the pop-up menu Use the Stop sign icon on the Control Panel Use the Console panel commands (break/clear) Page 30
31 Breakpoints - What Can You Examine? Variables (value, type, addresses) Value of expressions Call Stack Data structures (graphically) Arrays Machine code Memory/registers Page 31
32 Breakpoint Properties Once a breakpoint is set, right click-and-hold on the Stop sign icon at the breakpoint and select Properties from the pop-up menu, or with the breakpoint in the Argument Field, use the Stop Tool menu to select Breakpoint Properties A pop-up window appears where you can set a condition for stopping, a count for the number of times to ignore the breakpoint before stopping, or debugger commands to execute when arriving at the breakpoint. Page 32

33 Watchpoints A frequent pointer mistake in C or C++ is overwriting data out of range Typically, the overwritten address range is known, but the pointer is not Watchpoints watch over a memory location for overwriting You can set watchpoints by left-clicking on the variable if it is visible or typing it in the Argument Field and then clicking on the Watch button Different types of watchpoints may be selected from the menu associated with the Watch button Once a watchpoint is set, watchpoint properties may be modified in the Watchpoint Properties window Page 33
 Print: Print a message when the signal happens. (Unsetting Print also unsets Stop.")
34 Signals Status > Signals pops up a panel showing a list of all signals and how gdb has been told to handle each one. Stop: Stop the program when the signal happens. (Setting Stop also sets Print.) Print: Print a message when the signal happens. (Unsetting Print also unsets Stop.) Pass: If set, allow the program to see the signal and handle it, if it has installed a handler, or be killed, if no handler has been installed. Page 34
35 Data Display The Data Display provides a graphical representation of variables, arrays, structures and linked lists The Data Display opens automatically when an item is selected for display Left click on the item, click on the Display button Right click-and-hold, select Display from the popup menu Double click on the variable There are many display and formatting options Page 35
36 Machine Code Window Source Display Machine Code opens up an additional window, usually below the Source Window, that contains the machine code for the current function Breakpoints can also be set and cleared in this window If source code is not available, only the machine code window is updated Page 36

37 Register Window The Register View lets you view processor registers The window pops up selecting Status Registers Page 37
38 Debugging MPI with gdb In the first window set MPI_ATTACH_DEBUG equal to the rank to be debugged. Open a second window. Start your MPI code in the first window. reiner@dcm24 75> setenv MPI_SLAVE_DEBUG_ATTACH 0 reiner@dcm24 75> mpirun -np 4 mxm4.mpi.x MPI rank 0 sleeping for 20 seconds while you attach the debugger. You can use this debugger command gdb /proc/30541/exe or idb -pid /proc/30541/exe Mouse the the gdb or idb line into your second window. Page 38
39 Debugging MPI with gdb In second window you receive something like: (gdb) continue Continuing. Program received signal SIGFPE, Arithmetic exception. [Switching to Thread (LWP 30599)] 0x a81 in setup_ () (gdb) Page 39
40 Debugging MPI Applications with Totalview Start your session like totalview mpirun -a -np 4 mxm4.mpi.x Start the application by clicking 'Go' in the tool bar of main window. Page 40

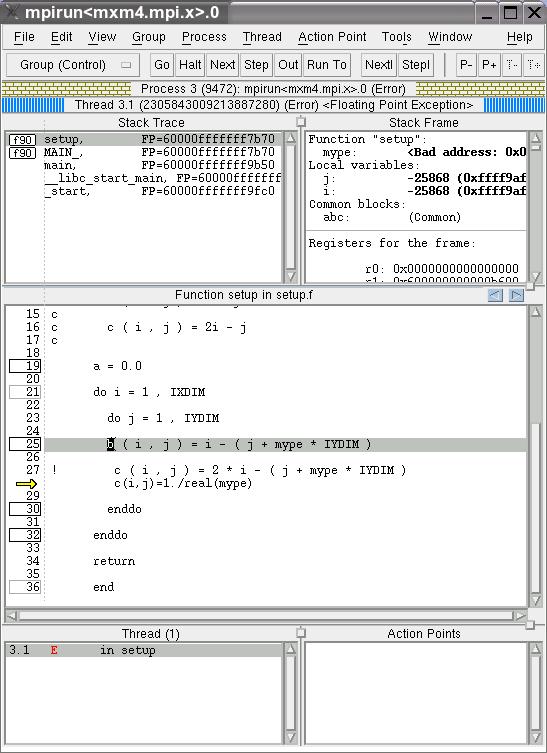
41 Totalview Page 41
42 Lab: Setting Break Points (C, C++, Fortran) Using Browsers and Views (C/C++/Fortran) Objectives Start up a program in the ddd. Use the Debugger to set a break point. Step into and step over function calls. Exercise the various ways to examine variables. Use the Backtrace window. Use the Display Window, Machine Code Window, and Register Window. Page 42

43 Page 43
Hands-on Workshop on How To Debug Codes at the Institute
 Hands-on Workshop on How To Debug Codes at the Institute H. Birali Runesha, Shuxia Zhang and Ben Lynch (612) 626 0802 (help) help@msi.umn.edu October 13, 2005 Outline Debuggers at the Institute Totalview
Debugging with GDB and DDT
 Debugging with GDB and DDT Ramses van Zon SciNet HPC Consortium University of Toronto June 28, 2012 1/41 Ontario HPC Summerschool 2012 Central Edition: Toronto Outline Debugging Basics Debugging with the
Welcome. HRSK Practical on Debugging, Zellescher Weg 12 Willers-Bau A106 Tel
 Center for Information Services and High Performance Computing (ZIH) Welcome HRSK Practical on Debugging, 03.04.2009 Zellescher Weg 12 Willers-Bau A106 Tel. +49 351-463 - 31945 Matthias Lieber (matthias.lieber@tu-dresden.de)
Introduction to debugging. Martin Čuma Center for High Performance Computing University of Utah
 Introduction to debugging Martin Čuma Center for High Performance Computing University of Utah m.cuma@utah.edu Overview Program errors Simple debugging Graphical debugging DDT and Totalview Intel tools
Laboratory Assignment #4 Debugging in Eclipse CDT 1
 Lab 4 (10 points) November 20, 2013 CS-2301, System Programming for Non-majors, B-term 2013 Objective Laboratory Assignment #4 Debugging in Eclipse CDT 1 Due: at 11:59 pm on the day of your lab session
Debugging with GDB and DDT
 Debugging with GDB and DDT Ramses van Zon SciNet HPC Consortium University of Toronto June 13, 2014 1/41 Ontario HPC Summerschool 2014 Central Edition: Toronto Outline Debugging Basics Debugging with the
Debug for GDB Users. Action Description Debug GDB $debug <program> <args> >create <program> <args>
 Page 1 of 5 Debug for GDB Users Basic Control To be useful, a debugger must be capable of basic process control. This functionally allows the user to create a debugging session and instruct the process
You can also start with both an executable program and a core file specified:
 NAME ddd, xddd - the data display debugger SYNOPSIS ddd [ gdb ][ dbx ][ xdb ][ jdb ][ pydb ][ perl ][ debugger name ][ [r]host [username@]hostname ]] [ help ][ trace ][ version ][ configuration ][options...
Debugging with TotalView
 Debugging with TotalView Le Yan HPC Consultant User Services Goals Learn how to start TotalView on Linux clusters Get familiar with TotalView graphic user interface Learn basic debugging functions of TotalView
Debugging with Totalview. Martin Čuma Center for High Performance Computing University of Utah
 Debugging with Totalview Martin Čuma Center for High Performance Computing University of Utah mcuma@chpc.utah.edu Overview Totalview introduction. Basic operation. Serial debugging. Parallel debugging.
Data and File Structures Laboratory
 Tools: GDB, Valgrind Assistant Professor Machine Intelligence Unit Indian Statistical Institute, Kolkata August, 2018 1 GDB 2 Valgrind A programmer s experience Case I int x = 10, y = 25; x = x++ + y++;
Debugging and Profiling
 Debugging and Profiling Dr. Axel Kohlmeyer Senior Scientific Computing Expert Information and Telecommunication Section The Abdus Salam International Centre for Theoretical Physics http://sites.google.com/site/akohlmey/
Intro to Segmentation Fault Handling in Linux. By Khanh Ngo-Duy
 Intro to Segmentation Fault Handling in Linux By Khanh Ngo-Duy Khanhnd@elarion.com Seminar What is Segmentation Fault (Segfault) Examples and Screenshots Tips to get Segfault information What is Segmentation
Your code must have been compiled with the -g compiler option. Example:
 ddd Tips This provides some helpful information about the Unix ddd debugger. with more detailed information: There are other resources available gnu ddd manual matloff ddd information Contents Prerequisites...
CSE 410: Systems Programming
 CSE 410: Systems Programming Recitation 4: Introduction to gdb Introduction The GNU Debugger, or gdb, is a powerful symbolic debugger. Symbolic debuggers are available for many languages and platforms,
Using the Debugger. Michael Jantz Dr. Prasad Kulkarni
 Using the Debugger Michael Jantz Dr. Prasad Kulkarni 1 Debugger What is it a powerful tool that supports examination of your program during execution. Idea behind debugging programs. Creates additional
Intro to MS Visual C++ Debugging
 Intro to MS Visual C++ Debugging 1 Debugger Definition A program used to control the execution of another program for diagnostic purposes. Debugger Features / Operations Single-Stepping 100011101010101010
CSE 351. GDB Introduction
 CSE 351 GDB Introduction Lab 2 Out either tonight or tomorrow Due April 27 th (you have ~12 days) Reading and understanding x86_64 assembly Debugging and disassembling programs Today: General debugging
Source level debugging. October 18, 2016
 Source level debugging October 18, 2016 Source level debugging Source debugging is a nice tool for debugging execution problems; it can be particularly useful when working with crashed programs that leave
Debugging. P.Dagna, M.Cremonesi. May 2015
 Debugging P.Dagna, M.Cremonesi May 2015 Introduction Oneofthemostwidelyusedmethodstofindoutthereasonofa strange behavior in a program is the insertion of printf or write statements in the supposed critical
Debugging. Marcelo Ponce SciNet HPC Consortium University of Toronto. July 15, /41 Ontario HPC Summerschool 2016 Central Edition: Toronto
 Debugging Marcelo Ponce SciNet HPC Consortium University of Toronto July 15, 2016 1/41 Ontario HPC Summerschool 2016 Central Edition: Toronto Outline Debugging Basics Debugging with the command line: GDB
Exercise Session 6 Computer Architecture and Systems Programming
 Systems Group Department of Computer Science ETH Zürich Exercise Session 6 Computer Architecture and Systems Programming Herbstsemester 2016 Agenda GDB Outlook on assignment 6 GDB The GNU Debugger 3 Debugging..
Basic functions of a debugger
 UNIVERSITY OF CALIFORNIA Department of Electrical Engineering and Computer Sciences Computer Science Division CS61B Spring 1998 P. N. Hilfinger Simple Use of GDB A debugger is a program that runs other
CS/COE 0449 term 2174 Lab 5: gdb
 CS/COE 0449 term 2174 Lab 5: gdb What is a debugger? A debugger is a program that helps you find logical mistakes in your programs by running them in a controlled way. Undoubtedly by this point in your
Debugging process. The debugging process can be divided into four main steps: 1. Start your program, specifying anything that might affect its
 Debugging Introduction One of the most widely used methods to find out the reason of a strange behavior in a program is the insertion of printf or write statements in the supposed critical area. However
TotalView. Debugging Tool Presentation. Josip Jakić
 TotalView Debugging Tool Presentation Josip Jakić josipjakic@ipb.ac.rs Agenda Introduction Getting started with TotalView Primary windows Basic functions Further functions Debugging parallel programs Topics
HPCC - Hrothgar. Getting Started User Guide TotalView. High Performance Computing Center Texas Tech University
 HPCC - Hrothgar Getting Started User Guide TotalView High Performance Computing Center Texas Tech University HPCC - Hrothgar 2 Table of Contents *This user guide is under development... 3 1. Introduction...
Program Design: Using the Debugger
 rogram Design, February 2, 2004 1 Program Design: Using the Debugger A debugger is an alternative to putting print (printf in C) statements in your program, recompiling and trying to find out what values
Parallel Debugging with TotalView BSC-CNS
 Parallel Debugging with TotalView BSC-CNS AGENDA What debugging means? Debugging Tools in the RES Allinea DDT as alternative (RogueWave Software) What is TotalView Compiling Your Program Starting totalview
DEBUGGING ON FERMI PREPARING A DEBUGGABLE APPLICATION GDB. GDB on front-end nodes
 DEBUGGING ON FERMI Debugging your application on a system based on a BG/Q architecture like FERMI could be an hard task due to the following problems: the core files generated by a crashing job on FERMI
CNIT 127: Exploit Development. Ch 2: Stack Overflows in Linux
 CNIT 127: Exploit Development Ch 2: Stack Overflows in Linux Stack-based Buffer Overflows Most popular and best understood exploitation method Aleph One's "Smashing the Stack for Fun and Profit" (1996)
CS2141 Software Development using C/C++ Debugging
 CS2141 Software Development using C/C++ Debugging Debugging Tips Examine the most recent change Error likely in, or exposed by, code most recently added Developing code incrementally and testing along
Your code must have been compiled with the -g compiler option. Example:
 ddd Tips This provides some helpful information about the Unix ddd debugger. with more detailed information: There are other resources available gnu ddd manual matloff ddd information Contents Prerequisites...
The NetBeans Debugger: A Brief Tutorial
 The NetBeans Debugger: A Brief Tutorial Based on a tutorial by Anousha Mesbah from the University of Georgia NetBeans provides a debugging tool that lets you trace the execution of a program step by step.
SGI Altix Application Programming Reiner Vogelsang SGI GmbH
 SGI Altix Application Programming Reiner Vogelsang SGI GmbH reiner@sgi.com February 13th, SGI ccnuma Balanced System Architecture Page 2 Parallel Architectures Shared Memory (S.M.) C Easy to Program Difficult
CS354 gdb Tutorial Written by Chris Feilbach
 CS354 gdb Tutorial Written by Chris Feilbach Purpose This tutorial aims to show you the basics of using gdb to debug C programs. gdb is the GNU debugger, and is provided on systems that
COSC243 Part 2: Operating Systems
 COSC243 Part 2: Operating Systems Lecture 16: Threads and data sharing Zhiyi Huang Dept. of Computer Science, University of Otago Zhiyi Huang (Otago) COSC243 Lecture 16 1 / 24 Overview Last lecture: Hierarchical
GDB Tutorial. A Walkthrough with Examples. CMSC Spring Last modified March 22, GDB Tutorial
 A Walkthrough with Examples CMSC 212 - Spring 2009 Last modified March 22, 2009 What is gdb? GNU Debugger A debugger for several languages, including C and C++ It allows you to inspect what the program
TotalView. Users Guide. August 2001 Version 5.0
 TotalView Users Guide August 2001 Version 5.0 Copyright 1999 2001 by Etnus LLC. All rights reserved. Copyright 1998 1999 by Etnus Inc. All rights reserved. Copyright 1996 1998 by Dolphin Interconnect Solutions,
MIT OpenCourseWare Multicore Programming Primer, January (IAP) Please use the following citation format:
 Please use the following citation format:") MIT OpenCourseWare http://ocw.mit.edu 6.189 Multicore Programming Primer, January (IAP) 2007 Please use the following citation format: Phil Sung, 6.189 Multicore Programming Primer, January (IAP) 2007.
MIT OpenCourseWare http://ocw.mit.edu 6.189 Multicore Programming Primer, January (IAP) 2007 Please use the following citation format: Phil Sung, 6.189 Multicore Programming Primer, January (IAP) 2007.
System Assertions. Andreas Zeller
 System Assertions Andreas Zeller System Invariants Some properties of a program must hold over the entire run: must not access data of other processes must handle mathematical exceptions must not exceed
Reviewing gcc, make, gdb, and Linux Editors 1
 Reviewing gcc, make, gdb, and Linux Editors 1 Colin Gordon csgordon@cs.washington.edu University of Washington CSE333 Section 1, 3/31/11 1 Lots of material borrowed from 351/303 slides Colin Gordon (University
Process Concepts. CSC400 - Operating Systems. 3. Process Concepts. J. Sumey
 CSC400 - Operating Systems 3. Process Concepts J. Sumey Overview Concurrency Processes & Process States Process Accounting Interrupts & Interrupt Processing Interprocess Communication CSC400 - Process
Recitation 11: More Malloc Lab
 Recitation 11: More Malloc Lab Instructor: TA(s) 1 Understanding Your Code Sketch out the heap Add Instrumentation Use tools 2 Sketch out the Heap Start with a heap, in this case implicit list 0 4 4 4
Introduction to C/C++ Programming
 Chapter 1 Introduction to C/C++ Programming This book is about learning numerical programming skill and the software development process. Therefore, it requires a lot of hands-on programming exercises.
0/41. Isolating Infections. Andreas Zeller. Lehrstuhl Softwaretechnik Universität des Saarlandes, Saarbrücken
 0/41 Isolating Infections Andreas Zeller Lehrstuhl Softwaretechnik Universität des Saarlandes, Saarbrücken Isolating the Infection 1/41 Variable and input values Program execution Sane state Program states
12. Debugging. Overview. COMP1917: Computing 1. Developing Programs. The Programming Cycle. Programming cycle. Do-it-yourself debugging
 COMP1917 12s2 Debugging 1 COMP1917: Computing 1 12. Debugging Overview Programming cycle Do-it-yourself debugging Debugging withgdb Nastier bugs Memory leaks COMP1917 12s2 Debugging 2 Developing Programs
CS 270 Systems Programming. Debugging Tools. CS 270: Systems Programming. Instructor: Raphael Finkel
 Debugging Tools CS 270: Systems Programming Instructor: Raphael Finkel Gdb: The Gnu debugger It runs on most computers and operating systems. It allows you to examine a running executable program. It does
1. Allowed you to see the value of one or more variables, or 2. Indicated where you were in the execution of a program
 CS0449 GDB Lab What is a debugger? A debugger is a program that helps you find logical mistakes in your programs by running them in a controlled way. Undoubtedly by this point in your programming life,
INSTALLING INSTALLING INSTALLING
 NightView Version 5.4 Release Notes (PowerMAX) June 2002 0890395-5.4 READ READ READ ME ME ME BEFORE BEFORE BEFORE INSTALLING INSTALLING INSTALLING THIS THIS THIS PRODUCT PRODUCT PRODUCT Copyright Disclaimer
COSC 6374 Parallel Computation. Debugging MPI applications. Edgar Gabriel. Spring 2008
 COSC 6374 Parallel Computation Debugging MPI applications Spring 2008 How to use a cluster A cluster usually consists of a front-end node and compute nodes Name of the front-end node: shark.cs.uh.edu You
Using gdb to find the point of failure
 gdb gdb is the GNU debugger on our CS machines. gdb is most effective when it is debugging a program that has debugging symbols linked in to it. With gcc and g++, this is accomplished using the -g option,
Debugging with gdb and valgrind
 Debugging with gdb and valgrind Dr. Axel Kohlmeyer Associate Dean for Scientific Computing, CST Associate Director, Institute for Computational Science Assistant Vice President for High-Performance Computing
3 TUTORIAL. In This Chapter. Figure 1-0. Table 1-0. Listing 1-0.
 3 TUTORIAL Figure 1-0. Table 1-0. Listing 1-0. In This Chapter This chapter contains the following topics: Overview on page 3-2 Exercise One: Building and Running a C Program on page 3-4 Exercise Two:
Debugging. John Lockman Texas Advanced Computing Center
 Debugging John Lockman Texas Advanced Computing Center Debugging Outline GDB Basic use Attaching to a running job DDT Identify MPI problems using Message Queues Catch memory errors PTP For the extremely
NEW CEIBO DEBUGGER. Menus and Commands
 NEW CEIBO DEBUGGER Menus and Commands Ceibo Debugger Menus and Commands D.1. Introduction CEIBO DEBUGGER is the latest software available from Ceibo and can be used with most of Ceibo emulators. You will
NetBeans Tutorial. For Introduction to Java Programming By Y. Daniel Liang. This tutorial applies to NetBeans 6, 7, or a higher version.
 NetBeans Tutorial For Introduction to Java Programming By Y. Daniel Liang This tutorial applies to NetBeans 6, 7, or a higher version. This supplement covers the following topics: Getting Started with
Blue Gene/Q User Workshop. Debugging
 Blue Gene/Q User Workshop Debugging Topics GDB Core Files Coreprocessor 2 GNU Debugger (GDB) The GNU Debugger (GDB) The Blue Gene/Q system includes support for running GDB with applications that run on
HOW TO USE CODE::BLOCKS IDE FOR COMPUTER PROGRAMMING LABORATORY SESSIONS
 HOW TO USE CODE::BLOCKS IDE FOR COMPUTER PROGRAMMING LABORATORY SESSIONS INTRODUCTION A program written in a computer language, such as C/C++, is turned into executable using special translator software.
UNIVERSITY OF CALIFORNIA Department of Electrical Engineering and Computer Sciences Computer Science Division. P. N. Hilfinger.
 UNIVERSITY OF CALIFORNIA Department of Electrical Engineering and Computer Sciences Computer Science Division CS164 Spring 2008 P. N. Hilfinger The GJDB Debugger A debugger is a program that runs other
1 Basic functions of a debugger
 UNIVERSITY OF CALIFORNIA Department of Electrical Engineering and Computer Sciences Computer Science Division CS61B Fall 2014 P. N. Hilfinger The GJDB Debugger A debugger is a program that runs other programs,
NightStar. NightView Source Level Debugger. Real-Time Linux Debugging and Analysis Tools BROCHURE
 NightStar Real-Time Linux Debugging and Analysis Tools Concurrent s NightStar is a powerful, integrated tool set for debugging and analyzing time-critical Linux applications. NightStar tools run with minimal
Debugging Your CUDA Applications With CUDA-GDB
 Debugging Your CUDA Applications With CUDA-GDB Outline Introduction Installation & Usage Program Execution Control Thread Focus Program State Inspection Run-Time Error Detection Tips & Miscellaneous Notes
Debugging. ICS312 Machine-Level and Systems Programming. Henri Casanova
 Debugging ICS312 Machine-Level and Systems Programming Henri Casanova (henric@hawaii.edu) Debugging Even when written in high-level languages, programs have bugs Recall the thought that when moving away
Unit 2 : Computer and Operating System Structure
 Unit 2 : Computer and Operating System Structure Lesson 1 : Interrupts and I/O Structure 1.1. Learning Objectives On completion of this lesson you will know : what interrupt is the causes of occurring
PathFinder-XD for MIPS Powered Devices. Simulator
 v.1.0.6, 15 th January 2013 PathFinder-XD for MIPS Powered Devices Simulator Contents 1. Introduction 2 2. Installation 2 2.1 Windows Installation 2 2.2 Linux Installation 2 3. Using PathFinder-XD with
7 The Integrated Debugger
 7 The Integrated Debugger Your skill set for writing programs would not be complete without knowing how to use a debugger. While a debugger is traditionally associated with finding bugs, it can also be
Debugging with TotalView
 Debugging with TotalView Dieter an Mey Center for Computing and Communication Aachen University of Technology anmey@rz.rwth-aachen.de 1 TotalView, Dieter an Mey, SunHPC 2006 Debugging on Sun dbx line mode
Workshop on High Performance Computing (HPC08) School of Physics, IPM February 16-21, 2008 HPC tools: an overview
 School of Physics, IPM February 16-21, 2008 HPC tools: an overview") Workshop on High Performance Computing (HPC08) School of Physics, IPM February 16-21, 2008 HPC tools: an overview Stefano Cozzini CNR/INFM Democritos and SISSA/eLab cozzini@democritos.it Agenda Tools for
Workshop on High Performance Computing (HPC08) School of Physics, IPM February 16-21, 2008 HPC tools: an overview Stefano Cozzini CNR/INFM Democritos and SISSA/eLab cozzini@democritos.it Agenda Tools for
Scalable Debugging with TotalView on Blue Gene. John DelSignore, CTO TotalView Technologies
 Scalable Debugging with TotalView on Blue Gene John DelSignore, CTO TotalView Technologies Agenda TotalView on Blue Gene A little history Current status Recent TotalView improvements ReplayEngine (reverse
CS 11 C track: lecture 6
 CS 11 C track: lecture 6 Last week: pointer arithmetic This week: The gdb program struct typedef linked lists gdb for debugging (1) gdb: the Gnu DeBugger http://courses.cms.caltech.edu/cs11/material /c/mike/misc/gdb.html
Operating Systems. Designed and Presented by Dr. Ayman Elshenawy Elsefy
 Operating Systems Designed and Presented by Dr. Ayman Elshenawy Elsefy Dept. of Systems & Computer Eng.. AL-AZHAR University Website : eaymanelshenawy.wordpress.com Email : eaymanelshenawy@yahoo.com Reference
Laboratory 1 Semester 1 11/12
 CS2106 National University of Singapore School of Computing Laboratory 1 Semester 1 11/12 MATRICULATION NUMBER: In this lab exercise, you will get familiarize with some basic UNIX commands, editing and
Debugging Applications Using Totalview
 Debugging Applications Using Totalview Timothy H. Kaiser tkaiser@sdsc.edu Slides by:nicholas J Wright First things first.. There is no point in optimising a program that has a bug in it a really fast code
An Interrupt is either a Hardware generated CALL (externally derived from a hardware signal)
") An Interrupt is either a Hardware generated CALL (externally derived from a hardware signal) OR A Software-generated CALL (internally derived from the execution of an instruction or by some other internal
An Interrupt is either a Hardware generated CALL (externally derived from a hardware signal) OR A Software-generated CALL (internally derived from the execution of an instruction or by some other internal
Debugging Core Files Using HP WDB
 Debugging Core Files Using HP WDB HP Part Number: 5992-4661 Published: September 2008 Edition: 2.0 Copyright 2008 Hewlett-Packard Development Company, L.P Legal Notices Confidential computer software.
Recitation #12 Malloc Lab - Part 2. November 14th, 2017
 18-600 Recitation #12 Malloc Lab - Part 2 November 14th, 2017 1 2 REMINDER Malloc Lab checkpoint is due on 11/17 This is Friday (instead of the usual Thursday deadline) No late days available Final submission
The Dynamic Debugger gdb
 Introduction The Dynamic Debugger gdb This handout introduces the basics of using gdb, a very powerful dynamic debugging tool. No-one always writes programs that execute perfectly every time, and while
Debugging / Profiling
 The Center for Astrophysical Thermonuclear Flashes Debugging / Profiling Chris Daley 23 rd June An Advanced Simulation & Computing (ASC) Academic Strategic Alliances Program (ASAP) Center at Motivation
Tips on Using GDB to Track Down and Stamp Out Software Bugs
 Tips on Using GDB to Track Down and Stamp Out Software Bugs Brett Viren Physics Department MINOS Week In The Woods, 2005 Brett Viren (Brookhaven National Lab) Using GDB to Debug Ely 2005 1 / 34 Outline
COS 318: Operating Systems
 COS 318: Operating Systems OS Structures and System Calls Prof. Margaret Martonosi Computer Science Department Princeton University http://www.cs.princeton.edu/courses/archive/fall11/cos318/ Outline Protection
Using the GNU Debugger
 Using the GNU Debugger 6.828 Fall 2014 September 10, 2014 6.828 Fall 2014 Using the GNU Debugger September 10, 2014 1 / 14 Homework solution From bootasm.s: # Set up the stack pointer and call into C.
Using the GNU Debugger
 Using the GNU Debugger 6.828 Fall 2016 September 14, 2016 6.828 Fall 2016 Using the GNU Debugger September 14, 2016 1 / 14 Homework solution 6.828 Fall 2016 Using the GNU Debugger September 14, 2016 2
Buffer Overflow Defenses
 Buffer Overflow Defenses Some examples, pros, and cons of various defenses against buffer overflows. Caveats: 1. Not intended to be a complete list of products that defend against buffer overflows. 2.
The Perl Debugger. Avoiding Bugs with Warnings and Strict. Daniel Allen. Abstract
 1 of 8 6/18/2006 7:36 PM The Perl Debugger Daniel Allen Abstract Sticking in extra print statements is one way to debug your Perl code, but a full-featured debugger can give you more information. Debugging
Debugging OpenMP Programs
 Debugging OpenMP Programs Dieter an Mey Center for Computing and Communication Aachen University anmey@rz.rwth-aachen.de aachen.de 1 Debugging OpenMP Programs General Hints dbx Sun IDE Debugger TotalView
TotalView. Graphic User Interface Commands Guide. version 8.0
 TotalView Graphic User Interface Commands Guide version 8.0 Copyright 1998 2006 by Etnus LLC. All rights reserved. Copyright 1996 1998 by Dolphin Interconnect Solutions, Inc. Copyright 1993 1996 by BBN
Enhanced Debugging with Traces
 Enhanced Debugging with Traces An essential technique used in emulator development is a useful addition to any programmer s toolbox. Peter Phillips Creating an emulator to run old programs is a difficult
EW The Source Browser might fail to start data collection properly in large projects until the Source Browser window is opened manually.
 EW 25462 The Source Browser might fail to start data collection properly in large projects until the Source Browser window is opened manually. EW 25460 Some objects of a struct/union type defined with
We first learn one useful option of gcc. Copy the following C source file to your
 Lecture 5 p.1 Faculty of Computer Science, Dalhousie University CSCI 2132 Software Development Lab 5: gcc and gdb tools 10-Oct-2018 Location: Teaching Labs Time: Thursday Instructor: Vlado Keselj Lab 5:
Advanced Memory Allocation
 Advanced Memory Allocation Call some useful functions of the GNU C library to save precious memory and to find nasty bugs. by Gianluca Insolvibile Dealing with dynamic memory traditionally has been one
GDB QUICK REFERENCE GDB Version 4
 GDB QUICK REFERENCE GDB Version 4 Essential Commands gdb program [core] debug program [using coredump core] b [file:]function run [arglist] bt p expr c n s set breakpoint at function [in file] start your
ECS 153 Discussion Section. April 6, 2015
 ECS 153 Discussion Section April 6, 2015 1 What We ll Cover Goal: To discuss buffer overflows in detail Stack- based buffer overflows Smashing the stack : execution from the stack ARC (or return- to- libc)
CSE 374 Programming Concepts & Tools. Brandon Myers Winter 2015 Lecture 11 gdb and Debugging (Thanks to Hal Perkins)
") CSE 374 Programming Concepts & Tools Brandon Myers Winter 2015 Lecture 11 gdb and Debugging (Thanks to Hal Perkins) Hacker tool of the week (tags) Problem: I want to find the definition of a function or
CSE 374 Programming Concepts & Tools Brandon Myers Winter 2015 Lecture 11 gdb and Debugging (Thanks to Hal Perkins) Hacker tool of the week (tags) Problem: I want to find the definition of a function or
IBM VisualAge for Java,Version3.5. Distributed Debugger for Workstations
 IBM VisualAge for Java,Version3.5 Distributed Debugger for Workstations Note! Before using this information and the product it supports, be sure to read the general information under Notices. Edition notice
COS 318: Operating Systems
 COS 318: Operating Systems Overview Kai Li Computer Science Department Princeton University (http://www.cs.princeton.edu/courses/cos318/) Important Times Lectures 9/20 Lecture is here Other lectures in
Debugging, benchmarking, tuning i.e. software development tools. Martin Čuma Center for High Performance Computing University of Utah
 Debugging, benchmarking, tuning i.e. software development tools Martin Čuma Center for High Performance Computing University of Utah m.cuma@utah.edu SW development tools Development environments Compilers
ProDev TM WorkShop: Debugger User s Guide
 ProDev TM WorkShop: Debugger User s Guide 007 2579 007 COPYRIGHT 1996, 1999 2001 Silicon Graphics, Inc. All rights reserved; provided portions may be copyright in third parties, as indicated elsewhere
QUIZ How do we implement run-time constants and. compile-time constants inside classes?
 QUIZ How do we implement run-time constants and compile-time constants inside classes? Compile-time constants in classes The static keyword inside a class means there s only one instance, regardless of
Eliminate Threading Errors to Improve Program Stability
 Introduction This guide will illustrate how the thread checking capabilities in Intel Parallel Studio XE can be used to find crucial threading defects early in the development cycle. It provides detailed