Application of Hierarchical Clustering to Find Expression Modules in Cancer
|
|
|
- Alan Lane
- 6 years ago
- Views:
Transcription
1 Application of Hierarchical Clustering to Find Expression Modules in Cancer T. M. Murali August 18, 2008
2 Innovative Application of Hierarchical Clustering A module map showing conditional activity of expression modules in cancer, Eran Segal, Nir Friedman, Daphne Koller and Aviv Regev, Nature Genetics 36, , 2004 Analyse gene expression data to find groups of genes expressed in concert between different cancers. Use hierarchical clustering innovatively.
3 Goals Move away from standard approach: determine genes that respond (based on cut-off) and study these genes further. Develop method that can analyse large numbers (1000s) of samples across multiple conditions.
4 Goals Move away from standard approach: determine genes that respond (based on cut-off) and study these genes further. Develop method that can analyse large numbers (1000s) of samples across multiple conditions. Patterns of co-expression across all conditions are not very interesting.
5 Goals Move away from standard approach: determine genes that respond (based on cut-off) and study these genes further. Develop method that can analyse large numbers (1000s) of samples across multiple conditions. Patterns of co-expression across all conditions are not very interesting. Compute gene modules: groups of genes that show concerted behaviour across multiple conditions. Specifically, Segal et al. associate with each gene module, a set of samples in which the module is up-regulated and a set of samples in which the module is down-regulated.
6 Key Steps
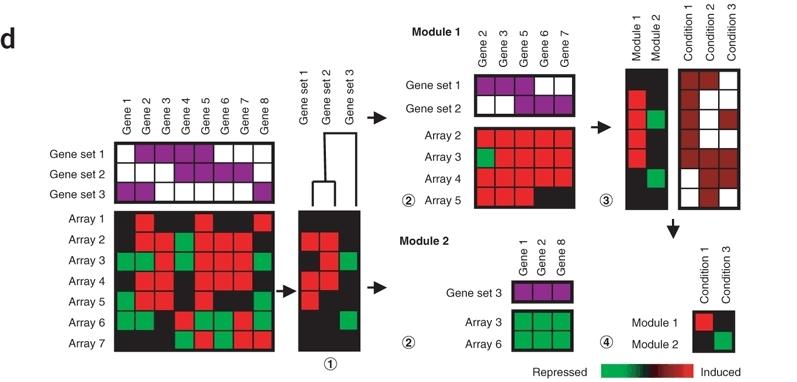
7 Key Steps Group genes into predefined gene sets, e.g., groups of genes with the same functional annotation. Convert gene-by-array matrix into gene-set-by-array matrix. Hierarchically cluster gene sets in this matrix. Identify interesting gene set clusters (nodes) in the tree. In each gene set cluster, remove genes not expressed consistently with the cluster.

8 Gene Expression Data Sets
9 Data Normalisation
10 Data Normalisation Needed because some arrays measure absolute value of gene expression and others measure relative values. Affymetrix microarrays: take logarithm to the base-2 and zero transform within data set. cdna microarrays:
11 Data Normalisation Needed because some arrays measure absolute value of gene expression and others measure relative values. Affymetrix microarrays: take logarithm to the base-2 and zero transform within data set. cdna microarrays: zero transform within data set.
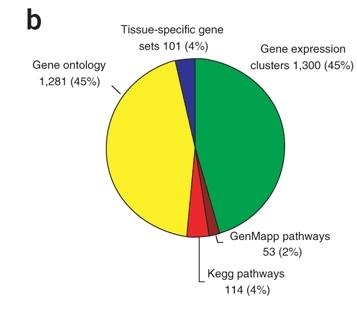
12 Pre-defined Genes Sets
13 Computing Gene-Set-By-Array Matrix Goal is to construct a gene-set-by-array matrix. For each gene set-array pair, find an average expression value of that gene set in that array.
14 Computing Gene-Set-By-Array Matrix Goal is to construct a gene-set-by-array matrix. For each gene set-array pair, find an average expression value of that gene set in that array. A gene is induced (respectively, repressed in an array if its change in expression is 2 (respectively, 2). For each gene set-array pair, compute the fraction of genes induced or repressed. Use these values in the gene-set-by-array matrix.
15 Computing Significant Entries in the Gene-Set-By-Array Matrix Many entries in the gene-set-by-array matrix may not be statistically significant.
16 Computing Significant Entries in the Gene-Set-By-Array Matrix Many entries in the gene-set-by-array matrix may not be statistically significant. For a given array, fraction of induced genes in a gene set may be close to the fraction of induced genes in the array.
17 Computing Significant Entries in the Gene-Set-By-Array Matrix Many entries in the gene-set-by-array matrix may not be statistically significant. For a given array, fraction of induced genes in a gene set may be close to the fraction of induced genes in the array. Statistical test: for a given array, is the fraction of induced genes in a gene set much larger than the fraction of induced genes in the entire array?
18 Computing Significant Entries in the Gene-Set-By-Array Matrix Many entries in the gene-set-by-array matrix may not be statistically significant. For a given array, fraction of induced genes in a gene set may be close to the fraction of induced genes in the array. Statistical test: for a given array, is the fraction of induced genes in a gene set much larger than the fraction of induced genes in the entire array? Compute the p-value (statistical significance) of the fraction. Exercise. Do so for every gene-set-array pair. Use false discovery rate correction to account for multiple hypotheses testing. Replace insignificant entries by 0.
19 Hierarchical Clustering Start from a gene-set-by-array matrix containing fraction of induced/repressed genes. Fraction is negative if repressed. Apply bottom-up hierarchical clustering. Vector at internal node is
20 Hierarchical Clustering Start from a gene-set-by-array matrix containing fraction of induced/repressed genes. Fraction is negative if repressed. Apply bottom-up hierarchical clustering. Vector at internal node is average of vectors at descendant leaves.
21 Hierarchical Clustering Start from a gene-set-by-array matrix containing fraction of induced/repressed genes. Fraction is negative if repressed. Apply bottom-up hierarchical clustering. Vector at internal node is average of vectors at descendant leaves. Which nodes do we select as clusters in the tree?
22 Hierarchical Clustering Start from a gene-set-by-array matrix containing fraction of induced/repressed genes. Fraction is negative if repressed. Apply bottom-up hierarchical clustering. Vector at internal node is average of vectors at descendant leaves. Which nodes do we select as clusters in the tree? Associate each interior node with Pearson correlation between the two children. Cluster node whose Pearson correlation differs by more than 0.05 from the Pearson correlation of its parent.
23 Turning Clusters into Modules Each cluster is a gene set and a set of arrays.
24 Turning Clusters into Modules Each cluster is a gene set and a set of arrays. The gene set in a cluster is the union of descendant gene sets (leaves). The arrays in a cluster are only those that are induced or repressed in the cluster. Module Cluster minus genes whose expression is not consistent with the rest of the cluster.
25 Testing Consistency of a Gene with a Gene Set Let g be the gene and G be the gene set.
26 Testing Consistency of a Gene with a Gene Set Let g be the gene and G be the gene set. Let I (respectively, R) be the set of arrays in which G is significantly induced (respectively, repressed). For an array a in I (or R), let p a be the fraction of genes that are induced (or repressed) by two-fold or more in a.
27 Testing Consistency of a Gene with a Gene Set Let g be the gene and G be the gene set. Let I (respectively, R) be the set of arrays in which G is significantly induced (respectively, repressed). For an array a in I (or R), let p a be the fraction of genes that are induced (or repressed) by two-fold or more in a. Measure extent to which g s expression changed by more (or less) than two-fold in the arrays in I (or R):
28 Testing Consistency of a Gene with a Gene Set Let g be the gene and G be the gene set. Let I (respectively, R) be the set of arrays in which G is significantly induced (respectively, repressed). For an array a in I (or R), let p a be the fraction of genes that are induced (or repressed) by two-fold or more in a. Measure extent to which g s expression changed by more (or less) than two-fold in the arrays in I (or R): Score(g) = log(p a ) + log(p a ) a I g is induced in a a R g is repressed in a
29 Testing Consistency of a Gene with a Gene Set Let g be the gene and G be the gene set. Let I (respectively, R) be the set of arrays in which G is significantly induced (respectively, repressed). For an array a in I (or R), let p a be the fraction of genes that are induced (or repressed) by two-fold or more in a. Measure extent to which g s expression changed by more (or less) than two-fold in the arrays in I (or R): Score(g) = log(p a ) + log(p a ) a I g is induced in a a R g is repressed in a An array contributes to the score only if g is consistent with G in the array. Larger contribution from arrays with fewer induced genes. Compute statistical significance of this score.
30 Computing Statistical Significance of Score(g) Score(g) = log(p a ) + log(p a ) a I g is induced in a a R g is repressed in a
31 Computing Statistical Significance of Score(g) Score(g) = log(p a ) + log(p a ) a I g is induced in a a R g is repressed in a Null hypothesis: genes in each array are randomly permuted, i.e., the p a induced genes in an array a I are chosen randomly.
32 Computing Statistical Significance of Score(g) Score(g) = log(p a ) + log(p a ) a I g is induced in a a R g is repressed in a Null hypothesis: genes in each array are randomly permuted, i.e., the p a induced genes in an array a I are chosen randomly. Each element in Score(g) is an independent binary random variable. Random variable takes the value log(p a ) with probability p a and the value 0 with the probability 1 p a.
33 Computing Statistical Significance of Score(g) Score(g) = log(p a ) + log(p a ) a I g is induced in a a R g is repressed in a Null hypothesis: genes in each array are randomly permuted, i.e., the p a induced genes in an array a I are chosen randomly. Each element in Score(g) is an independent binary random variable. Random variable takes the value log(p a ) with probability p a and the value 0 with the probability 1 p a. Under the null hypothesis, Score(g) has mean a I R p a log p a and variance a I R p a(1 p a ) log 2 p a.
34 Computing Statistical Significance of Score(g) Score(g) = log(p a ) + log(p a ) a I g is induced in a a R g is repressed in a Null hypothesis: genes in each array are randomly permuted, i.e., the p a induced genes in an array a I are chosen randomly. Each element in Score(g) is an independent binary random variable. Random variable takes the value log(p a ) with probability p a and the value 0 with the probability 1 p a. Under the null hypothesis, Score(g) has mean a I R p a log p a and variance a I R p a(1 p a ) log 2 p a. Suppose we observe a score of t. What is the probability of achieving a score of t or higher under the null hypothesis? Exercise.
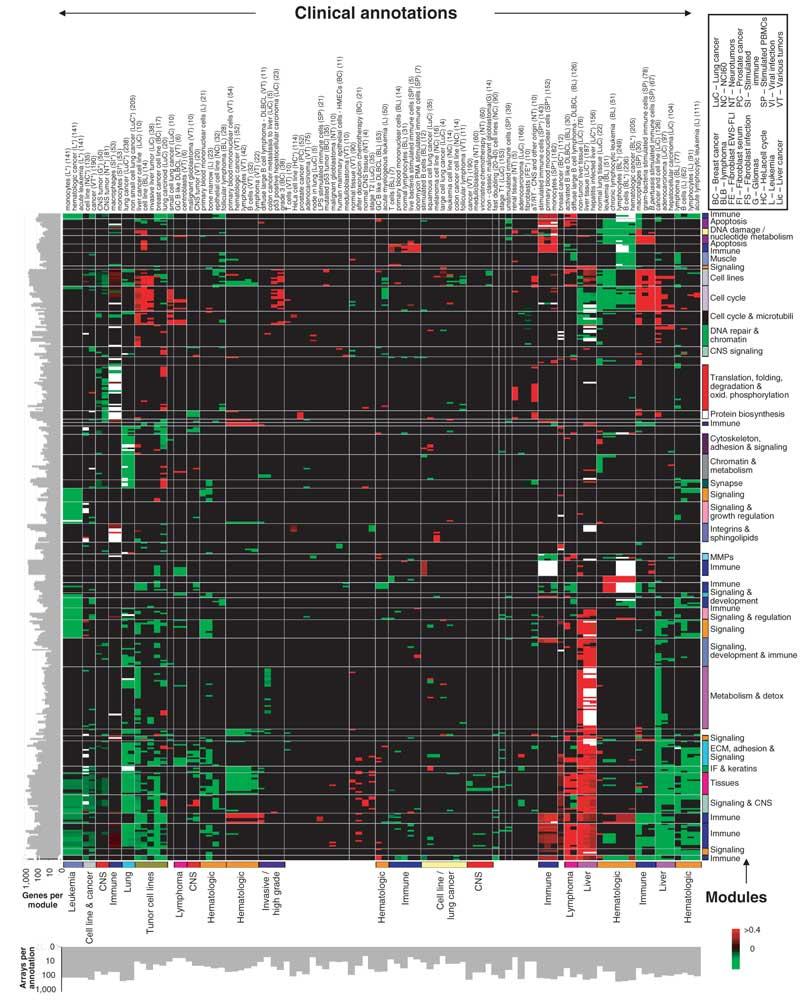
35 Further Analysis Statistical significance of computed modules using leave-one-out cross validation (read supplement). Compute enrichment of clinical annotations of the arrays in a module. Visualisation of modules. Literature-based analysis of modules
36
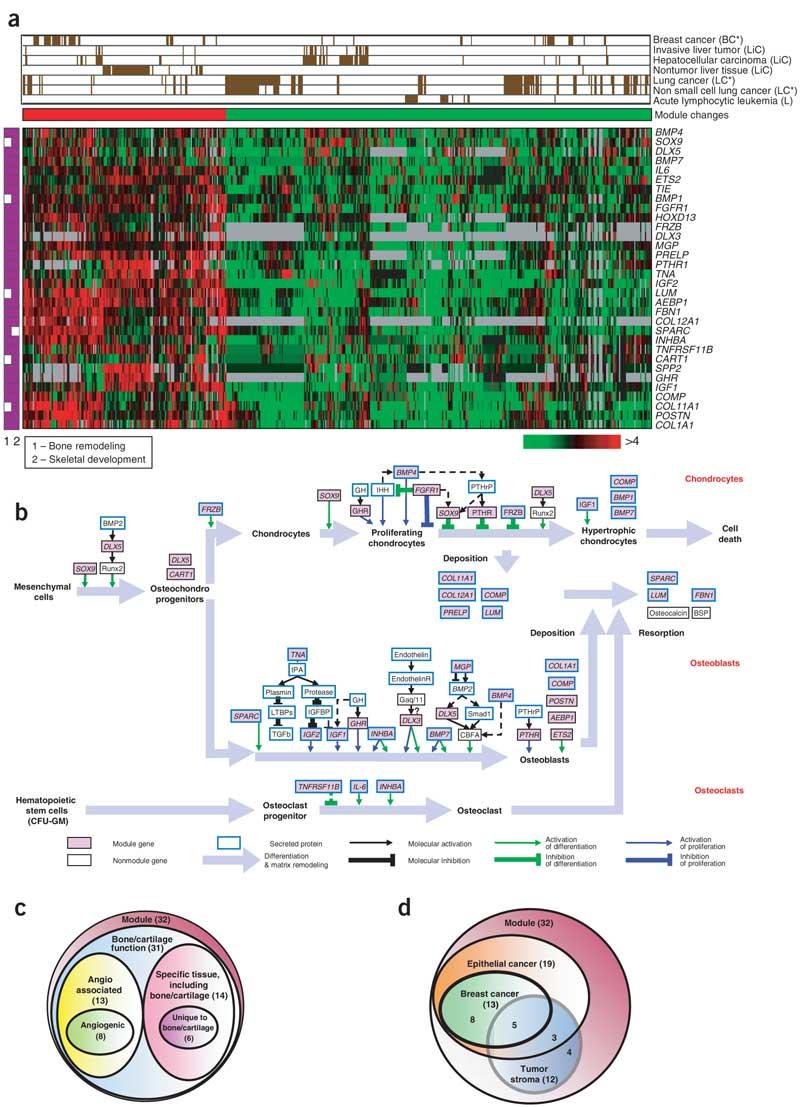
37 Bone Osteoblastic Module
38 Conclusions Used pre-defined gene sets to drive hierarchical clustering algorithm. Remove genes from a cluster of gene sets if the gene s expression profile deviates from the cluster. Automatically decide which arrays are part of a module. Natural segue into lectures on biclustering where we will automatically decide which arrays and which genes to include in a bicluster.
39 Software Exercise 1. Register for and download Genomica. 2. Use Genomica to compute a module map for the sample data set. 3. Download human Entrez Gene gene sets and gene expression data. 4. Run Genomica on these data sets. 5. Change parameters and run Genomica again. Are the results different?
40 Computational Exercises 1. In case of d min, show that the hierarchical clustering algorithm returns the minimum spanning tree. 2. How can we measure the useful biological knowledge that a cluster contains? 3. Given an array, the set of genes induced in that array, and a specific gene set, devise a statistical test to determine if the number of induced genes in the gene set is (much) larger than the number of induced genes in the entire array. 4. Under the null hypothesis, Score(g) has mean a I R p a log p a and variance a I R p a(1 p a ) log 2 p a. Suppose we observe a score of t. What is the probability of achieving a score of t or higher under the null hypothesis? 5. How will you modify Genomica to accept a new dataset without performing all computations from scratch?
SEEK User Manual. Introduction
 SEEK User Manual Introduction SEEK is a computational gene co-expression search engine. It utilizes a vast human gene expression compendium to deliver fast, integrative, cross-platform co-expression analyses.
EECS730: Introduction to Bioinformatics
 EECS730: Introduction to Bioinformatics Lecture 15: Microarray clustering http://compbio.pbworks.com/f/wood2.gif Some slides were adapted from Dr. Shaojie Zhang (University of Central Florida) Microarray
Drug versus Disease (DrugVsDisease) package
 package") 1 Introduction Drug versus Disease (DrugVsDisease) package The Drug versus Disease (DrugVsDisease) package provides a pipeline for the comparison of drug and disease gene expression profiles where negatively
1 Introduction Drug versus Disease (DrugVsDisease) package The Drug versus Disease (DrugVsDisease) package provides a pipeline for the comparison of drug and disease gene expression profiles where negatively
Gene Clustering & Classification
 BINF, Introduction to Computational Biology Gene Clustering & Classification Young-Rae Cho Associate Professor Department of Computer Science Baylor University Overview Introduction to Gene Clustering
Statistical Analysis of Metabolomics Data. Xiuxia Du Department of Bioinformatics & Genomics University of North Carolina at Charlotte
 Statistical Analysis of Metabolomics Data Xiuxia Du Department of Bioinformatics & Genomics University of North Carolina at Charlotte Outline Introduction Data pre-treatment 1. Normalization 2. Centering,
/ Computational Genomics. Normalization
 10-810 /02-710 Computational Genomics Normalization Genes and Gene Expression Technology Display of Expression Information Yeast cell cycle expression Experiments (over time) baseline expression program
Exploratory data analysis for microarrays
 Exploratory data analysis for microarrays Jörg Rahnenführer Computational Biology and Applied Algorithmics Max Planck Institute for Informatics D-66123 Saarbrücken Germany NGFN - Courses in Practical DNA
Expander Online Documentation
 Expander Online Documentation Table of Contents Introduction...1 Starting EXPANDER...2 Input Data...4 Preprocessing GE Data...8 Viewing Data Plots...12 Clustering GE Data...14 Biclustering GE Data...17
Package ibbig. R topics documented: December 24, 2018
 Type Package Title Iterative Binary Biclustering of Genesets Version 1.26.0 Date 2011-11-23 Author Daniel Gusenleitner, Aedin Culhane Package ibbig December 24, 2018 Maintainer Aedin Culhane
Expander 7.2 Online Documentation
 Expander 7.2 Online Documentation Introduction... 2 Starting EXPANDER... 2 Input Data... 3 Tabular Data File... 4 CEL Files... 6 Working on similarity data no associated expression data... 9 Working on
Package twilight. August 3, 2013
 Package twilight August 3, 2013 Version 1.37.0 Title Estimation of local false discovery rate Author Stefanie Scheid In a typical microarray setting with gene expression data observed
Supplementary Materials for. A gene ontology inferred from molecular networks
 Supplementary Materials for A gene ontology inferred from molecular networks Janusz Dutkowski, Michael Kramer, Michal A Surma, Rama Balakrishnan, J Michael Cherry, Nevan J Krogan & Trey Ideker 1. Supplementary
MATH3880 Introduction to Statistics and DNA MATH5880 Statistics and DNA Practical Session Monday, 16 November pm BRAGG Cluster
 MATH3880 Introduction to Statistics and DNA MATH5880 Statistics and DNA Practical Session Monday, 6 November 2009 3.00 pm BRAGG Cluster This document contains the tasks need to be done and completed by
Biclustering Algorithms for Gene Expression Analysis
 Biclustering Algorithms for Gene Expression Analysis T. M. Murali August 19, 2008 Problems with Hierarchical Clustering It is a global clustering algorithm. Considers all genes to be equally important
10601 Machine Learning. Model and feature selection
 10601 Machine Learning Model and feature selection Model selection issues We have seen some of this before Selecting features (or basis functions) Logistic regression SVMs Selecting parameter value Prior
9/29/13. Outline Data mining tasks. Clustering algorithms. Applications of clustering in biology
 9/9/ I9 Introduction to Bioinformatics, Clustering algorithms Yuzhen Ye (yye@indiana.edu) School of Informatics & Computing, IUB Outline Data mining tasks Predictive tasks vs descriptive tasks Example
Microarray Analysis Classification by SVM and PAM
 Microarray Analysis Classification by SVM and PAM Rainer Spang and Florian Markowetz Practical Microarray Analysis 2003 Max-Planck-Institute for Molecular Genetics Dept. Computational Molecular Biology
Contents. ! Data sets. ! Distance and similarity metrics. ! K-means clustering. ! Hierarchical clustering. ! Evaluation of clustering results
 Statistical Analysis of Microarray Data Contents Data sets Distance and similarity metrics K-means clustering Hierarchical clustering Evaluation of clustering results Clustering Jacques van Helden Jacques.van.Helden@ulb.ac.be
Clustering Jacques van Helden
 Statistical Analysis of Microarray Data Clustering Jacques van Helden Jacques.van.Helden@ulb.ac.be Contents Data sets Distance and similarity metrics K-means clustering Hierarchical clustering Evaluation
STEM. Short Time-series Expression Miner (v1.1) User Manual
 User Manual") STEM Short Time-series Expression Miner (v1.1) User Manual Jason Ernst (jernst@cs.cmu.edu) Ziv Bar-Joseph Center for Automated Learning and Discovery School of Computer Science Carnegie Mellon University
STEM Short Time-series Expression Miner (v1.1) User Manual Jason Ernst (jernst@cs.cmu.edu) Ziv Bar-Joseph Center for Automated Learning and Discovery School of Computer Science Carnegie Mellon University
Introduction to GE Microarray data analysis Practical Course MolBio 2012
 Introduction to GE Microarray data analysis Practical Course MolBio 2012 Claudia Pommerenke Nov-2012 Transkriptomanalyselabor TAL Microarray and Deep Sequencing Core Facility Göttingen University Medical
CANCER PREDICTION USING PATTERN CLASSIFICATION OF MICROARRAY DATA. By: Sudhir Madhav Rao &Vinod Jayakumar Instructor: Dr.
 CANCER PREDICTION USING PATTERN CLASSIFICATION OF MICROARRAY DATA By: Sudhir Madhav Rao &Vinod Jayakumar Instructor: Dr. Michael Nechyba 1. Abstract The objective of this project is to apply well known
Supporting Information
 Supporting Information Ullman et al. 10.1073/pnas.1513198113 SI Methods Training Models on Full-Object Images. The human average MIRC recall was 0.81, and the sub-mirc recall was 0.10. The models average
Package RmiR. R topics documented: September 26, 2018
 Package RmiR September 26, 2018 Title Package to work with mirnas and mirna targets with R Description Useful functions to merge microrna and respective targets using differents databases Version 1.36.0
Clustering. Lecture 6, 1/24/03 ECS289A
 Clustering Lecture 6, 1/24/03 What is Clustering? Given n objects, assign them to groups (clusters) based on their similarity Unsupervised Machine Learning Class Discovery Difficult, and maybe ill-posed
ECS 234: Data Analysis: Clustering ECS 234
 : Data Analysis: Clustering What is Clustering? Given n objects, assign them to groups (clusters) based on their similarity Unsupervised Machine Learning Class Discovery Difficult, and maybe ill-posed
Package sigqc. June 13, 2018
 Title Quality Control Metrics for Gene Signatures Version 0.1.20 Package sigqc June 13, 2018 Description Provides gene signature quality control metrics in publication ready plots. Namely, enables the
Lecture 5. Functional Analysis with Blast2GO Enriched functions. Kegg Pathway Analysis Functional Similarities B2G-Far. FatiGO Babelomics.
 Lecture 5 Functional Analysis with Blast2GO Enriched functions FatiGO Babelomics FatiScan Kegg Pathway Analysis Functional Similarities B2G-Far 1 Fisher's Exact Test One Gene List (A) The other list (B)
Unsupervised learning: Clustering & Dimensionality reduction. Theo Knijnenburg Jorma de Ronde
 Unsupervised learning: Clustering & Dimensionality reduction Theo Knijnenburg Jorma de Ronde Source of slides Marcel Reinders TU Delft Lodewyk Wessels NKI Bioalgorithms.info Jeffrey D. Ullman Stanford
Cross-validation and the Bootstrap
 Cross-validation and the Bootstrap In the section we discuss two resampling methods: cross-validation and the bootstrap. These methods refit a model of interest to samples formed from the training set,
DI TRANSFORM. The regressive analyses. identify relationships
 July 2, 2015 DI TRANSFORM MVstats TM Algorithm Overview Summary The DI Transform Multivariate Statistics (MVstats TM ) package includes five algorithm options that operate on most types of geologic, geophysical,
GS Analysis of Microarray Data
 GS01 0163 Analysis of Microarray Data Keith Baggerly and Bradley Broom Department of Bioinformatics and Computational Biology UT MD Anderson Cancer Center kabagg@mdanderson.org bmbroom@mdanderson.org 19
CARMAweb users guide version Johannes Rainer
 CARMAweb users guide version 1.0.8 Johannes Rainer July 4, 2006 Contents 1 Introduction 1 2 Preprocessing 5 2.1 Preprocessing of Affymetrix GeneChip data............................. 5 2.2 Preprocessing
Supplementary text S6 Comparison studies on simulated data
 Supplementary text S Comparison studies on simulated data Peter Langfelder, Rui Luo, Michael C. Oldham, and Steve Horvath Corresponding author: shorvath@mednet.ucla.edu Overview In this document we illustrate
Bayesian Pathway Analysis (BPA) Tutorial
 Tutorial") Bayesian Pathway Analysis (BPA) Tutorial Step by Step to run BPA: 1-) Download latest version of BPAS from BPA website. Unzip it to an appropriate directory. You need to have JAVA Runtime engine and Matlab
Bayesian Pathway Analysis (BPA) Tutorial Step by Step to run BPA: 1-) Download latest version of BPAS from BPA website. Unzip it to an appropriate directory. You need to have JAVA Runtime engine and Matlab
ChromHMM: automating chromatin-state discovery and characterization
 Nature Methods ChromHMM: automating chromatin-state discovery and characterization Jason Ernst & Manolis Kellis Supplementary Figure 1 Supplementary Figure 2 Supplementary Figure 3 Supplementary Figure
Step-by-Step Guide to Advanced Genetic Analysis
 Step-by-Step Guide to Advanced Genetic Analysis Page 1 Introduction In the previous document, 1 we covered the standard genetic analyses available in JMP Genomics. Here, we cover the more advanced options
ROTS: Reproducibility Optimized Test Statistic
 ROTS: Reproducibility Optimized Test Statistic Fatemeh Seyednasrollah, Tomi Suomi, Laura L. Elo fatsey (at) utu.fi March 3, 2016 Contents 1 Introduction 2 2 Algorithm overview 3 3 Input data 3 4 Preprocessing
Cross-validation and the Bootstrap
 Cross-validation and the Bootstrap In the section we discuss two resampling methods: cross-validation and the bootstrap. 1/44 Cross-validation and the Bootstrap In the section we discuss two resampling
Chapter 6: Linear Model Selection and Regularization
 Chapter 6: Linear Model Selection and Regularization As p (the number of predictors) comes close to or exceeds n (the sample size) standard linear regression is faced with problems. The variance of the
Microarray Excel Hands-on Workshop Handout
 Microarray Excel Hands-on Workshop Handout Piali Mukherjee (pim2001@med.cornell.edu; http://icb.med.cornell.edu/) Importing Data Excel allows you to import data in tab, comma or space delimited text formats.
High throughput Data Analysis 2. Cluster Analysis
 High throughput Data Analysis 2 Cluster Analysis Overview Why clustering? Hierarchical clustering K means clustering Issues with above two Other methods Quality of clustering results Introduction WHY DO
Cluster Analysis for Microarray Data
 Cluster Analysis for Microarray Data Seventh International Long Oligonucleotide Microarray Workshop Tucson, Arizona January 7-12, 2007 Dan Nettleton IOWA STATE UNIVERSITY 1 Clustering Group objects that
mirnet Tutorial Starting with expression data
 mirnet Tutorial Starting with expression data Computer and Browser Requirements A modern web browser with Java Script enabled Chrome, Safari, Firefox, and Internet Explorer 9+ For best performance and
Genomics - Problem Set 2 Part 1 due Friday, 1/26/2018 by 9:00am Part 2 due Friday, 2/2/2018 by 9:00am
 Genomics - Part 1 due Friday, 1/26/2018 by 9:00am Part 2 due Friday, 2/2/2018 by 9:00am One major aspect of functional genomics is measuring the transcript abundance of all genes simultaneously. This was
Evaluating Classifiers
 Evaluating Classifiers Reading for this topic: T. Fawcett, An introduction to ROC analysis, Sections 1-4, 7 (linked from class website) Evaluating Classifiers What we want: Classifier that best predicts
Fast or furious? - User analysis of SF Express Inc
 CS 229 PROJECT, DEC. 2017 1 Fast or furious? - User analysis of SF Express Inc Gege Wen@gegewen, Yiyuan Zhang@yiyuan12, Kezhen Zhao@zkz I. MOTIVATION The motivation of this project is to predict the likelihood
STATISTICS (STAT) Statistics (STAT) 1
 Statistics (STAT) 1") Statistics (STAT) 1 STATISTICS (STAT) STAT 2013 Elementary Statistics (A) Prerequisites: MATH 1483 or MATH 1513, each with a grade of "C" or better; or an acceptable placement score (see placement.okstate.edu).
Statistics (STAT) 1 STATISTICS (STAT) STAT 2013 Elementary Statistics (A) Prerequisites: MATH 1483 or MATH 1513, each with a grade of "C" or better; or an acceptable placement score (see placement.okstate.edu).
Identifying differentially expressed genes with siggenes
 Identifying differentially expressed genes with siggenes Holger Schwender holger.schw@gmx.de Abstract In this vignette, we show how the functions contained in the R package siggenes can be used to perform
Package OLIN. September 30, 2018
 Version 1.58.0 Date 2016-02-19 Package OLIN September 30, 2018 Title Optimized local intensity-dependent normalisation of two-color microarrays Author Matthias Futschik Maintainer Matthias
Feature Selection. CE-725: Statistical Pattern Recognition Sharif University of Technology Spring Soleymani
 Feature Selection CE-725: Statistical Pattern Recognition Sharif University of Technology Spring 2013 Soleymani Outline Dimensionality reduction Feature selection vs. feature extraction Filter univariate
CS313 Exercise 4 Cover Page Fall 2017
 CS313 Exercise 4 Cover Page Fall 2017 Due by the start of class on Thursday, October 12, 2017. Name(s): In the TIME column, please estimate the time you spent on the parts of this exercise. Please try
Chapter 3. Requirement Based System Test Case Prioritization of New and Regression Test Cases. 3.1 Introduction
 Chapter 3 Requirement Based System Test Case Prioritization of New and Regression Test Cases 3.1 Introduction In this chapter a new prioritization technique has been proposed with two new prioritization
Comparison of different preprocessing techniques and feature selection algorithms in cancer datasets
 Comparison of different preprocessing techniques and feature selection algorithms in cancer datasets Konstantinos Sechidis School of Computer Science University of Manchester sechidik@cs.man.ac.uk Abstract
Differential Expression Analysis at PATRIC
 Differential Expression Analysis at PATRIC The following step- by- step workflow is intended to help users learn how to upload their differential gene expression data to their private workspace using Expression
On Demand Phenotype Ranking through Subspace Clustering
 On Demand Phenotype Ranking through Subspace Clustering Xiang Zhang, Wei Wang Department of Computer Science University of North Carolina at Chapel Hill Chapel Hill, NC 27599, USA {xiang, weiwang}@cs.unc.edu
Tutorial - Analysis of Microarray Data. Microarray Core E Consortium for Functional Glycomics Funded by the NIGMS
 Tutorial - Analysis of Microarray Data Microarray Core E Consortium for Functional Glycomics Funded by the NIGMS Data Analysis introduction Warning: Microarray data analysis is a constantly evolving science.
The supclust Package
 The supclust Package May 18, 2005 Title Supervised Clustering of Genes Version 1.0-5 Date 2005-05-18 Methodology for Supervised Grouping of Predictor Variables Author Marcel Dettling and Martin Maechler
Affymetrix Microarrays
 Affymetrix Microarrays Cavan Reilly November 3, 2017 Table of contents Overview The CLL data set Quality Assessment and Remediation Preprocessing Testing for Differential Expression Moderated Tests Volcano
Genomics - Problem Set 2 Part 1 due Friday, 1/25/2019 by 9:00am Part 2 due Friday, 2/1/2019 by 9:00am
 Genomics - Part 1 due Friday, 1/25/2019 by 9:00am Part 2 due Friday, 2/1/2019 by 9:00am One major aspect of functional genomics is measuring the transcript abundance of all genes simultaneously. This was
Triclustering in Gene Expression Data Analysis: A Selected Survey
 Triclustering in Gene Expression Data Analysis: A Selected Survey P. Mahanta, H. A. Ahmed Dept of Comp Sc and Engg Tezpur University Napaam -784028, India Email: priyakshi@tezu.ernet.in, hasin@tezu.ernet.in
Evolutionary origins of modularity
 Evolutionary origins of modularity Jeff Clune, Jean-Baptiste Mouret and Hod Lipson Proceedings of the Royal Society B 2013 Presented by Raghav Partha Evolvability Evolvability capacity to rapidly adapt
An Unsupervised Approach for Combining Scores of Outlier Detection Techniques, Based on Similarity Measures
 An Unsupervised Approach for Combining Scores of Outlier Detection Techniques, Based on Similarity Measures José Ramón Pasillas-Díaz, Sylvie Ratté Presenter: Christoforos Leventis 1 Basic concepts Outlier
Gene Set Enrichment Analysis. GSEA User Guide
 Gene Set Enrichment Analysis GSEA User Guide 1 Software Copyright The Broad Institute SOFTWARE COPYRIGHT NOTICE AGREEMENT This software and its documentation are copyright 2009, 2010 by the Broad Institute/Massachusetts
GRIND Gene Regulation INference using Dual thresholding. Ir. W.P.A. Ligtenberg Eindhoven University of Technology
 GRIND Gene Regulation INference using Dual thresholding Ir. W.P.A. Ligtenberg Eindhoven University of Technology Overview Project aim Introduction to network inference Benchmark (ValGRINT) Results GRIND
Gene signature selection to predict survival benefits from adjuvant chemotherapy in NSCLC patients
 1 Gene signature selection to predict survival benefits from adjuvant chemotherapy in NSCLC patients 1,2 Keyue Ding, Ph.D. Nov. 8, 2014 1 NCIC Clinical Trials Group, Kingston, Ontario, Canada 2 Dept. Public
Assignment 4 (Sol.) Introduction to Data Analytics Prof. Nandan Sudarsanam & Prof. B. Ravindran
 Introduction to Data Analytics Prof. Nandan Sudarsanam & Prof. B. Ravindran") Assignment 4 (Sol.) Introduction to Data Analytics Prof. andan Sudarsanam & Prof. B. Ravindran 1. Which among the following techniques can be used to aid decision making when those decisions depend upon
Assignment 4 (Sol.) Introduction to Data Analytics Prof. andan Sudarsanam & Prof. B. Ravindran 1. Which among the following techniques can be used to aid decision making when those decisions depend upon
Clustering analysis of gene expression data
 Clustering analysis of gene expression data Chapter 11 in Jonathan Pevsner, Bioinformatics and Functional Genomics, 3 rd edition (Chapter 9 in 2 nd edition) Human T cell expression data The matrix contains
Two mode Network. PAD 637, Lab 8 Spring 2013 Yoonie Lee
 Two mode Network PAD 637, Lab 8 Spring 2013 Yoonie Lee Lab exercises Two- mode Davis QAP correlation Multiple regression QAP Types of network data One-mode network (M M ) Two-mode network (M N ) M1 M2
Chapter 2 Basic Structure of High-Dimensional Spaces
 Chapter 2 Basic Structure of High-Dimensional Spaces Data is naturally represented geometrically by associating each record with a point in the space spanned by the attributes. This idea, although simple,
Package pcagopromoter
 Version 1.26.0 Date 2012-03-16 Package pcagopromoter November 13, 2018 Title pcagopromoter is used to analyze DNA micro array data Author Morten Hansen, Jorgen Olsen Maintainer Morten Hansen
VIDAEXPERT: DATA ANALYSIS Here is the Statistics button.
 Here is the Statistics button. After creating dataset you can analyze it in different ways. First, you can calculate statistics. Open Statistics dialog, Common tabsheet, click Calculate. Min, Max: minimal
Analysis of Algorithms
 Analysis of Algorithms Concept Exam Code: 16 All questions are weighted equally. Assume worst case behavior and sufficiently large input sizes unless otherwise specified. Strong induction Consider this
Midterm Examination CS540-2: Introduction to Artificial Intelligence
 Midterm Examination CS540-2: Introduction to Artificial Intelligence March 15, 2018 LAST NAME: FIRST NAME: Problem Score Max Score 1 12 2 13 3 9 4 11 5 8 6 13 7 9 8 16 9 9 Total 100 Question 1. [12] Search
Package nlnet. April 8, 2018
 Type Package Package nlnet April 8, 2018 Title Nonlinear Network Reconstruction, Clustering, and Variable Selection Based on DCOL (Distance Based on Conditional Ordered List) Version 1.2 Date 2018-04-07
Classification and Regression
 Classification and Regression Announcements Study guide for exam is on the LMS Sample exam will be posted by Monday Reminder that phase 3 oral presentations are being held next week during workshops Plan
Supplementary Material
 Supplementary Material Figure 1S: Scree plot of the 400 dimensional data. The Figure shows the 20 largest eigenvalues of the (normalized) correlation matrix sorted in decreasing order; the insert shows
PSS718 - Data Mining
 Lecture 5 - Hacettepe University October 23, 2016 Data Issues Improving the performance of a model To improve the performance of a model, we mostly improve the data Source additional data Clean up the
Contents. Preface to the Second Edition
 Preface to the Second Edition v 1 Introduction 1 1.1 What Is Data Mining?....................... 4 1.2 Motivating Challenges....................... 5 1.3 The Origins of Data Mining....................
Correlation Motif Vignette
 Correlation Motif Vignette Hongkai Ji, Yingying Wei October 30, 2018 1 Introduction The standard algorithms for detecting differential genes from microarray data are mostly designed for analyzing a single
Lecture 4: Advanced Data Structures
 Lecture 4: Advanced Data Structures Prakash Gautam https://prakashgautam.com.np/6cs008 info@prakashgautam.com.np Agenda Heaps Binomial Heap Fibonacci Heap Hash Tables Bloom Filters Amortized Analysis 2
Package RobustRankAggreg
 Type Package Package RobustRankAggreg Title Methods for robust rank aggregation Version 1.1 Date 2010-11-14 Author Raivo Kolde, Sven Laur Maintainer February 19, 2015 Methods for aggregating ranked lists,
6-1 THE STANDARD NORMAL DISTRIBUTION
 6-1 THE STANDARD NORMAL DISTRIBUTION The major focus of this chapter is the concept of a normal probability distribution, but we begin with a uniform distribution so that we can see the following two very
![1. Select[] is used to select items meeting a specified criterion.](/thumbs/94/118473170.jpg "1. Select[] is used to select items meeting a specified criterion.")
BCLUST -- A program to assess reliability of gene clusters from expression data by using consensus tree and bootstrap resampling method
 BCLUST -- A program to assess reliability of gene clusters from expression data by using consensus tree and bootstrap resampling method Introduction This program is developed in the lab of Hongyu Zhao
Midterm Examination CS 540-2: Introduction to Artificial Intelligence
 Midterm Examination CS 54-2: Introduction to Artificial Intelligence March 9, 217 LAST NAME: FIRST NAME: Problem Score Max Score 1 15 2 17 3 12 4 6 5 12 6 14 7 15 8 9 Total 1 1 of 1 Question 1. [15] State
GenViewer Tutorial / Manual
 GenViewer Tutorial / Manual Table of Contents Importing Data Files... 2 Configuration File... 2 Primary Data... 4 Primary Data Format:... 4 Connectivity Data... 5 Module Declaration File Format... 5 Module
Package ctc. R topics documented: August 2, Version Date Depends amap. Title Cluster and Tree Conversion.
 Package ctc August 2, 2013 Version 1.35.0 Date 2005-11-16 Depends amap Title Cluster and Tree Conversion. Author Antoine Lucas , Laurent Gautier biocviews Microarray,
Package subtype. February 20, 2015
 Type Package Package subtype February 20, 2015 Title Cluster analysis to find molecular subtypes and their assessment Version 1.0 Date 2013-01-14 Author Andrey Alexeyenko, Woojoo Lee and Yudi Pawitan Maintainer
Package OrderedList. December 31, 2017
 Title Similarities of Ordered Gene Lists Version 1.50.0 Date 2008-07-09 Package OrderedList December 31, 2017 Author Xinan Yang, Stefanie Scheid, Claudio Lottaz Detection of similarities between ordered
The clusterrepro Package
 The clusterrepro Package February 22, 2006 Version 0.5-1 Date 2006-01-06 Title Reproducibility of gene expression clusters Author Amy Kapp and Rob Tibshirani
Objective of clustering
 Objective of clustering Discover structures and patterns in high-dimensional data. Group data with similar patterns together. This reduces the complexity and facilitates interpretation. Expression level
10. Clustering. Introduction to Bioinformatics Jarkko Salojärvi. Based on lecture slides by Samuel Kaski
 10. Clustering Introduction to Bioinformatics 30.9.2008 Jarkko Salojärvi Based on lecture slides by Samuel Kaski Definition of a cluster Typically either 1. A group of mutually similar samples, or 2. A
Visual Representations for Machine Learning
 Visual Representations for Machine Learning Spectral Clustering and Channel Representations Lecture 1 Spectral Clustering: introduction and confusion Michael Felsberg Klas Nordberg The Spectral Clustering
Evaluating Classifiers
 Evaluating Classifiers Reading for this topic: T. Fawcett, An introduction to ROC analysis, Sections 1-4, 7 (linked from class website) Evaluating Classifiers What we want: Classifier that best predicts
Screening Design Selection
 Screening Design Selection Summary... 1 Data Input... 2 Analysis Summary... 5 Power Curve... 7 Calculations... 7 Summary The STATGRAPHICS experimental design section can create a wide variety of designs
CPSC 340: Machine Learning and Data Mining. Outlier Detection Fall 2018
 CPSC 340: Machine Learning and Data Mining Outlier Detection Fall 2018 Admin Assignment 2 is due Friday. Assignment 1 grades available? Midterm rooms are now booked. October 18 th at 6:30pm (BUCH A102
Bayesian network: a toy example
 Module network Bayesian network: a toy example Variables X: STOCKS (space: {,, } ) MSFT: microso@ AMAT: Applied materials INTL: Intel MOT: Motorola DELL: Dell HPQ: HewleK- Packard AMAT MSFT MOT INTL CPD4
More about liquid association
 More about liquid association Liquid Association (LA) LA is a generalized notion of association for describing certain kind of ternary relationship between variables in a system. (Li 2002 PNAS) low (-)
Class Prediction Methods Applied to Microarray Data for Classification
 Class Prediction Methods Applied to Microarray Data for Classification Fatima.S. Shukir The Department of Statistic, Iraqi Commission for Planning and Follow up Directorate Computers and Informatics (ICCI),