Contents. ! Data sets. ! Distance and similarity metrics. ! K-means clustering. ! Hierarchical clustering. ! Evaluation of clustering results
|
|
|
- Elijah Holland
- 5 years ago
- Views:
Transcription


1 Statistical Analysis of Microarray Data Contents Data sets Distance and similarity metrics K-means clustering Hierarchical clustering Evaluation of clustering results Clustering Jacques van Helden Introduction to clustering Clustering is an unsupervised approach Starting from a set of objects, group them into classes, without any prior description of these classes There are many clustering methods hierarchical k-means self-organizing maps (SOM) knn The results vary drastically depending on clustering method similarity or dissimilarity metric additional parameters specific to each clustering method (e.g. number of centres for the k-mean, agglomeration rule for hierarchical clustering, ) Statistical Analysis of Microarray Data Data sets Jacques van Helden Jacques.van.Helden@ulb.ac.be Diauxic shift DeRisi et al published the first article describing a full-genome monitoring of gene expression data. This article reported an experiment called diauxic shift with with 7 time points. Initially, cells are grown in a glucose-rich medium. As time progresses, cells Consume glucose -> when glucose becomes limiting Glycolysis stops Gluconeogenesis is activated to produce glucose Produce by-products -> the culture medium becomes polluted/ Stress response Cell cycle data Spellman et al. (1998) Time profiles of yeast cells followed during cell cycle. Several experiments were regrouped, with various ways of synchronization (elutriation, cdc mutants, ) ~800 genes showing a periodic patterns of expression were selected (by Fourier analysis) DeRisi et al. Exploring the metabolic and genetic control of gene expression on a genomic scale. Science (1997) vol. 278 (5338) pp Spellman et al. Comprehensive identification of cell cycle-regulated genes of the yeast Saccharomyces cerevisiae by microarray hybridization. Mol Biol Cell (1998) vol. 9 (12) pp
 to E-value (=P-value*N) Only genes with an E-value < 1 were retained for clustering. 0.71-2.70-5.43 1.40 4.00 3.")

2 Threshold filtering Profiles of regulated genes We applied a chip-wise standardization (centring and scaling) with robust estimates (median and IQR) on each chip. Z-scores obtained after standardization were converted to P-value (normal distribution) to E-value (=P-value*N) Only genes with an E-value < 1 were retained for clustering raffinose.vs.ref.pool ORF YAL066W YAR008W YAR071W YBL005W YBL015W YBL043W YBR018C YBR019C YBR020W raffinose Carbon sources sucrose Z-scores mannose. Chip-wise standardization glucose Gene expression profiles sucrose.vs.ref.pool Filtering Filtering of carbon source data glucose.vs.ref.pool Gasch et al. Genomic expression programs in the response of yeast cells to environmental changes. Mol Biol Cell (2000) vol. 11 (12) pp mannose.vs.ref.pool For the cell cycle experiments, genes had already been filtered in the original publication. We used the 800 selected genes for the analysis. For the diauxic shift and carbon source experiments, each chip contain >6000 genes, most of which are un-regulated. Standardization Gasch et al. (2000), 173 chips (stress response, heat shock, drugs, carbon source, ) We selected the 13 chips with the response to different carbon sources. galactose.vs.ref.pool Data standardization and filtering ethanol.vs.ref.pool Gasch et al. Genomic expression programs in the response of yeast cells to environmental changes. Mol Biol Cell (2000) vol. 11 (12) pp ethanol Gasch et al. (2000), 173 chips (stress response, heat shock, drugs, carbon source, ) galactose Gene expression data - carbon sources fructose.vs.ref.pool Gene expression data response to environmental changes Hierarchical clustering of expression profiles Statistical Analysis of Microarray Data In 1998, Eisen et al. Implemented a software tool called Cluster, which combine hierarchical clustering and heatmap visualization. Applied it to extract clusters of coexpressed genes from various types of expression profiles. Hierarchical clustering Jacques van Helden Jacques.van.Helden@ulb.ac.be Eisen et al. Cluster analysis and display of genome-wide expression patterns. Proc Natl Acad Sci U S A (1998) vol. 95 (25) pp

3 Clustering with gene expression data Hierarchical clustering on gene expression data Gene expression profiles Chip-wise standardization Z-scores Gene expression profiles Chip-wise standardization Z-scores Threshold filtering Profiles of regulated genes Threshold filtering Profiles of regulated genes ethanol galactose glucose mannose. raffinose sucrose Carbon sources ORF YAL066W YAR008W YAR071W YBL005W YBL015W YBL043W YBR018C YBR019C YBR020W ethanol.vs.ref.pool fructose.vs.ref.pool galactose.vs.ref.pool glucose.vs.ref.pool mannose.vs.ref.pool raffinose.vs.ref.pool sucrose.vs.ref.pool Pairwise distance calculation Distance matrix YAL066W YAR008W YAR071W YBL005W YBL015W YBL043W YBR018C YBR019C YBR020W YBR054W YAL066W YAR008W YAR071W YBL005W YBL015W YBL043W YBR018C YBR019C YBR020W YBR054W Hierarchical clustering on gene expression data Gene expression profiles Chip-wise standardization Threshold filtering Pairwise distance calculation Tree building Hierarchical clustering Z-scores Profiles of regulated genes Distance matrix Tree Principle of tree building branch node root Distance matrix Tree representation c4 c3 object 1 c2 c1 object 2 object 3 object 1 object 5 object 4 object 2 object 3 leaf nodes object 4 object 5 object object object object object Hierarchical clustering is an aggregative clustering method takes as input a distance matrix progressively regroups the closest objects/ groups One needs to define a (dis)similarity metric between two groups. There are several possibilities Average linkage: the average distance between objects from groups A and B Single linkage: the distance between the closest objects from groups A and B Complete linkage: the distance between the most distant objects from groups A and B Algorithm (1) Assign each object to a separate cluster. (2) Find the pair of clusters with the shortest distance, and regroup them in a single cluster (3) Repeat (2) until there is a single cluster The result is a tree, whose intermediate nodes represent clusters N objects N-1 intermediate nodes Branch lengths represent distances between clusters Impact of the agglomeration rule The choice of the agglomeration rule has a strong impact on the structure of a tree resulting from hierarchical clustering. Those four trees were built from the same distance matrix, using 4 different agglomeration rules. The clustering order is completely different. Single-linkage typically creates nesting clusters ( Matryoshka dolls ). Complete and Ward linkage create more balanced trees. Note: the matrix was computed from a matrix of random numbers. The subjective impression of structure are thus complete artifacts. Isomorphism on a tree branch node root c4 branch node c4 root c3 c3 c2 c2 c1 c1 leaf 1 leaf 5 leaf 4 leaf 2 leaf 3 leaf 5 leaf 1 leaf 2 leaf 4 leaf 3 In a tree, the two children of any branch node can be swapped. The result is an isomorphic tree, considered as equivalent to the intial one. The two trees shown here are equivalent, however Top tree: leaf 1 is far away from leaf 2 Bottom tree: leaf 1 is neighbour from leaf 2 The vertical distance between two nodes does NOT reflect their actual distance The distance between two nodes is the sum of branch lengths.

4 Golub Impact of the linkage method (Euclidian distance for all the trees) Golub Effect of the distance metrics (complete linkage for all the trees) Golub Gene clustering Golub Ward Biclustering - Euclidian distance Gene clustering highlights groups of genes with similar expression profiles. Single Euclidian Biclustering consists in clustering the rows (genes) and the columns (samples) of the data set. This reveals some subgroups of samples. With the golub 1999 data set The AML and ALL patients are clearly separated at the top level of the tree There are apparently two clusters among the AML samples. Correlation Impact of distance metrics and agglomeration rules Dot product Golub Ward Biclustering - Dot product distance Biclustering consists in clustering the rows (genes) and the columns (samples) of the data set. This reveals some subgroups of samples. With the golub 1999 data set The AML and ALL patients are clearly separated at the top level of the tree There are apparently two clusters among the AML samples. Average Complete Ward

5 Golub Pruning the tree Impact of the linkage method Impact of the distance metric - complete linkage Ipact of the distance metric - single linkage
6 Hierarchical clustering on gene expression data Pruning and cutting the tree The tree can be cut at level k (starting from the root), which creates k clusters Gene expression profiles Chip-wise standardization Z-scores A k-group partitioning is obtained by collecting the leaves below each branch of the pruned tree Threshold filtering Profiles of regulated genes Pairwise distance calculation Distance matrix Hierarchical clustering Tree Tree cut Clusters Statistical Analysis of Microarray Data K-means clustering Clustering around mobile centres The number of centres (k) has to be specified a priori Algorithm (1) Arbitrarily select k initial centres (2) Assign each element to the closest centre (3) Re-calculate centres (mean position of the assigned elements) (4) Repeat (2) and (3) until one of the stopping conditions is reached the clusters are the same as in the previous iteration the difference between two iterations is smaller than a specified threshold the max number of iterations has been reached Jacques van Helden Jacques.van.Helden@ulb.ac.be
7 Mobile centres example - initial conditions Mobile centres example - first iteration Two sets of random points are randomly generated 200 points centred on (0,0) 50 points centred on (1,1) Two points are randomly chosen as seeds (blue dots) Step 1 Each dot is assigned to the cluster with the closest centre Centres are recalculated (blue star) on the basis of the new clusters Mobile centres example - second iteration Mobile centres example - after 3 iterations At each step, points are re-assigned to clusters centres are recalculated Cluster boundaries and centre positions evolve at each iteration At each step, points are re-assigned to clusters centres are recalculated Cluster boundaries and centre positions evolve at each iteration Mobile centres example - after 4 iterations Mobile centres example - after 5 iterations At each step, points are re-assigned to clusters centres are recalculated Cluster boundaries and centre positions evolve at each iteration At each step, points are re-assigned to clusters centres are recalculated Cluster boundaries and centre positions evolve at each iteration
8 Mobile centres example - after 6 iterations Mobile centres example - after 10 iterations At each step, points are re-assigned to clusters centres are recalculated Cluster boundaries and centre positions evolve at each iteration After some iterations (6 in this case), the clusters and centres do not change anymore Mobile centres example - random data K-means clustering K-means clustering is a variant of clustering around mobile centres After each assignation of an element to a centre, the position of this centre is recalculated The convergence is much faster than with the basic mobile centre algorithm after 1 iteration, the result might already be stable K-means is time- and memory-efficient for very large data sets (e.g. thousands of objects) Clustering with gene expression data Clustering can be performed in two ways Taking genes as objects and conditions/cell types as variables Taking conditions/cell types as objects and genes as variables Problem of dimensionality When genes are considered as variables, there are many more variables than objects Generally, only a very small fraction of the genes are regulated (e.g. 30 genes among 6,000) However, all genes will contribute equally to the distance metrics The noise will thus affect the calculated distances between conditions Solution Selection of a subset of strongly regulated genes before applying clustering to conditions/cell types K-means clustering K-means clustering is a variant of clustering around mobile centres After each assignation of an element to a centre, the position of this centre is recalculated The convergence is much faster than with the basic mobile centre algorithm after 1 iteration, the result might already be stable K-means is time- and memory-efficient for very large data sets (e.g. thousands of objects)


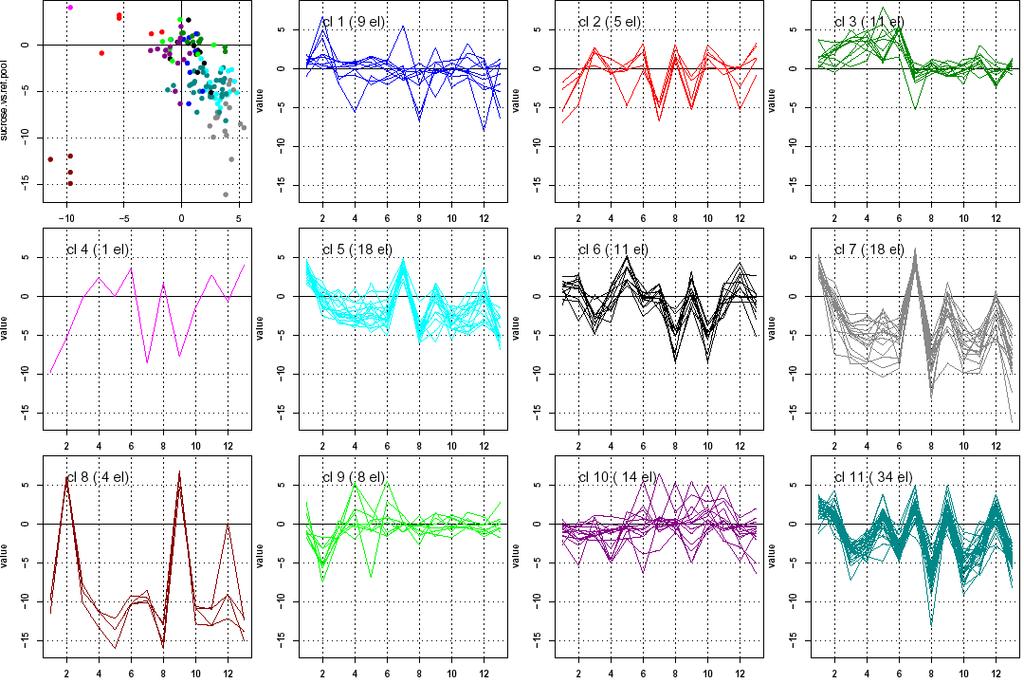
9 Diauxic shift: k-means clustering on all genes Diauxic shift: k-means clustering on filtered genes Diauxic shift: k-means clustering on permuted filtered genes Cell cycle data: K-means clustering Cell cycle data: K-means clustering, permuted data Carbon sources: K-means clustering


10 Golub - K-means clustering K-means clustering - summary Strengths Simple to use Fast Can be used with very large data sets Weaknesses The choice of the number of groups is arbitrary The results vary depending on the initial positions of centres The R implementation is based on Euclidian distance, no other metrics are proposed Solutions Try different values for k and compare the result For each value of k, run repeatedly to sample different initial conditions Weakness of the solution Instead of one clustering, you obtain hundreds of different clustering results, totaling thousands of clusters, how to decide among them Statistical Analysis of Microarray Data Evaluation of clustering results How to evaluate the result? It is very hard to make a choice between the multiple possibilities of distance metrics, clustering algorithms and parameters. Several criteria can be used to evaluate the clustering results Consensus: using different methods, comparing the results and extracting a consensus Robustness: running the same algorithm multiple times, with different initial conditions Bootstrap Jack-knife Test different initial positions for the k-means Biological relevance: compare the clustering result to functional annotations (functional catalogs, metabolic pathways, ) Jacques van Helden Jacques.van.Helden@ulb.ac.be Comparing two clustering results Evaluation of robustness - Bootstrap If two methods return partitions of the same size, their clusters can be compared in a confusion table Optimal correspondences between clusters can be established (permuting columns to maximize the diagonal) The consistency between the two classifications can then be estimated with the hit rate Example : Carbon source data, comparison of k-means and hierarchical clustering hierarchical clustering k-means clustering k1 k2 k3 k4 k5 k6 k7 Sum h h h h h h h Sum k-means clustering k4 k3 k5 k1 k2 k7 k6 Sum h h h h h h h Sum Correspondence between clusters hierarchical h1 h2 h3 h4 h5 h6 h7 k-means k4 k3 k5 k1 k2 k7 k6 hierarchical clustering Matches 84 Hit rate Mismatches 49 Error rate 63.2% 36.8% The bootstrap consists in repeating r times (for example r=100) the clustering, using each time Either a different subset of variables Or a different subset of objects The subset of variables is selected randomly, with resampling (i.e. the same variable can be present several times, whilst other variables are absent. On the images the tree is colored according to the reproducibility of the branches during a 100 time bootstrap.
Clustering Jacques van Helden
 Statistical Analysis of Microarray Data Clustering Jacques van Helden Jacques.van.Helden@ulb.ac.be Contents Data sets Distance and similarity metrics K-means clustering Hierarchical clustering Evaluation
Clustering, cont. Genome 373 Genomic Informatics Elhanan Borenstein. Some slides adapted from Jacques van Helden
 Clustering, cont Genome 373 Genomic Informatics Elhanan Borenstein Some slides adapted from Jacques van Helden Improving the search heuristic: Multiple starting points Simulated annealing Genetic algorithms
Clustering. k-mean clustering. Genome 559: Introduction to Statistical and Computational Genomics Elhanan Borenstein
 Clustering k-mean clustering Genome 559: Introduction to Statistical and Computational Genomics Elhanan Borenstein A quick review The clustering problem: homogeneity vs. separation Different representations
Clustering k-mean clustering
 Clustering k-mean clustering Genome 373 Genomic Informatics Elhanan Borenstein The clustering problem: partition genes into distinct sets with high homogeneity and high separation Clustering (unsupervised)
Supervised Clustering of Yeast Gene Expression Data
 Supervised Clustering of Yeast Gene Expression Data In the DeRisi paper five expression profile clusters were cited, each containing a small number (7-8) of genes. In the following examples we apply supervised
Gene expression & Clustering (Chapter 10)
") Gene expression & Clustering (Chapter 10) Determining gene function Sequence comparison tells us if a gene is similar to another gene, e.g., in a new species Dynamic programming Approximate pattern matching
Gene expression & Clustering (Chapter 10) Determining gene function Sequence comparison tells us if a gene is similar to another gene, e.g., in a new species Dynamic programming Approximate pattern matching
Genomics - Problem Set 2 Part 1 due Friday, 1/26/2018 by 9:00am Part 2 due Friday, 2/2/2018 by 9:00am
 Genomics - Part 1 due Friday, 1/26/2018 by 9:00am Part 2 due Friday, 2/2/2018 by 9:00am One major aspect of functional genomics is measuring the transcript abundance of all genes simultaneously. This was
EECS730: Introduction to Bioinformatics
 EECS730: Introduction to Bioinformatics Lecture 15: Microarray clustering http://compbio.pbworks.com/f/wood2.gif Some slides were adapted from Dr. Shaojie Zhang (University of Central Florida) Microarray
Exploratory data analysis for microarrays
 Exploratory data analysis for microarrays Jörg Rahnenführer Computational Biology and Applied Algorithmics Max Planck Institute for Informatics D-66123 Saarbrücken Germany NGFN - Courses in Practical DNA
Evaluation and comparison of gene clustering methods in microarray analysis
 Evaluation and comparison of gene clustering methods in microarray analysis Anbupalam Thalamuthu 1 Indranil Mukhopadhyay 1 Xiaojing Zheng 1 George C. Tseng 1,2 1 Department of Human Genetics 2 Department
What is clustering. Organizing data into clusters such that there is high intra- cluster similarity low inter- cluster similarity
 Clustering What is clustering Organizing data into clusters such that there is high intra- cluster similarity low inter- cluster similarity Informally, finding natural groupings among objects. High dimensional
Clustering Techniques
 Clustering Techniques Bioinformatics: Issues and Algorithms CSE 308-408 Fall 2007 Lecture 16 Lopresti Fall 2007 Lecture 16-1 - Administrative notes Your final project / paper proposal is due on Friday,
Genomics - Problem Set 2 Part 1 due Friday, 1/25/2019 by 9:00am Part 2 due Friday, 2/1/2019 by 9:00am
 Genomics - Part 1 due Friday, 1/25/2019 by 9:00am Part 2 due Friday, 2/1/2019 by 9:00am One major aspect of functional genomics is measuring the transcript abundance of all genes simultaneously. This was
Analyzing Genomic Data with NOJAH
 Analyzing Genomic Data with NOJAH TAB A) GENOME WIDE ANALYSIS Step 1: Select the example dataset or upload your own. Two example datasets are available. Genome-Wide TCGA-BRCA Expression datasets and CoMMpass
Biclustering Bioinformatics Data Sets. A Possibilistic Approach
 Possibilistic algorithm Bioinformatics Data Sets: A Possibilistic Approach Dept Computer and Information Sciences, University of Genova ITALY EMFCSC Erice 20/4/2007 Bioinformatics Data Sets Outline Introduction
ECS 234: Data Analysis: Clustering ECS 234
 : Data Analysis: Clustering What is Clustering? Given n objects, assign them to groups (clusters) based on their similarity Unsupervised Machine Learning Class Discovery Difficult, and maybe ill-posed
An Efficient Optimal Leaf Ordering for Hierarchical Clustering in Microarray Gene Expression Data Analysis
 An Efficient Optimal Leaf Ordering for Hierarchical Clustering in Microarray Gene Expression Data Analysis Jianting Zhang Le Gruenwald School of Computer Science The University of Oklahoma Norman, Oklahoma,
BBS654 Data Mining. Pinar Duygulu. Slides are adapted from Nazli Ikizler
 BBS654 Data Mining Pinar Duygulu Slides are adapted from Nazli Ikizler 1 Classification Classification systems: Supervised learning Make a rational prediction given evidence There are several methods for
Cluster Analysis. Angela Montanari and Laura Anderlucci
 Cluster Analysis Angela Montanari and Laura Anderlucci 1 Introduction Clustering a set of n objects into k groups is usually moved by the aim of identifying internally homogenous groups according to a
Clustering. Lecture 6, 1/24/03 ECS289A
 Clustering Lecture 6, 1/24/03 What is Clustering? Given n objects, assign them to groups (clusters) based on their similarity Unsupervised Machine Learning Class Discovery Difficult, and maybe ill-posed
SUPPLEMENTARY INFORMATION
 Supplementary Discussion 1: Rationale for Clustering Algorithm Selection Introduction: The process of machine learning is to design and employ computer programs that are capable to deduce patterns, regularities
CSE 5243 INTRO. TO DATA MINING
 CSE 5243 INTRO. TO DATA MINING Cluster Analysis: Basic Concepts and Methods Huan Sun, CSE@The Ohio State University 09/25/2017 Slides adapted from UIUC CS412, Fall 2017, by Prof. Jiawei Han 2 Chapter 10.
CSE 5243 INTRO. TO DATA MINING
 CSE 5243 INTRO. TO DATA MINING Cluster Analysis: Basic Concepts and Methods Huan Sun, CSE@The Ohio State University Slides adapted from UIUC CS412, Fall 2017, by Prof. Jiawei Han 2 Chapter 10. Cluster
3. Cluster analysis Overview
 Université Laval Multivariate analysis - February 2006 1 3.1. Overview 3. Cluster analysis Clustering requires the recognition of discontinuous subsets in an environment that is sometimes discrete (as
Differential Expression Analysis at PATRIC
 Differential Expression Analysis at PATRIC The following step- by- step workflow is intended to help users learn how to upload their differential gene expression data to their private workspace using Expression
9/29/13. Outline Data mining tasks. Clustering algorithms. Applications of clustering in biology
 9/9/ I9 Introduction to Bioinformatics, Clustering algorithms Yuzhen Ye (yye@indiana.edu) School of Informatics & Computing, IUB Outline Data mining tasks Predictive tasks vs descriptive tasks Example
Iterative Signature Algorithm for the Analysis of Large-Scale Gene Expression Data. By S. Bergmann, J. Ihmels, N. Barkai
 Iterative Signature Algorithm for the Analysis of Large-Scale Gene Expression Data By S. Bergmann, J. Ihmels, N. Barkai Reasoning Both clustering and Singular Value Decomposition(SVD) are useful tools
Supplementary text S6 Comparison studies on simulated data
 Supplementary text S Comparison studies on simulated data Peter Langfelder, Rui Luo, Michael C. Oldham, and Steve Horvath Corresponding author: shorvath@mednet.ucla.edu Overview In this document we illustrate
EMMA: An EM-based Imputation Technique for Handling Missing Sample-Values in Microarray Expression Profiles.
 EMMA: An EM-based Imputation Technique for Handling Missing Sample-Values in Microarray Expression Profiles. Amitava Karmaker 1 *, Edward A. Salinas 2, Stephen Kwek 3 1 University of Wisconsin-Stout, Menomonie,
10701 Machine Learning. Clustering
 171 Machine Learning Clustering What is Clustering? Organizing data into clusters such that there is high intra-cluster similarity low inter-cluster similarity Informally, finding natural groupings among
Clustering. CE-717: Machine Learning Sharif University of Technology Spring Soleymani
 Clustering CE-717: Machine Learning Sharif University of Technology Spring 2016 Soleymani Outline Clustering Definition Clustering main approaches Partitional (flat) Hierarchical Clustering validation
Hierarchical Clustering
 Hierarchical Clustering Hierarchical Clustering Produces a set of nested clusters organized as a hierarchical tree Can be visualized as a dendrogram A tree-like diagram that records the sequences of merges
University of California, Berkeley
 University of California, Berkeley U.C. Berkeley Division of Biostatistics Working Paper Series Year 2002 Paper 105 A New Partitioning Around Medoids Algorithm Mark J. van der Laan Katherine S. Pollard
CompClustTk Manual & Tutorial
 CompClustTk Manual & Tutorial Brandon King Copyright c California Institute of Technology Version 0.1.10 May 13, 2004 Contents 1 Introduction 1 1.1 Purpose.............................................
Hard clustering. Each object is assigned to one and only one cluster. Hierarchical clustering is usually hard. Soft (fuzzy) clustering
 clustering") An unsupervised machine learning problem Grouping a set of objects in such a way that objects in the same group (a cluster) are more similar (in some sense or another) to each other than to those in other
An unsupervised machine learning problem Grouping a set of objects in such a way that objects in the same group (a cluster) are more similar (in some sense or another) to each other than to those in other
GS Analysis of Microarray Data
 GS01 0163 Analysis of Microarray Data Keith Baggerly and Bradley Broom Department of Bioinformatics and Computational Biology UT MD Anderson Cancer Center kabagg@mdanderson.org bmbroom@mdanderson.org 19
Radmacher, M, McShante, L, Simon, R (2002) A paradigm for Class Prediction Using Expression Profiles, J Computational Biol 9:
 A paradigm for Class Prediction Using Expression Profiles, J Computational Biol 9:") Microarray Statistics Module 3: Clustering, comparison, prediction, and Go term analysis Johanna Hardin and Laura Hoopes Worksheet to be handed in the week after discussion Name Clustering algorithms:
Microarray Statistics Module 3: Clustering, comparison, prediction, and Go term analysis Johanna Hardin and Laura Hoopes Worksheet to be handed in the week after discussion Name Clustering algorithms:
Tutorial:OverRepresentation - OpenTutorials
 Tutorial:OverRepresentation From OpenTutorials Slideshow OverRepresentation (about 12 minutes) (http://opentutorials.rbvi.ucsf.edu/index.php?title=tutorial:overrepresentation& ce_slide=true&ce_style=cytoscape)
DYNAMIC CORE BASED CLUSTERING OF GENE EXPRESSION DATA. Received April 2013; revised October 2013
 International Journal of Innovative Computing, Information and Control ICIC International c 2014 ISSN 1349-4198 Volume 10, Number 3, June 2014 pp. 1051-1069 DYNAMIC CORE BASED CLUSTERING OF GENE EXPRESSION
Clustering in Data Mining
 Clustering in Data Mining Classification Vs Clustering When the distribution is based on a single parameter and that parameter is known for each object, it is called classification. E.g. Children, young,
Metabolomic Data Analysis with MetaboAnalyst
 Metabolomic Data Analysis with MetaboAnalyst User ID: guest6522519400069885256 April 14, 2009 1 Data Processing and Normalization 1.1 Reading and Processing the Raw Data MetaboAnalyst accepts a variety
Gene Clustering & Classification
 BINF, Introduction to Computational Biology Gene Clustering & Classification Young-Rae Cho Associate Professor Department of Computer Science Baylor University Overview Introduction to Gene Clustering
Lesson 3. Prof. Enza Messina
 Lesson 3 Prof. Enza Messina Clustering techniques are generally classified into these classes: PARTITIONING ALGORITHMS Directly divides data points into some prespecified number of clusters without a hierarchical
Measure of Distance. We wish to define the distance between two objects Distance metric between points:
 Measure of Distance We wish to define the distance between two objects Distance metric between points: Euclidean distance (EUC) Manhattan distance (MAN) Pearson sample correlation (COR) Angle distance
A Naïve Soft Computing based Approach for Gene Expression Data Analysis
 Available online at www.sciencedirect.com Procedia Engineering 38 (2012 ) 2124 2128 International Conference on Modeling Optimization and Computing (ICMOC-2012) A Naïve Soft Computing based Approach for
Unsupervised learning: Clustering & Dimensionality reduction. Theo Knijnenburg Jorma de Ronde
 Unsupervised learning: Clustering & Dimensionality reduction Theo Knijnenburg Jorma de Ronde Source of slides Marcel Reinders TU Delft Lodewyk Wessels NKI Bioalgorithms.info Jeffrey D. Ullman Stanford
10601 Machine Learning. Hierarchical clustering. Reading: Bishop: 9-9.2
 161 Machine Learning Hierarchical clustering Reading: Bishop: 9-9.2 Second half: Overview Clustering - Hierarchical, semi-supervised learning Graphical models - Bayesian networks, HMMs, Reasoning under
Missing Data Estimation in Microarrays Using Multi-Organism Approach
 Missing Data Estimation in Microarrays Using Multi-Organism Approach Marcel Nassar and Hady Zeineddine Progress Report: Data Mining Course Project, Spring 2008 Prof. Inderjit S. Dhillon April 02, 2008
Distance-based Methods: Drawbacks
 Distance-based Methods: Drawbacks Hard to find clusters with irregular shapes Hard to specify the number of clusters Heuristic: a cluster must be dense Jian Pei: CMPT 459/741 Clustering (3) 1 How to Find
Classification. Vladimir Curic. Centre for Image Analysis Swedish University of Agricultural Sciences Uppsala University
 Classification Vladimir Curic Centre for Image Analysis Swedish University of Agricultural Sciences Uppsala University Outline An overview on classification Basics of classification How to choose appropriate
Analyzing ICAT Data. Analyzing ICAT Data
 Analyzing ICAT Data Gary Van Domselaar University of Alberta Analyzing ICAT Data ICAT: Isotope Coded Affinity Tag Introduced in 1999 by Ruedi Aebersold as a method for quantitative analysis of complex
ECLT 5810 Clustering
 ECLT 5810 Clustering What is Cluster Analysis? Cluster: a collection of data objects Similar to one another within the same cluster Dissimilar to the objects in other clusters Cluster analysis Grouping
Supervised vs unsupervised clustering
 Classification Supervised vs unsupervised clustering Cluster analysis: Classes are not known a- priori. Classification: Classes are defined a-priori Sometimes called supervised clustering Extract useful
Random Forest Similarity for Protein-Protein Interaction Prediction from Multiple Sources. Y. Qi, J. Klein-Seetharaman, and Z.
 Random Forest Similarity for Protein-Protein Interaction Prediction from Multiple Sources Y. Qi, J. Klein-Seetharaman, and Z. Bar-Joseph Pacific Symposium on Biocomputing 10:531-542(2005) RANDOM FOREST
Clustering. RNA-seq: What is it good for? Finding Similarly Expressed Genes. Data... And Lots of It!
 RNA-seq: What is it good for? Clustering High-throughput RNA sequencing experiments (RNA-seq) offer the ability to measure simultaneously the expression level of thousands of genes in a single experiment!
A formal concept analysis approach to consensus clustering of multi-experiment expression data
 Hristoskova et al. BMC Bioinformatics 214, 15:151 METHODOLOGY ARTICLE Open Access A formal concept analysis approach to consensus clustering of multi-experiment expression data Anna Hristoskova 1*, Veselka
Clustering part II 1
 Clustering part II 1 Clustering What is Cluster Analysis? Types of Data in Cluster Analysis A Categorization of Major Clustering Methods Partitioning Methods Hierarchical Methods 2 Partitioning Algorithms:
Unsupervised Learning
 Outline Unsupervised Learning Basic concepts K-means algorithm Representation of clusters Hierarchical clustering Distance functions Which clustering algorithm to use? NN Supervised learning vs. unsupervised
Application of Hierarchical Clustering to Find Expression Modules in Cancer
 Application of Hierarchical Clustering to Find Expression Modules in Cancer T. M. Murali August 18, 2008 Innovative Application of Hierarchical Clustering A module map showing conditional activity of expression
APPLY DATA CLUSTERING TO GENE EXPRESSION DATA
 California State University, San Bernardino CSUSB ScholarWorks Electronic Theses, Projects, and Dissertations Office of Graduate Studies 12-2015 APPLY DATA CLUSTERING TO GENE EXPRESSION DATA Abdullah Jameel
Dimension reduction : PCA and Clustering
 Dimension reduction : PCA and Clustering By Hanne Jarmer Slides by Christopher Workman Center for Biological Sequence Analysis DTU The DNA Array Analysis Pipeline Array design Probe design Question Experimental
CLUSTERING IN BIOINFORMATICS
 CLUSTERING IN BIOINFORMATICS CSE/BIMM/BENG 8 MAY 4, 0 OVERVIEW Define the clustering problem Motivation: gene expression and microarrays Types of clustering Clustering algorithms Other applications of
3. Cluster analysis Overview
 Université Laval Analyse multivariable - mars-avril 2008 1 3.1. Overview 3. Cluster analysis Clustering requires the recognition of discontinuous subsets in an environment that is sometimes discrete (as
CHAPTER 4: CLUSTER ANALYSIS
 CHAPTER 4: CLUSTER ANALYSIS WHAT IS CLUSTER ANALYSIS? A cluster is a collection of data-objects similar to one another within the same group & dissimilar to the objects in other groups. Cluster analysis
Kapitel 4: Clustering
 Ludwig-Maximilians-Universität München Institut für Informatik Lehr- und Forschungseinheit für Datenbanksysteme Knowledge Discovery in Databases WiSe 2017/18 Kapitel 4: Clustering Vorlesung: Prof. Dr.
A STUDY ON DYNAMIC CLUSTERING OF GENE EXPRESSION DATA
 STUDIA UNIV. BABEŞ BOLYAI, INFORMATICA, Volume LIX, Number 1, 2014 A STUDY ON DYNAMIC CLUSTERING OF GENE EXPRESSION DATA ADELA-MARIA SÎRBU Abstract. Microarray and next-generation sequencing technologies
MSA220 - Statistical Learning for Big Data
 MSA220 - Statistical Learning for Big Data Lecture 13 Rebecka Jörnsten Mathematical Sciences University of Gothenburg and Chalmers University of Technology Clustering Explorative analysis - finding groups
ECLT 5810 Clustering
 ECLT 5810 Clustering What is Cluster Analysis? Cluster: a collection of data objects Similar to one another within the same cluster Dissimilar to the objects in other clusters Cluster analysis Grouping
A quick review. The clustering problem: Hierarchical clustering algorithm: Many possible distance metrics K-mean clustering algorithm:
 The clustering problem: partition genes into distinct sets with high homogeneity and high separation Hierarchical clustering algorithm: 1. Assign each object to a separate cluster.. Regroup the pair of
Understanding Clustering Supervising the unsupervised
 Understanding Clustering Supervising the unsupervised Janu Verma IBM T.J. Watson Research Center, New York http://jverma.github.io/ jverma@us.ibm.com @januverma Clustering Grouping together similar data
Cluster Analysis. Ying Shen, SSE, Tongji University
 Cluster Analysis Ying Shen, SSE, Tongji University Cluster analysis Cluster analysis groups data objects based only on the attributes in the data. The main objective is that The objects within a group
Clustering analysis of gene expression data
 Clustering analysis of gene expression data Chapter 11 in Jonathan Pevsner, Bioinformatics and Functional Genomics, 3 rd edition (Chapter 9 in 2 nd edition) Human T cell expression data The matrix contains
Clustering gene expression data
 Clustering gene expression data 1 How Gene Expression Data Looks Entries of the Raw Data matrix: Ratio values Absolute values Row = gene s expression pattern Column = experiment/condition s profile genes
Biological Networks Analysis
 Biological Networks Analysis Introduction and Dijkstra s algorithm Genome 559: Introduction to Statistical and Computational Genomics Elhanan Borenstein The clustering problem: partition genes into distinct
Cluster Analysis. Mu-Chun Su. Department of Computer Science and Information Engineering National Central University 2003/3/11 1
 Cluster Analysis Mu-Chun Su Department of Computer Science and Information Engineering National Central University 2003/3/11 1 Introduction Cluster analysis is the formal study of algorithms and methods
ChromHMM: automating chromatin-state discovery and characterization
 Nature Methods ChromHMM: automating chromatin-state discovery and characterization Jason Ernst & Manolis Kellis Supplementary Figure 1 Supplementary Figure 2 Supplementary Figure 3 Supplementary Figure
CS 1675 Introduction to Machine Learning Lecture 18. Clustering. Clustering. Groups together similar instances in the data sample
 CS 1675 Introduction to Machine Learning Lecture 18 Clustering Milos Hauskrecht milos@cs.pitt.edu 539 Sennott Square Clustering Groups together similar instances in the data sample Basic clustering problem:
/ Computational Genomics. Normalization
 10-810 /02-710 Computational Genomics Normalization Genes and Gene Expression Technology Display of Expression Information Yeast cell cycle expression Experiments (over time) baseline expression program
Expander Online Documentation
 Expander Online Documentation Table of Contents Introduction...1 Starting EXPANDER...2 Input Data...4 Preprocessing GE Data...8 Viewing Data Plots...12 Clustering GE Data...14 Biclustering GE Data...17
PAM algorithm. Types of Data in Cluster Analysis. A Categorization of Major Clustering Methods. Partitioning i Methods. Hierarchical Methods
 Whatis Cluster Analysis? Clustering Types of Data in Cluster Analysis Clustering part II A Categorization of Major Clustering Methods Partitioning i Methods Hierarchical Methods Partitioning i i Algorithms:
INF4820 Algorithms for AI and NLP. Evaluating Classifiers Clustering
 INF4820 Algorithms for AI and NLP Evaluating Classifiers Clustering Erik Velldal & Stephan Oepen Language Technology Group (LTG) September 23, 2015 Agenda Last week Supervised vs unsupervised learning.
Finding Clusters 1 / 60
 Finding Clusters Types of Clustering Approaches: Linkage Based, e.g. Hierarchical Clustering Clustering by Partitioning, e.g. k-means Density Based Clustering, e.g. DBScan Grid Based Clustering 1 / 60
ViTraM: VIsualization of TRAnscriptional Modules
 ViTraM: VIsualization of TRAnscriptional Modules Version 1.0 June 1st, 2009 Hong Sun, Karen Lemmens, Tim Van den Bulcke, Kristof Engelen, Bart De Moor and Kathleen Marchal KULeuven, Belgium 1 Contents
Clustering Part 3. Hierarchical Clustering
 Clustering Part Dr Sanjay Ranka Professor Computer and Information Science and Engineering University of Florida, Gainesville Hierarchical Clustering Two main types: Agglomerative Start with the points
ViTraM: VIsualization of TRAnscriptional Modules
 ViTraM: VIsualization of TRAnscriptional Modules Version 2.0 October 1st, 2009 KULeuven, Belgium 1 Contents 1 INTRODUCTION AND INSTALLATION... 4 1.1 Introduction...4 1.2 Software structure...5 1.3 Requirements...5
Computing with large data sets
 Computing with large data sets Richard Bonneau, spring 2009 Lecture 8(week 5): clustering 1 clustering Clustering: a diverse methods for discovering groupings in unlabeled data Because these methods don
Clustering and Classification. Basic principles of clustering. Clustering. Classification
 Classification Clustering and Classification Task: assign objects to classes (groups) on the basis of measurements made on the objects Jean Yee Hwa Yang University of California, San Francisco http://www.biostat.ucsf.edu/jean/
Triclustering in Gene Expression Data Analysis: A Selected Survey
 Triclustering in Gene Expression Data Analysis: A Selected Survey P. Mahanta, H. A. Ahmed Dept of Comp Sc and Engg Tezpur University Napaam -784028, India Email: priyakshi@tezu.ernet.in, hasin@tezu.ernet.in
Hierarchical Clustering
 What is clustering Partitioning of a data set into subsets. A cluster is a group of relatively homogeneous cases or observations Hierarchical Clustering Mikhail Dozmorov Fall 2016 2/61 What is clustering
Algorithms for Bounded-Error Correlation of High Dimensional Data in Microarray Experiments
 Algorithms for Bounded-Error Correlation of High Dimensional Data in Microarray Experiments Mehmet Koyutürk, Ananth Grama, and Wojciech Szpankowski Department of Computer Sciences, Purdue University West
Outlier Detection and Removal Algorithm in K-Means and Hierarchical Clustering
 World Journal of Computer Application and Technology 5(2): 24-29, 2017 DOI: 10.13189/wjcat.2017.050202 http://www.hrpub.org Outlier Detection and Removal Algorithm in K-Means and Hierarchical Clustering
Cluster Analysis. Prof. Thomas B. Fomby Department of Economics Southern Methodist University Dallas, TX April 2008 April 2010
 Cluster Analysis Prof. Thomas B. Fomby Department of Economics Southern Methodist University Dallas, TX 7575 April 008 April 010 Cluster Analysis, sometimes called data segmentation or customer segmentation,
Machine Learning : Clustering, Self-Organizing Maps
 Machine Learning Clustering, Self-Organizing Maps 12/12/2013 Machine Learning : Clustering, Self-Organizing Maps Clustering The task: partition a set of objects into meaningful subsets (clusters). The
Visual Representations for Machine Learning
 Visual Representations for Machine Learning Spectral Clustering and Channel Representations Lecture 1 Spectral Clustering: introduction and confusion Michael Felsberg Klas Nordberg The Spectral Clustering
Boosted Optimization for Network Classification. Bioinformatics Center Kyoto University
 Boosted Optimization for Network Classification Timothy Hancock Hiroshi Mamitsuka Bioinformatics Center Kyoto University 2 of 22 Motivation We want to construct a classifier that has good performance where
INF4820 Algorithms for AI and NLP. Evaluating Classifiers Clustering
 INF4820 Algorithms for AI and NLP Evaluating Classifiers Clustering Murhaf Fares & Stephan Oepen Language Technology Group (LTG) September 27, 2017 Today 2 Recap Evaluation of classifiers Unsupervised
Microarray data analysis
 Microarray data analysis Computational Biology IST Technical University of Lisbon Ana Teresa Freitas 016/017 Microarrays Rows represent genes Columns represent samples Many problems may be solved using
FPF-SB: a Scalable Algorithm for Microarray Gene Expression Data Clustering
 FPF-SB: a Scalable Algorithm for Microarray Gene Expression Data Clustering Filippo Geraci 1,3, Mauro Leoncini 2,1, Manuela Montangero 2,1, Marco Pellegrini 1, and M. Elena Renda 1 1 CNR, Istituto di Informatica
Stats 170A: Project in Data Science Exploratory Data Analysis: Clustering Algorithms
 Stats 170A: Project in Data Science Exploratory Data Analysis: Clustering Algorithms Padhraic Smyth Department of Computer Science Bren School of Information and Computer Sciences University of California,
Seeing the wood for the trees: Analysing multiple alternative phylogenies
 Seeing the wood for the trees: Analysing multiple alternative phylogenies Tom M. W. Nye, Newcastle University tom.nye@ncl.ac.uk Isaac Newton Institute, 17 December 2007 Multiple alternative phylogenies