Hiding or Discarding Insignificant Rows in a Report Template
|
|
|
- Melina Bruce
- 5 years ago
- Views:
Transcription


1 Hiding or Discarding Insignificant Rows in a Report Template Objective: This lesson will familiarize you with the following: what the ZeroingII add-in function is how to prepare your report to use the ZeroingII function how to configure the ZeroingII add-in function Add-ins are functions which you can set to automatically execute in Excel when a report is run. What is the ZeroingII Add-In Function? The ZeroingII add-in is part of the General Excel Extensions add-in library module and is used when you don t want insignificant rows to be visible in your reports. Why use the ZeroingII Add-In Function? A report can contain rows of data which have no influence on the report. By hiding these rows, your report will be concise, neater and easier to interpret. ZeroingII is most commonly used to hide rows when there are zero values in all of the columns. In the following example an income statement was created without using the ZeroingII add-in and then rerun with the ZeroingII add-in configured. Notice all of the highlighted rows which had no value have been hidden.


2 Preparing your report for the ZeroingII Add-In Function It s best to create a new column that totals the data (using the Sum function) and use the new total column in the ZeroingII Column to Check parameter. That way only rows that have zero values in all columns will be hidden. Creating a New Total Column in Excel We will use the SUM function which will add the numbers in a range of cells. Its syntax is: =SUM(number1, number2,...number30). The arguments (e.g. number1) for the SUM function can be cell references, or typed into the formula. The following example uses one argument -- a reference to cells F9:H9. 1. Select the blank cell in a new column after the cells that you want to sum, cell J9 in this example. 2. In the formula bar, type the sum function to include all of the columns you require, for example, =SUM(F9:H9) 3. Press the Enter key. 4. Use the fill handle to drag the formula down to include all of the rows you require. 5. In rows where you d like to leave a blank row for formatting purposes, replace the formula with an X. 6. To hide the total column you just created so it s not visible in your report; right-click on the column and select Hide. 7. In Report Manager, click Save Excel Template to save the report with it's new column. Use the total column, column J in this example as your Column to Check setting in the ZeroingII function parameters window explained below.


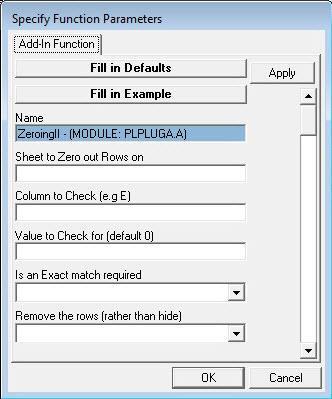
3 Configuring the ZeroingII Add-In Function Rows are discarded or hidden based on a specified columns value. 1. Open the Report Manager. 2. Select the report that you want to use the ZeroingII add-in on. 3. Enable the Show Advanced properties of the report at the bottom of the properties window. 4. Select the Run Add-Ins ellipses button. 5. If prompted select Specify a new Add-Inn Function and click OK 6. Select the Add-In Library: Alchemex Add-In Select the Add-In Library Module: General Excel extensions Module. 8. Select the Add-In Function: ZeroingII. 9. Click OK. The Specify Function Parameters window will appear.
4
5 Parameter Sheet to Zero cut Rows on Description Type the Excel worksheet name to check for values in Example : Income Statement Income Statement Column to Check Type in the Excel column to check for values J Value to Check for This is usually 0 as we are wanting to remove all rows which have a zero value 0 Is an Exact match required Specify Yes to only apply if an exact match is found Yes Remove the rows Specify Yes to permanently remove the rows or No to hide the rows No 10. When you have entered your details, select OK. You will notice that a string has been added into the Run Add-Ins box in the properties window of your report. 11. You can now run your report and verify that it has hidden the correct rows. The add-in will now automatically run each time the report is run.
Sage 300 Intelligence Reporting Editing an Existing Report Template to include Dynamic Ranges
 Sage 300 Intelligence Reporting Editing an Existing Report Template to include Dynamic Ranges 25 06 2015 Table of Contents About Dynamic Account Ranges... 1 Editing an Existing Report Template to use Dynamic
Simply Accounting Intelligence Tips and Tricks Booklet Vol. 1
 Simply Accounting Intelligence Tips and Tricks Booklet Vol. 1 1 Contents Accessing the SAI reports... 3 Copying, Pasting and Renaming Reports... 4 Creating and linking a report... 6 Auto e-mailing reports...
Starting Excel application
 MICROSOFT EXCEL 1 2 Microsoft Excel: is a special office program used to apply mathematical operations according to reading a cell automatically, just click on it. It is called electronic tables Starting
Table of Contents. Tip 1: Page setup 3. Tip 2: Printing different ranges in a spreadsheet 5. Tip 3: Ensuring that a long formula is displayed 6
 Table of Contents Tip 1: Page setup 3 Tip 2: Printing different ranges in a spreadsheet 5 Tip 3: Ensuring that a long formula is displayed 6 Tip 4: Displaying two worksheets at the same time 7 Tip 5: How
MAS 90/200 Intelligence Tips and Tricks Booklet Vol. 1
 MAS 90/200 Intelligence Tips and Tricks Booklet Vol. 1 1 Contents Accessing the Sage MAS Intelligence Reports... 3 Copying, Pasting and Renaming Reports... 4 To create a new report from an existing report...
Let s start by examining an Excel worksheet for the linear programming. Maximize P 70x 120y. subject to
 Excel is a useful tool for solving linear programming problems. In this question we ll solve and analyze our manufacturing problem with Excel. Although this problem can easily be solved graphically or
Excel Formulas & Functions I CS101
 Excel Formulas & Functions I CS101 Topics Covered Use statistical functions Use cell references Use AutoFill Write formulas Use the RANK.EQ function Calculation in Excel Click the cell where you want to
Microsoft Excel 2010
 Microsoft Excel 2010 omar 2013-2014 First Semester 1. Exploring and Setting Up Your Excel Environment Microsoft Excel 2010 2013-2014 The Ribbon contains multiple tabs, each with several groups of commands.
Intermediate Excel Training Course Content
 Intermediate Excel Training Course Content Lesson Page 1 Absolute Cell Addressing 2 Using Absolute References 2 Naming Cells and Ranges 2 Using the Create Method to Name Cells 3 Data Consolidation 3 Consolidating
The Ribbon The Ribbon contains multiple tabs, each with several groups of commands. You can add your own tabs that contain your favorite commands.
 Lesson1-Getting Star with excel Excel is a spreadsheet program that allows you to store, organize, and analyze information. In this lesson, you will learn your way around the Excel 2010 environment, including
Candy is Dandy Project (Project #12)
") Candy is Dandy Project (Project #12) You have been hired to conduct some market research about M&M's. First, you had your team purchase 4 large bags and the results are given for the contents of those
Candy is Dandy Project (Project #12) You have been hired to conduct some market research about M&M's. First, you had your team purchase 4 large bags and the results are given for the contents of those
Inserting or deleting a worksheet
 Inserting or deleting a worksheet To insert a new worksheet at the end of the existing worksheets, just click the Insert Worksheet tab at the bottom of the screen. To insert a new worksheet before an existing
Microsoft Office Excel Create a worksheet group. A worksheet group. Tutorial 6 Working With Multiple Worksheets and Workbooks
 Microsoft Office Excel 2003 Tutorial 6 Working With Multiple Worksheets and Workbooks 1 Create a worksheet group A workbook is a collection of worksheets. You may want to work with the worksheets within
PHLI Instruction (734) Introduction. Lists.
 Introduction. Lists.") INTERMEDIATE EXCEL Introduction Microsoft Excel has many purposes. In addition to being an excellent data manger, Excel provides the means to perform complex analysis and evaluation of data. This brief
INTERMEDIATE EXCEL Introduction Microsoft Excel has many purposes. In addition to being an excellent data manger, Excel provides the means to perform complex analysis and evaluation of data. This brief
Intermediate Excel 2016
 Intermediate Excel 2016 Relative & Absolute Referencing Relative Referencing When you copy a formula to another cell, Excel automatically adjusts the cell reference to refer to different cells relative
Introduction to Excel 2013
 Introduction to Excel 2013 Copyright 2014, Software Application Training, West Chester University. A member of the Pennsylvania State Systems of Higher Education. No portion of this document may be reproduced
Using Microsoft Excel
 Using Microsoft Excel Files in Microsoft Excel are referred to as Workbooks. This is because they can contain more than one sheet. The number of sheets a workbook can contain is only limited by your computer
Excel QuickGuide 1 The AVERAGE Function
 8 USING EXCEL FUNCTIONS: COMPUTING AVERAGES Excel QuickGuide 1 The AVERAGE Function What the AVERAGE Function Does The AVERAGE function takes a set of values and computes the arithmetic mean, which is
SPREADSHEET (Excel 2007)
") SPREADSHEET (Excel 2007) 1 U N I T 0 4 BY I F T I K H A R H U S S A I N B A B U R Spreadsheet Microsoft Office Excel 2007 (or Excel) is a computer program used to enter, analyze, and present quantitative
SPREADSHEET (Excel 2007) 1 U N I T 0 4 BY I F T I K H A R H U S S A I N B A B U R Spreadsheet Microsoft Office Excel 2007 (or Excel) is a computer program used to enter, analyze, and present quantitative
Excel 2010: Getting Started with Excel
 Excel 2010: Getting Started with Excel Excel 2010 Getting Started with Excel Introduction Page 1 Excel is a spreadsheet program that allows you to store, organize, and analyze information. In this lesson,
Microsoft Excel Microsoft Excel
 Excel 101 Microsoft Excel is a spreadsheet program that can be used to organize data, perform calculations, and create charts and graphs. Spreadsheets or graphs created with Microsoft Excel can be imported
WHY USE EXCEL? KEY EXCEL TERMINOLOGY
 WHY USE EXCEL? Excel allows users to organize, format, and calculate data with formulas using a spreadsheet system broken up by rows and columns. Excel allows us the ability to create templates with multiple
3/31/2016. Spreadsheets. Spreadsheets. Spreadsheets and Data Management. Unit 3. Can be used to automatically
 MICROSOFT EXCEL and Data Management Unit 3 Thursday March 31, 2016 Allow users to perform simple and complex sorting Allow users to perform calculations quickly Organizes and presents figures that can
Microsoft Office Excel 2007
 Microsoft Office Excel 2007 Data Processing in Spreadsheets 1/28/2009 Microsoft Excel 1 Use Excel s functions! A function is a predefined (built-in) formula for commonly used calculations. Each Excel function
Excel Forecasting Tools Review
 Excel Forecasting Tools Review Duke MBA Computer Preparation Excel Forecasting Tools Review Focus The focus of this assignment is on four Excel 2003 forecasting tools: The Data Table, the Scenario Manager,
Application of Skills: Microsoft Excel 2013 Tutorial
 Application of Skills: Microsoft Excel 2013 Tutorial Throughout this module, you will progress through a series of steps to create a spreadsheet for sales of a club or organization. You will continue to
Data. Selecting Data. Sorting Data
 1 of 1 Data Selecting Data To select a large range of cells: Click on the first cell in the area you want to select Scroll down to the last cell and hold down the Shift key while you click on it. This
Pivot Tables, Lookup Tables and Scenarios
 Introduction Format and manipulate data using pivot tables. Using a grading sheet as and example you will be shown how to set up and use lookup tables and scenarios. Contents Introduction Contents Pivot
1. Right-click the worksheet tab you want to rename. The worksheet menu appears. 2. Select Rename.
 Excel 2010 Worksheet Basics Introduction Page 1 Every Excel workbook contains at least one or more worksheets. If you are working with a large amount of related data, you can use worksheets to help organize
Microsoft How to Series
 Microsoft How to Series Getting Started with EXCEL 2007 A B C D E F Tabs Introduction to the Excel 2007 Interface The Excel 2007 Interface is comprised of several elements, with four main parts: Office
Consolidate and Summarizing Data from Multiple Worksheets
 Consolidate and Summarizing Data from Multiple Worksheets There are a few methods to summarize data from different worksheets in a workbook. You can use the Consolidate command, in the Data Tools group
Excel Intermediate
 Excel 2013 - Intermediate (103-124) Multiple Worksheets Quick Links Manipulating Sheets Pages EX16 EX17 Copying Worksheets Page EX337 Grouping Worksheets Pages EX330 EX332 Multi-Sheet Cell References Page
Using Numbers, Formulas, and Functions
 UNIT FOUR: Using Numbers, Formulas, and Functions T o p i c s : Using the Sort function Create a one-input data table Hide columns Resize columns Calculate with formulas Explore functions I. Using the
Getting Started with Excel
 Getting Started with Excel Introduction Excel is a spreadsheet program that allows you to store, organize, and analyze information. In this lesson, you will learn your way around the Excel 2010 environment,
Microsoft Excel Chapter 1. Creating a Worksheet and a Chart
 Microsoft Excel 2013 Chapter 1 Creating a Worksheet and a Chart Objectives Describe the Excel worksheet Enter text and numbers Use the Sum button to sum a range of cells Enter a simple function Copy the
Interim Standards New Directions Workbook One EASI Tool Excel Support Document Contents:
 Interim Standards New Directions Workbook One EASI Tool Excel Support Document Contents: 1. EASI Tool Template.... 2 2. Accessing and Saving the Tool Template.... 2 3. Screen View... 3 4. Comments/Guidance
Tips and Tricks Alchemex for MYOB Account Right
 Tips and Tricks Alchemex for MYOB Account Right Table of Contents Auto e-mailing reports... 1 Automatically Running Macros... 4 Creating new Macros from Excel... 4 Compact Metadata Functionality... 6 Copying,
Separate Text Across Cells The Convert Text to Columns Wizard can help you to divide the text into columns separated with specific symbols.
 Chapter 7 Highlights 7.1 The Use of Formulas and Functions 7.2 Creating Charts 7.3 Using Chart Toolbar 7.4 Changing Source Data of a Chart Separate Text Across Cells The Convert Text to Columns Wizard
Creating an Excel resource
 Excel Mobile Excel Mobile is a Microsoft application similar to Excel, but designed to run on handhelds. This mobile version of Excel is a spreadsheet application that allows you to manipulate numbers,
OX Documents Release v Feature Overview
 OX Documents Release v7.8.4 Feature Overview 1 Objective of this Document... 3 1.1 The Purpose of this Document... 3 2 General Improvements... 4 2.1 Security First: Working with Encrypted Files (OX Guard)...
PowerScheduler Course Tally Worksheet instructions.
 PowerScheduler Course Tally Worksheet instructions. This document will describe the process of copying course request information from PowerSchool into an Excel Course Tally Worksheet. Once the information
Chapter 4. Microsoft Excel
 Chapter 4 Microsoft Excel Topic Introduction Spreadsheet Basic Screen Layout Modifying a Worksheet Formatting Cells Formulas and Functions Sorting and Filling Borders and Shading Charts Introduction A
Empower and invest in yourself WORKBOOK MICROSOFT EXCEL INTERMEDIATE
 Empower and invest in yourself WORKBOOK MICROSOFT EXCEL INTERMEDIATE 2 Workbook Microsoft Excel Intermediate onlineacademy.co.za MODULE 01 CUSTOMISING THE EXCEL ENVIRONMENT Customising the Excel environment
1. Math symbols Operation Symbol Example Order
 Excel 2 Microsoft Excel 2013 Mercer County Library System Brian M. Hughes, County Executive Excel s Order of Calculation 1. Math symbols Operation Symbol Example Order Parentheses ( ) =(4+2)*8 1st Exponents
Table of Contents. 1. Creating a Microsoft Excel Workbook...1 EVALUATION COPY
 Table of Contents Table of Contents 1. Creating a Microsoft Excel Workbook...1 Starting Microsoft Excel...1 Creating a Workbook...2 Saving a Workbook...3 The Status Bar...5 Adding and Deleting Worksheets...6
Structured Solutions Inc. Tools MS Project to Excel Export/Import Tools
 Structured Solutions Inc. Tools MS Project to Excel Export/Import Tools This Macro Enabled Excel workbook contains a collection of useful tools that enables the user to Get, Post or Lookup data from MS
INTRODUCTION... 1 UNDERSTANDING CELLS... 2 CELL CONTENT... 4
 Introduction to Microsoft Excel 2016 INTRODUCTION... 1 The Excel 2016 Environment... 1 Worksheet Views... 2 UNDERSTANDING CELLS... 2 Select a Cell Range... 3 CELL CONTENT... 4 Enter and Edit Data... 4
MODULE VI: MORE FUNCTIONS
 MODULE VI: MORE FUNCTIONS Copyright 2012, National Seminars Training More Functions Using the VLOOKUP and HLOOKUP Functions Lookup functions look up values in a table and return a result based on those
Excel 2013 Getting Started
 Excel 2013 Getting Started Introduction Excel 2013 is a spreadsheet program that allows you to store, organize, and analyze information. While you may think that Excel is only used by certain people to
MS Excel How To Use VLOOKUP In Microsoft Excel
 MS Excel 2013 How To Use VLOOKUP In Microsoft Excel Use VLOOKUP function to find data you don t know in a large Excel spreadsheet, by entering a data you know VLOOKUP function contains of arguments in
Using Tables, Sparklines and Conditional Formatting. Module 5. Adobe Captivate Wednesday, May 11, 2016
 Slide 1 - Using Tables, Sparklines and Conditional Formatting Using Tables, Sparklines and Conditional Formatting Module 5 Page 1 of 27 Slide 2 - Lesson Objectives Lesson Objectives Explore the find and
Technical White Paper
 Technical White Paper Via Excel (VXL) Item Templates This technical white paper is designed for Spitfire Project Management System users. In this paper, you will learn how to create Via Excel Item Templates
Business Intelligence Centre. Pastel Accounting BIC. Tips and Tricks
 Business Intelligence Centre Pastel Accounting BIC Tips and Tricks Contents Creating and linking a report... 3 Copy and Pasting BIC Reports... 6 Importing and exporting BIC reports... 8 Automatically distribute
Excel Simulations - 1
 Excel Simulations - [] We are going to look at a number of ways Excel can be used to create worksheet simulations that help students visualize concepts. The first type of simulation we will create will
How to Create Excel Dashboard used in Solutions Conference By Matt Mason
 How to Create Excel Dashboard used in Solutions Conference 2017 By Matt Mason The following is a step by step procedure to create the Dashboard presented by Matt Mason in the Excel Tips and Tricks session
Unit 3 Fill Series, Functions, Sorting
 Unit 3 Fill Series, Functions, Sorting Fill enter repetitive values or formulas in an indicated direction Using the Fill command is much faster than using copy and paste you can do entire operation in
Sort, Filter, Pivot Table
 Sort, Filter, Pivot Table Sort A common database task is to rearrange the information based on a header/field or headers/fields. This is called Sorting or Filtering. Sorting rearranges all of the information
Excel 2007: Functions and Forumlas Learning Guide
 Excel 2007: Functions and Forumlas Learning Guide Functions and Formulas: An Overview Excel uses functions (mathematical expressions already available in Excel) and formulas (mathematical expressions that
Unit 3 Functions Review, Fill Series, Sorting, Merge & Center
 Unit 3 Functions Review, Fill Series, Sorting, Merge & Center Function built-in formula that performs simple or complex calculations automatically names a function instead of using operators (+, -, *,
INSERT SUBTOTALS Database Exercise Sort the Data Department Department Data Tab Sort and Filter Group
 INSERT SUBTOTALS Subtotals are used to summarize data in a range of data. This command offers many kinds of summary information, including counts, sums, averages, minimums, and maximums. When this feature
How to Export Data from LIS and analyze in with an Excel Pivot table
 How to Export Data from LIS and analyze in with an Excel Pivot table All machine stops are captured within LIS and are displayed in the TPM interface screen. This TPM Interface screen shows the machine
Business Intelligence Centre Pastel Evolution BIC. Tips and Tricks Volume 1
 Business Intelligence Centre Pastel Evolution BIC Tips and Tricks Volume 1 Table of Contents Creating and linking a report... 3 Copy and Pasting BIC Reports... 7 Importing and exporting BIC reports...
Skills Exam Objective Objective Number
 Overview 1 LESSON SKILL MATRIX Skills Exam Objective Objective Number Starting Excel Create a workbook. 1.1.1 Working in the Excel Window Customize the Quick Access Toolbar. 1.4.3 Changing Workbook and
Computer with Microsoft Excel Printer (optional) STUDENT WORKSHEET: Using Microsoft Excel to Record Weather Observations
 STUDENT WORKSHEET: Using Microsoft Excel to Record Weather Observations") Basic Excel Overview: Microsoft Excel is a spreadsheet application. It is a flexible program that can be used to perform calculations on numerical data, graph data and as a simple database. In this lesson
Basic Excel Overview: Microsoft Excel is a spreadsheet application. It is a flexible program that can be used to perform calculations on numerical data, graph data and as a simple database. In this lesson
Microsoft Office Excel 2007: Basic. Course Overview. Course Length: 1 Day. Course Overview
 Microsoft Office Excel 2007: Basic Course Length: 1 Day Course Overview This course teaches the basic functions and features of Excel 2007. After an introduction to spreadsheet terminology and Excel's
Visual Streamline FAQ
 Visual Streamline FAQ How does the Template Import Work? The Template Import routine enables you to import new inventory items, as well as New Supplier List Records, and make changes to existing Inventory
Reference Services Division Presents. Excel Introductory Course
 Reference Services Division Presents Excel 2007 Introductory Course OBJECTIVES: Navigate Comfortably in the Excel Environment Create a basic spreadsheet Learn how to format the cells and text Apply a simple
ADVANCED INQUIRIES IN ALBEDO: PART 2 EXCEL DATA PROCESSING INSTRUCTIONS
 ADVANCED INQUIRIES IN ALBEDO: PART 2 EXCEL DATA PROCESSING INSTRUCTIONS Once you have downloaded a MODIS subset, there are a few steps you must take before you begin analyzing the data. Directions for
Getting Started Guide
 Getting Started Guide Sage MAS Intelligence 90/200 Table of Contents Getting Started Guide... 1 Login Properties... 1 Standard Reports Available... 2 Financial Report... 2 Financial Trend Analysis... 3
Reviewing Hidden Content during Native Review
 Reviewing Hidden Content during Native Review Introduction When conducting a native file review it is important to note that certain files can have hidden content. These are features of certain software
EXCEL INTERMEDIATE 2016
 EXCEL INTERMEDIATE 2016 Alexandria Technical and Community College Customized Training Technology Specialist 1601 Jefferson Street, Alexandria, MN 56308 320-762-4539 Linda Muchow lindac@alextech.edu 1
Office of Instructional Technology
 Office of Instructional Technology Microsoft Excel 2016 Contact Information: 718-254-8565 ITEC@citytech.cuny.edu Contents Introduction to Excel 2016... 3 Opening Excel 2016... 3 Office 2016 Ribbon... 3
Microsoft Excel 2013/2016 Pivot Tables
 Microsoft Excel 2013/2016 Pivot Tables Creating PivotTables PivotTables are powerful data analysis tools. They let you summarize data in various ways and instantly change the view you use. A PivotTable
Contents. Group 2 Excel Handouts 2010
 Contents Styles... 2 Conditional Formatting... 2 Create a New Rule... 4 Format as Table... 5 Create your own New Table Style... 8 Cell Styles... 9 New Cell Style... 10 Merge Styles... 10 Sparklines...
Introduction to Excel 2013 Part 2
 Introduction to Excel 2013 Part 2 Open a file Select File from the Menu bar, select Open from the drop down menu, navigate to the place where the file was stored, double-left click on the file name. Modify
Explore commands on the ribbon Each ribbon tab has groups, and each group has a set of related commands.
 Quick Start Guide Microsoft Excel 2013 looks different from previous versions, so we created this guide to help you minimize the learning curve. Add commands to the Quick Access Toolbar Keep favorite commands
Tutorial 6: Managing Multiple Worksheets and Workbooks. Microsoft Excel 2013 Enhanced
 Tutorial 6: Managing Multiple Worksheets and Workbooks Microsoft Excel 2013 Enhanced 2 Objectives Create a worksheet group Format and edit multiple worksheets at once Create cell references to other worksheets
Open Excel by following the directions listed below: Click on Start, select Programs, and the click on Microsoft Excel.
 Candy is Dandy Grading Rubric You have been hired to conduct some market research about M&M's. First, you had your team purchase 4 large bags and the results are given for the contents of those bags. You
Create a Relationship to build a Pivot Table
 Create a Relationship to build a Pivot Table In Excel 2013 and 2016/365 you can now create a relationship between tables of data. This is a feature that can be used to pull data from the different tables
Excel 101. DJ Wetzel Director of Financial Aid Greenville Technical College
 Excel 101 DJ Wetzel Director of Financial Aid Greenville Technical College Introduction Spreadsheets are made up of : Columns identified with alphabetic headings Rows - identified with numeric headings.
Introduction to the workbook environment
 L E S S O N 7 Introduction to the workbook environment Lesson objectives Suggested teaching time To begin using the three-dimensional aspect of the Excel workbook, you will: 60-70 minutes a b c d Work
Working with Basic Functions. Basic Functions. Excel 2010 Working with Basic Functions. The Parts of a Function. Page 1
 Excel 2010 Working with Basic Functions Working with Basic Functions Page 1 Figuring out formulas for calculations you want to make in Excel can be tedious and complicated. Fortunately, Excel has an entire
Microsoft Excel > Shortcut Keys > Shortcuts
 Microsoft Excel > Shortcut Keys > Shortcuts Function Keys F1 Displays the Office Assistant or (Help > Microsoft Excel Help) F2 Edits the active cell, putting the cursor at the end* F3 Displays the (Insert
Lesson 4: Auditing and Additional Formulas. Return to the FastCourse Excel 2007 Level 3 book page
 Lesson 4: Auditing and Additional Formulas Return to the FastCourse Excel 2007 Level 3 book page Lesson Objectives After studying this lesson, you will be able to: Use 3-D cell references in formulas to
Pivot Table Project. Objectives. By the end of this lesson, you will be able to:
 Pivot Table Project Objectives By the end of this lesson, you will be able to: Set up a Worksheet Enter Labels and Values Use Sum and IF functions Format and align cells Change column width Use AutoFill
Creating a Spreadsheet by Using Excel
 The Excel window...40 Viewing worksheets...41 Entering data...41 Change the cell data format...42 Select cells...42 Move or copy cells...43 Delete or clear cells...43 Enter a series...44 Find or replace
Objective: Class Activities
 Objective: A Pivot Table is way to present information in a report format. The idea is that you can click drop down lists and change the data that is being displayed. Students will learn how to group data
Sage Financial Reporter User's Guide. May 2017
 Sage 300 2018 Financial Reporter User's Guide May 2017 This is a publication of Sage Software, Inc. 2017 The Sage Group plc or its licensors. All rights reserved. Sage, Sage logos, and Sage product and
Computer Applications Data Processing FA 14
 Lesson 7: Combining Multiple Data Sources Microsoft Excel 2016 IN THIS CHAPTER, YOU WILL LEARN HOW TO: Use workbooks as templates for other workbooks. Link to data in other worksheets and workbooks. Consolidate
Read More: Keyboard Shortcuts for Moving around Excel Spreadsheets
 You will do all your works in a workbook file. You can add as many worksheets as you need in a workbook file. Each worksheet appears in its own window. By default, Excel workbooks use a.xlsx file extension.
Excel Format cells Number Percentage (.20 not 20) Special (Zip, Phone) Font
 Special (Zip, Phone) Font") Excel 2013 Shortcuts My favorites: Ctrl+C copy (C=Copy) Ctrl+X cut (x is the shape of scissors) Ctrl+V paste (v is the shape of the tip of a glue bottle) Ctrl+A - or the corner of worksheet Ctrl+Home Goes
Excel 2013 Shortcuts My favorites: Ctrl+C copy (C=Copy) Ctrl+X cut (x is the shape of scissors) Ctrl+V paste (v is the shape of the tip of a glue bottle) Ctrl+A - or the corner of worksheet Ctrl+Home Goes
Excel Select a template category in the Office.com Templates section. 5. Click the Download button.
 Microsoft QUICK Excel 2010 Source Getting Started The Excel Window u v w z Creating a New Blank Workbook 2. Select New in the left pane. 3. Select the Blank workbook template in the Available Templates
Group Administrator. ebills csv file formatting by class level. User Guide
 Group Administrator ebills csv file formatting by class level User Guide Version 1.0 February 10, 2015 Table of Content Excel automated template... 3 Enable Macro setting in Microsoft Excel... 3 Extracting
EVALUATION COPY. Unauthorized Reproduction or Distribution Prohibited
 INTRODUCTION TO MICROSOFT EXCEL 2016 Introduction to Microsoft Excel 2016 (EXC2016.1 version 1.0.1) Copyright Information Copyright 2016 Webucator. All rights reserved. The Authors Dave Dunn Dave Dunn
Contents. Group 3 Excel Handouts 2010
 Contents Function Library... 2 Function Operators... 2 Order of Multiple Operators... 2 Function Library... 3 Formula Auditing... 4 Name Cells... 7 Comments... 8 Show Ink... 9 Show Ink is a colorful way
Create a Relationship to build a Pivot Table
 Create a Relationship to build a Pivot Table In Excel 2013 and 2016/365 you can now create a relationship between tables of data. This is a feature that can be used to pull data from the different tables
Table of contents. 01 Adding a parameters sheet to the Report Designer How to perform a check test on a database 8
 Table of contents 01 Adding a parameters sheet to the Report Designer 3 02 How to perform a check test on a database 8 03 How to automate the calculation of your data 10 04 How to schedule your reports
Les s on Objectives. Student Files Us ed
 Lesson 3 - Data Lists 23 Lesson 3 Data L ists Les s on Topics Data Lists Using the Data Form Sorting and Filtering the Data List The Total Row Les s on Objectives At the end of the lesson, you will be
New Perspectives on Microsoft Excel Module 5: Working with Excel Tables, PivotTables, and PivotCharts
 New Perspectives on Microsoft Excel 2016 Module 5: Working with Excel Tables, PivotTables, and PivotCharts Objectives, Part 1 Explore a structured range of data Freeze rows and columns Plan and create
How to Create and Use a Pivot Table in Excel
 How to Create and Use a Pivot Table in Excel Nikki Casasanto What you need Microsoft Office: Excel 2013 Data Why use a Pivot Table? Microsoft Excel pivot tables offer a way to quickly summarize data. It