Tools and techniques for optimization and debugging. Fabio Affinito October 2015
|
|
|
- Roger McCoy
- 5 years ago
- Views:
Transcription
1 Tools and techniques for optimization and debugging Fabio Affinito October 2015
2 Profiling
3 Why? Parallel or serial codes are usually quite complex and it is difficult to understand what is the most time consuming part. Profiling is a prerequisite to optimization. You don t want to spend time to optimize a function where usually your application spends % of the runtime!
4 Which? There are a lot of different tools. Some of them are suitable for serial applications (they identify the most compute-intensive parts), some other for parallel computations (they identify conflicts, parallel bottlenecks, load unbalance, etc.). There are free and proprietary tools. You can choice which to use depending on their availability (usually computer facilities offer licenses for many proprietary tools).
5 Time Time is a CL tool available on every Linux/UNIX platform; It provides time of execution and some other useful information; It is extremely simple, but it can provide as well some insight on your system exploitation.
6 Time time./a.out 9.29user 6.19system 0:15.52elapsed 99%CPU (0avgtext+0avgdata maxresident)k 0inputs+0outputs (0major+78809minor)pagefaults 0swaps User time: time spent by the CPU for the execution of the code System time: time spent by the CPU for system calls Elapsed time: time actually spent for the execution of your code The percentuage of CPU used by the process. Number of page faults Number of swaps
7 Time time./a.out 9.29user 6.19system 0:15.52elapsed 99%CPU (0avgtext+0avgdata maxresident)k 0inputs+0outputs (0major+78809minor)pagefaults 0swaps Looking at this example we can notice: -User time is close to the system time -CPU is used 99% -There s no I/O -No page faults is the total data area used (actually this is buggy, should 1/4) -System time + CPU time = Elapsed time
8 Time time./a.out 9.29user 6.19system 0:15.52elapsed 99%CPU (0avgtext+0avgdata maxresident)k 0inputs+0outputs (0major+78809minor)pagefaults 0swaps We rerun the same code, but reducing the number of alloc/dealloc operations (that require the execution of syscalls) time./a.out 2.28user 0.38system 0:02.67elapsed 99%CPU (0avgtext+0avgdata maxresident)k 0inputs+0outputs (0major+3153minor)pagefaults 0swaps
9 Time If our application is multi-thread (i.e. parallel), we would expect that the CPU time will be a multiple of the elapsed time. time./a.out user system 20:55.80elapsed 1185%CPU (0avgtext+0avgdata maxresident)k 19608inputs outputs (147major minor)pagefaults 0swaps

10 Top top provides a dynamic monitoring of every process running on a given machine (or node);
11 gprof gprof is an open source profiler provided by the GNU toolchain The analysis provided by gprof is more deep with respect to the time command: - it is at the function/subroutine grain level - it has a very low impact on the real performances - it provides information about the graph of dependencies inside our code
12 gprof gprof makes use of both sampling and instrumentation sampling = it checks in fixed intervals the time execution and advancement of the code instrumentation = it adds instructions to the original code, in order to track the execution of such parts of code
13 gprof To use gprof, you need to compile the program with the pg flag Then you run your code normally and at the end you check the measures with gcc mycode.c pg o myexe./myexe gprof myexe
14 gprof If the execution ends without problem a gmon.out file is generated (and eventually overwritten).
 { int i=0,g=0; while(i++<100000){ g+=i; } return g; } int b(void) { int i=0,g=0; while(i++<400000){ g+=i; }return g; } int main(int argc, char** argv){ int iterations; if (argc!")
15 Flat profile gprof can produce a flat profile. Let s see a simple example starting from a code: We would expect that the function b is 4 times more long than function a #include <stdio.h> int a(void) { int i=0,g=0; while(i++<100000){ g+=i; } return g; } int b(void) { int i=0,g=0; while(i++<400000){ g+=i; }return g; } int main(int argc, char** argv){ int iterations; if (argc!= 2){ printf("usage %s <No of Iterations>\n", argv[0]); exit(-1); } else iterations = atoi(argv[1]); printf("no of iterations = %d\n", iterations); while(iterations--){ a(); b(); } }
k 0inputs+0outputs (0major+131minor)pagefaults 0swaps gcc -O Main\ example.c -o Main\ example_gprof.")
![exe -pg [lanucara@louis ~]$ /usr/bin/time./main\ example_gprof.exe 10000 No of iterations = 10000 3.33user 0.00system 0:03.](/docs-images/89/98619345/images/16-2.jpg "34elapsed 99%CPU (0avgtext+0avgdata 2064maxresident)k 0inputs+8outputs (0major+150minor)pagefaults 0swaps gprof./main\ example_gprof.exe > Main\ example.")
16 Flat profile /usr/bin/time./main\ example.exe No of iterations = user 0.00system 0:03.23elapsed 99%CPU (0avgtext+0avgdata 1760maxresident)k 0inputs+0outputs (0major+131minor)pagefaults 0swaps gcc -O Main\ example.c -o Main\ example_gprof.exe -pg [lanucara@louis ~]$ /usr/bin/time./main\ example_gprof.exe No of iterations = user 0.00system 0:03.34elapsed 99%CPU (0avgtext+0avgdata 2064maxresident)k 0inputs+8outputs (0major+150minor)pagefaults 0swaps gprof./main\ example_gprof.exe > Main\ example.gprof Flat profile: Each sample counts as 0.01 seconds. % cumulative self self total time seconds seconds calls us/call us/call name b a
 - number of function calls - average time for every function call (us) - average time cumulative per function")

17 Flat profile - time in % - cumulative time spent by function and ancestors (in sec) - time spent by the function (in sec) - number of function calls - average time for every function call (us) - average time cumulative per function call and children functions - function name Flat profile: Each sample counts as 0.01 seconds. % cumulative self self total time seconds seconds calls us/call us/call name b a
 { { } return d; } int b(void) { int i=0,g=0; while(i++<400000){ g+=cinsideb(i); }return g;")
18 Flat profile We want to introduce a new function: and we put it inside b() int cinsideb(int d) { { } return d; } int b(void) { int i=0,g=0; while(i++<400000){ g+=cinsideb(i); }return g; }

19 Flat profile Let s check the new flat profile Flat profile: Each sample counts as 0.01 seconds. % cumulative self self total time seconds seconds calls us/call us/call name b cinsideb a
20 Tree profile In addition to the flat profile, the tree profile provides information about the relation caller/callee.

21 Tree profile
22 gprof: limitations - gprof sometimes doesn t provide data about library functions (cfr. MKL, etc.) - gprof has a quite coarse granularity: it doesn t dig into a function (that in some cases can be also very large..) - sometimes the overhead due to gprof can be very relevant (always compare execution times with and without gprof) - measured times comparable to the sampling time are not reliable
23 Temporize Sometimes, it can be necessary to manually insert code in our application in order to measure what is the time really spent by a given function. There are a lot of ad-hoc functions or language primitives. For example: - etime(), dtime() for Fortran77 - cputime(), system_clock(), date_and_time() for Fortran90 - clock() for C/C++ - etc
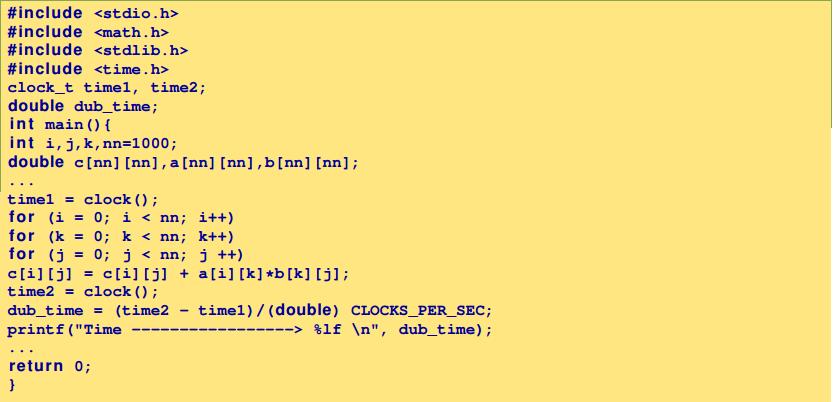
24 Temporize
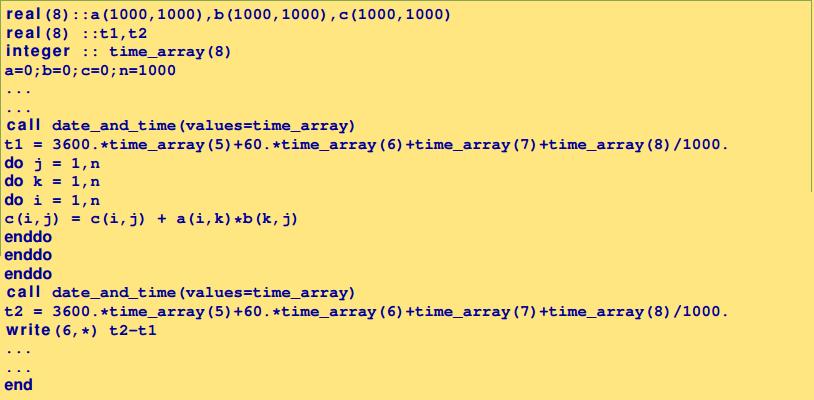
25 Temporize
26 PAPI PAPI = Performance Application Programming Interface is a set of function (APIs) designed in order to profile a code at a very fine level. One of the aim of the PAPI is the portability, i.e. the possibilty of being ran on most actual architectures (x86, GPUs, Intel MIC, etc.) PAPI can access the hardware counters: special-purpose registers that provide informations about the CPU behavior
27 PAPI PAPI provides 2 levels of interface: - High level interface: a library that provides informations about a given set of events (PAPI Preset Events) - Low level interface: it provides information more specific about the hardware. It is much more complex and difficult to use.
28 PAPI events Most interesting events (among the PAPI Preset Events) are: - PAPI_TOT_CYC: total number of CPU cycles - PAPI_TOT_INS: number of completed instructions - PAPI_FP_INS: number of floating point instructions - PAPI_L1_DCA: accesses in L1 cache - PAPI_L1_DCM: cache misses in L1 - PAPI_SR_INS: number of store instructions - PAPI_TLB_DM: TLB misses - PAPI_BR_MSP: conditional branches mispredicted

29 PAPI example
30 PAPI high level functions PAPI also provides a set of useful high level functions: - PAPI_num_counters : number of available hw counters - PAPI_flips : floating point instruction rate - PAPI_flops : floating point operation rate - PAPI_ipc : instructions per cycle - PAPI_read_counters : read and reset the counters - PAPI_start_counters : start counting hw events - PAPI_stop_counters : stop counters and return the count
31 SCALASCA gprof and PAPI provide information about the serial performance of a given application. We can use also gprof in order to profile a parallel application, but the results are often very difficult to understand. SCALASCA is a tool developed by F. Wolf and coworkers in the JSC and it is a good tool to check the scalability and efficiency of parallel software, also when going on a large scale. Open source and available at
32 SCALASCA It provides 2 different analysis: - Summary provides a fine level profiling but in an aggregate way - Tracing is a profiling more local to a process. It provides much more information but it can be expensive in terms of storage
33 SCALASCA Profiling with SCALASCA needs 3 steps: 1) compilation and instrumentation of the code scalasca instrument mpiifort openmp mycode.f90 o myapp.x 1) execution scalasca analyze mpirun np 1024./myapp.x 2) analysis scalasca examine epik_xxxxx
34 SCALASCA Profiling with SCALASCA needs 3 steps: 1) compilation and instrumentation of the code skin instrument mpiifort openmp mycode.f90 o myapp.x 1) execution scan analyze mpirun np 1024./myapp.x 2) analysis square examine epik_xxxxx

35 SCALASCA - Cube

36 SCALASCA - Cube

37 SCALASCA - Cube

38 SCALASCA - Cube

39 SCALASCA - Cube

40 SCALASCA - Cube Summary mode Tracing mode
41 Conclusions - Profiling is a necessary preliminar steps before the optimization - Optimize the serial code before - One single tool is not enough - One single data set is not enough - Consider the overhead induced by the profiler - Use tools made available from your HPC centre
Profilers and performance evaluation. Tools and techniques for performance analysis Andrew Emerson
 Profilers and performance evaluation Tools and techniques for performance analysis Andrew Emerson 10/06/2016 Tools and Profilers, Summer School 2016 1 Contents Motivations Manual Methods Measuring execution
HPC Lab. Session 4: Profiler. Sebastian Rettenberger, Chaulio Ferreira, Michael Bader. November 9, 2015
 HPC Lab Session 4: Profiler Sebastian Rettenberger, Chaulio Ferreira, Michael Bader November 9, 2015 Session 4: Profiler, November 9, 2015 1 Profiler Profiling allows you to learn where your program spent
Profiling and Debugging Tools. Lars Koesterke University of Porto, Portugal May 28-29, 2009
 Profiling and Debugging Tools Lars Koesterke University of Porto, Portugal May 28-29, 2009 Outline General (Analysis Tools) Listings & Reports Timers Profilers (gprof, tprof, Tau) Hardware performance
Computer Organization: A Programmer's Perspective
 Profiling Oren Kapah orenkapah.ac@gmail.com Profiling: Performance Analysis Performance Analysis ( Profiling ) Understanding the run-time behavior of programs What parts are executed, when, for how long
SCIENTIFIC COMPUTING FOR ENGINEERS
 4/26/16 CS 594: SCIENTIFIC COMPUTING FOR ENGINEERS PAPI Performance Application Programming Interface Heike Jagode jagode@icl.utk.edu OUTLINE 1. Motivation What is Performance? Why being annoyed with Performance
Introduction to Parallel Performance Engineering
 Introduction to Parallel Performance Engineering Markus Geimer, Brian Wylie Jülich Supercomputing Centre (with content used with permission from tutorials by Bernd Mohr/JSC and Luiz DeRose/Cray) Performance:
Dresden, September Dan Terpstra Jack Dongarra Shirley Moore. Heike Jagode
 Collecting Performance Data with PAPI-C 3rd Parallel Tools Workshop 3rd Parallel Tools Workshop Dresden, September 14-15 Dan Terpstra Jack Dongarra Shirley Moore Haihang You Heike Jagode Hardware performance
Prof. Thomas Sterling
 High Performance Computing: Concepts, Methods & Means Performance Measurement 1 Prof. Thomas Sterling Department of Computer Science Louisiana i State t University it February 13 th, 2007 News Alert! Intel
PAPI - PERFORMANCE API. ANDRÉ PEREIRA
 PAPI - PERFORMANCE API ANDRÉ PEREIRA ampereira@di.uminho.pt 1 Motivation 2 Motivation Application and functions execution time is easy to measure time gprof valgrind (callgrind) 2 Motivation Application
PAPI - PERFORMANCE API. ANDRÉ PEREIRA
 PAPI - PERFORMANCE API ANDRÉ PEREIRA ampereira@di.uminho.pt 1 Motivation Application and functions execution time is easy to measure time gprof valgrind (callgrind) It is enough to identify bottlenecks,
Performance analysis basics
 Performance analysis basics Christian Iwainsky Iwainsky@rz.rwth-aachen.de 25.3.2010 1 Overview 1. Motivation 2. Performance analysis basics 3. Measurement Techniques 2 Why bother with performance analysis
COMP4510 Introduction to Parallel Computation. Shared Memory and OpenMP. Outline (cont d) Shared Memory and OpenMP
 Shared Memory and OpenMP") COMP4510 Introduction to Parallel Computation Shared Memory and OpenMP Thanks to Jon Aronsson (UofM HPC consultant) for some of the material in these notes. Outline (cont d) Shared Memory and OpenMP Including
COMP4510 Introduction to Parallel Computation Shared Memory and OpenMP Thanks to Jon Aronsson (UofM HPC consultant) for some of the material in these notes. Outline (cont d) Shared Memory and OpenMP Including
Profiling and Debugging Tools. Outline
 Profiling and Debugging Tools Karl W. Schulz Texas Advanced Computing Center The University of Texas at Austin UT/Portugal Summer Institute Training Coimbra, Portugal July 17, 2008 Outline General (Analysis
ARCHER Single Node Optimisation
 ARCHER Single Node Optimisation Profiling Slides contributed by Cray and EPCC What is profiling? Analysing your code to find out the proportion of execution time spent in different routines. Essential
Parallel Processing Top manufacturer of multiprocessing video & imaging solutions.
 1 of 10 3/3/2005 10:51 AM Linux Magazine March 2004 C++ Parallel Increase application performance without changing your source code. Parallel Processing Top manufacturer of multiprocessing video & imaging
Performance Profiling
 Performance Profiling Minsoo Ryu Real-Time Computing and Communications Lab. Hanyang University msryu@hanyang.ac.kr Outline History Understanding Profiling Understanding Performance Understanding Performance
Tau Introduction. Lars Koesterke (& Kent Milfeld, Sameer Shende) Cornell University Ithaca, NY. March 13, 2009
 Cornell University Ithaca, NY. March 13, 2009") Tau Introduction Lars Koesterke (& Kent Milfeld, Sameer Shende) Cornell University Ithaca, NY March 13, 2009 General Outline Measurements Instrumentation & Control Example: matmult Profiling and Tracing
Tau Introduction Lars Koesterke (& Kent Milfeld, Sameer Shende) Cornell University Ithaca, NY March 13, 2009 General Outline Measurements Instrumentation & Control Example: matmult Profiling and Tracing
MPI Performance Tools
 Physics 244 31 May 2012 Outline 1 Introduction 2 Timing functions: MPI Wtime,etime,gettimeofday 3 Profiling tools time: gprof,tau hardware counters: PAPI,PerfSuite,TAU MPI communication: IPM,TAU 4 MPI
SHARCNET Workshop on Parallel Computing. Hugh Merz Laurentian University May 2008
 SHARCNET Workshop on Parallel Computing Hugh Merz Laurentian University May 2008 What is Parallel Computing? A computational method that utilizes multiple processing elements to solve a problem in tandem
Introduction to Performance Engineering
 Introduction to Performance Engineering Markus Geimer Jülich Supercomputing Centre (with content used with permission from tutorials by Bernd Mohr/JSC and Luiz DeRose/Cray) Performance: an old problem
Performance Analysis of Parallel Scientific Applications In Eclipse
 Performance Analysis of Parallel Scientific Applications In Eclipse EclipseCon 2015 Wyatt Spear, University of Oregon wspear@cs.uoregon.edu Supercomputing Big systems solving big problems Performance gains
Shared Memory programming paradigm: openmp
 IPM School of Physics Workshop on High Performance Computing - HPC08 Shared Memory programming paradigm: openmp Luca Heltai Stefano Cozzini SISSA - Democritos/INFM
Profiling & Optimization
 Lecture 18 Sources of Game Performance Issues? 2 Avoid Premature Optimization Novice developers rely on ad hoc optimization Make private data public Force function inlining Decrease code modularity removes
Profiling and Parallelizing with the OpenACC Toolkit OpenACC Course: Lecture 2 October 15, 2015
 Profiling and Parallelizing with the OpenACC Toolkit OpenACC Course: Lecture 2 October 15, 2015 Oct 1: Introduction to OpenACC Oct 6: Office Hours Oct 15: Profiling and Parallelizing with the OpenACC Toolkit
PAPI Performance Application Programming Interface (adapted by Fengguang Song)
") 1/17/18 PAPI Performance Application Programming Interface (adapted by Fengguang Song) Heike McCraw mccraw@icl.utk.edu To get more details, please read the manual: http://icl.cs.utk.edu/projects/papi/wiki/papi3:
1/17/18 PAPI Performance Application Programming Interface (adapted by Fengguang Song) Heike McCraw mccraw@icl.utk.edu To get more details, please read the manual: http://icl.cs.utk.edu/projects/papi/wiki/papi3:
Portable Power/Performance Benchmarking and Analysis with WattProf
 Portable Power/Performance Benchmarking and Analysis with WattProf Amir Farzad, Boyana Norris University of Oregon Mohammad Rashti RNET Technologies, Inc. Motivation Energy efficiency is becoming increasingly
Parallelization Primer. by Christian Bienia March 05, 2007
 Parallelization Primer by Christian Bienia March 05, 2007 What is Parallelization? Answer: The creation of a new algorithm! Trivial case: Run sequential algorithm on multiple CPUs, throw locks around shared
Martin Kruliš, v
 Martin Kruliš 1 Optimizations in General Code And Compilation Memory Considerations Parallelism Profiling And Optimization Examples 2 Premature optimization is the root of all evil. -- D. Knuth Our goal
Debugging and Profiling
 Debugging and Profiling Dr. Axel Kohlmeyer Senior Scientific Computing Expert Information and Telecommunication Section The Abdus Salam International Centre for Theoretical Physics http://sites.google.com/site/akohlmey/
Introduction to Performance Tuning & Optimization Tools
 Introduction to Performance Tuning & Optimization Tools a[i] a[i+1] + a[i+2] a[i+3] b[i] b[i+1] b[i+2] b[i+3] = a[i]+b[i] a[i+1]+b[i+1] a[i+2]+b[i+2] a[i+3]+b[i+3] Ian A. Cosden, Ph.D. Manager, HPC Software
Debugging, Profiling and Optimising Scientific Codes. Wadud Miah Research Computing Group
 Debugging, Profiling and Optimising Scientific Codes Wadud Miah Research Computing Group Scientific Code Performance Lifecycle Debugging Scientific Codes Software Bugs A bug in a program is an unwanted
Intel VTune Amplifier XE
 Intel VTune Amplifier XE Vladimir Tsymbal Performance, Analysis and Threading Lab 1 Agenda Intel VTune Amplifier XE Overview Features Data collectors Analysis types Key Concepts Collecting performance
Performance analysis : Hands-on
 Performance analysis : Hands-on time Wall/CPU parallel context gprof flat profile/call graph self/inclusive MPI context VTune hotspots, per line profile advanced metrics : general exploration, parallel
Performance measurements of computer systems: tools and analysis
 Performance measurements of computer systems: tools and analysis M2R PDES Jean-Marc Vincent and Arnaud Legrand Laboratory LIG MESCAL Project Universities of Grenoble {Jean-Marc.Vincent,Arnaud.Legrand}@imag.fr
Profiling with TAU. Le Yan. User Services LSU 2/15/2012
 Profiling with TAU Le Yan User Services HPC @ LSU Feb 13-16, 2012 1 Three Steps of Code Development Debugging Make sure the code runs and yields correct results Profiling Analyze the code to identify performance
IBM High Performance Computing Toolkit
 IBM High Performance Computing Toolkit Pidad D'Souza (pidsouza@in.ibm.com) IBM, India Software Labs Top 500 : Application areas (November 2011) Systems Performance Source : http://www.top500.org/charts/list/34/apparea
Evaluating Performance Via Profiling
 Performance Engineering of Software Systems September 21, 2010 Massachusetts Institute of Technology 6.172 Professors Saman Amarasinghe and Charles E. Leiserson Handout 6 Profiling Project 2-1 Evaluating
Distributed and Parallel Technology
 Distributed and Parallel Technology Parallel Performance Tuning Hans-Wolfgang Loidl http://www.macs.hw.ac.uk/~hwloidl School of Mathematical and Computer Sciences Heriot-Watt University, Edinburgh 0 No
Performance Analysis and Debugging Tools
 Performance Analysis and Debugging Tools Performance analysis and debugging intimately connected since they both involve monitoring of the software execution. Just different goals: Debugging -- achieve
Tutorial: Analyzing MPI Applications. Intel Trace Analyzer and Collector Intel VTune Amplifier XE
 Tutorial: Analyzing MPI Applications Intel Trace Analyzer and Collector Intel VTune Amplifier XE Contents Legal Information... 3 1. Overview... 4 1.1. Prerequisites... 5 1.1.1. Required Software... 5 1.1.2.
ECE 574 Cluster Computing Lecture 10
 ECE 574 Cluster Computing Lecture 10 Vince Weaver http://www.eece.maine.edu/~vweaver vincent.weaver@maine.edu 1 October 2015 Announcements Homework #4 will be posted eventually 1 HW#4 Notes How granular
Performance Analysis. HPC Fall 2007 Prof. Robert van Engelen
 Performance Analysis HPC Fall 2007 Prof. Robert van Engelen Overview What to measure? Timers Benchmarking Profiling Finding hotspots Profile-guided compilation Messaging and network performance analysis
HiPERiSM Consulting, LLC.
 HiPERiSM Consulting, LLC. George Delic, Ph.D. HiPERiSM Consulting, LLC (919)484-9803 P.O. Box 569, Chapel Hill, NC 27514 george@hiperism.com http://www.hiperism.com Models-3 User s Conference September
Debugging and Profiling
 Debugging and Profiling Nate Woody 5/27/2009 www.cac.cornell.edu 1 Debugging Debugging is a methodical process of finding and reducing the number of bugs, or defects, in a computer program or a piece of
Scientific Programming in C XIV. Parallel programming
 Scientific Programming in C XIV. Parallel programming Susi Lehtola 11 December 2012 Introduction The development of microchips will soon reach the fundamental physical limits of operation quantum coherence
Parallel Code Optimisation
 April 8, 2008 Terms and terminology Identifying bottlenecks Optimising communications Optimising IO Optimising the core code Theoretical perfomance The theoretical floating point performance of a processor
Scalasca support for Intel Xeon Phi. Brian Wylie & Wolfgang Frings Jülich Supercomputing Centre Forschungszentrum Jülich, Germany
 Scalasca support for Intel Xeon Phi Brian Wylie & Wolfgang Frings Jülich Supercomputing Centre Forschungszentrum Jülich, Germany Overview Scalasca performance analysis toolset support for MPI & OpenMP
CS533 Modeling and Performance Evaluation of Network and Computer Systems
 CS533 Modeling and Performance Evaluation of Network and Computer Systems Monitors (Chapter 7) 1 Monitors That which is monitored improves. Source unknown A monitor is a tool used to observe system Observe
Performance measurements of computer systems: tools and analysis
 Performance measurements of computer systems: tools and analysis M2R PDES Jean-Marc Vincent and Arnaud Legrand Laboratory LIG MESCAL Project Universities of Grenoble {Jean-Marc.Vincent,Arnaud.Legrand}@imag.fr
Method-Level Phase Behavior in Java Workloads
 Method-Level Phase Behavior in Java Workloads Andy Georges, Dries Buytaert, Lieven Eeckhout and Koen De Bosschere Ghent University Presented by Bruno Dufour dufour@cs.rutgers.edu Rutgers University DCS
SCALASCA v1.0 Quick Reference
 General SCALASCA is an open-source toolset for scalable performance analysis of large-scale parallel applications. Use the scalasca command with appropriate action flags to instrument application object
MPI and OpenMP (Lecture 25, cs262a) Ion Stoica, UC Berkeley November 19, 2016
 Ion Stoica, UC Berkeley November 19, 2016") MPI and OpenMP (Lecture 25, cs262a) Ion Stoica, UC Berkeley November 19, 2016 Message passing vs. Shared memory Client Client Client Client send(msg) recv(msg) send(msg) recv(msg) MSG MSG MSG IPC Shared
MPI and OpenMP (Lecture 25, cs262a) Ion Stoica, UC Berkeley November 19, 2016 Message passing vs. Shared memory Client Client Client Client send(msg) recv(msg) send(msg) recv(msg) MSG MSG MSG IPC Shared
Profiling and debugging. Carlos Rosales September 18 th 2009 Texas Advanced Computing Center The University of Texas at Austin
 Profiling and debugging Carlos Rosales carlos@tacc.utexas.edu September 18 th 2009 Texas Advanced Computing Center The University of Texas at Austin Outline Debugging Profiling GDB DDT Basic use Attaching
CMSC 411 Computer Systems Architecture Lecture 13 Instruction Level Parallelism 6 (Limits to ILP & Threading)
") CMSC 411 Computer Systems Architecture Lecture 13 Instruction Level Parallelism 6 (Limits to ILP & Threading) Limits to ILP Conflicting studies of amount of ILP Benchmarks» vectorized Fortran FP vs. integer
CMSC 411 Computer Systems Architecture Lecture 13 Instruction Level Parallelism 6 (Limits to ILP & Threading) Limits to ILP Conflicting studies of amount of ILP Benchmarks» vectorized Fortran FP vs. integer
Performance Measuring on Blue Horizon and Sun HPC Systems:
 Performance Measuring on Blue Horizon and Sun HPC Systems: Timing, Profiling, and Reading Assembly Language NPACI Parallel Computing Institute 2000 Sean Peisert peisert@sdsc.edu Performance Programming
Module I: Measuring Program Performance
 Performance Programming: Theory, Practice and Case Studies Module I: Measuring Program Performance 9 Outline 10 Measuring methodology and guidelines Measurement tools Timing Tools Profiling Tools Process
30 Nov Dec Advanced School in High Performance and GRID Computing Concepts and Applications, ICTP, Trieste, Italy
 Advanced School in High Performance and GRID Computing Concepts and Applications, ICTP, Trieste, Italy Why serial is not enough Computing architectures Parallel paradigms Message Passing Interface How
Announcements. Homework 4 out today Dec 7 th is the last day you can turn in Lab 4 and HW4, so plan ahead.
 Announcements Homework 4 out today Dec 7 th is the last day you can turn in Lab 4 and HW4, so plan ahead. Thread level parallelism: Multi-Core Processors Two (or more) complete processors, fabricated on
Performance Evaluation
 Performance Evaluation Master 2 Research Tutorial: High-Performance Architectures Arnaud Legrand et Jean-François Méhaut ID laboratory, arnaud.legrand@imag.fr November 29, 2006 A. Legrand (CNRS-ID) INRIA-MESCAL
Advances in Programming Languages: Efficiency
 Advances in Programming Languages: Efficiency Stephen Gilmore The University of Edinburgh March 1, 2007 Overview Computer programs should execute efficiently. The art and skill of computer programming
THE PAPI PERFORMANCE ANALYSIS TOOL
 THE PAPI PERFORMANCE ANALYSIS TOOL Rui Silva 20 November 2012 Universidade do Minho OUTLINE Introduction to PAPI My experience with PAPI INTRODUCTION TO PAPI PAPI Access to hardware performance counters
PROJECT 2 - MEMORY ALLOCATOR Computer Systems Principles. October 1, 2010
 PROJECT 2 - MEMORY ALLOCATOR Computer Systems Principles Emery Berger Mark Corner October 1, 2010 1 Overview The purpose of this project is to acquaint you with how memory allocators provide virtual memory
Jackson Marusarz Intel Corporation
 Jackson Marusarz Intel Corporation Intel VTune Amplifier Quick Introduction Get the Data You Need Hotspot (Statistical call tree), Call counts (Statistical) Thread Profiling Concurrency and Lock & Waits
Profiling: Understand Your Application
 Profiling: Understand Your Application Michal Merta michal.merta@vsb.cz 1st of March 2018 Agenda Hardware events based sampling Some fundamental bottlenecks Overview of profiling tools perf tools Intel
Profiling & Optimization
 Lecture 11 Sources of Game Performance Issues? 2 Avoid Premature Optimization Novice developers rely on ad hoc optimization Make private data public Force function inlining Decrease code modularity removes
Performance Tools Hands-On. PATC Apr/2016.
 Performance Tools Hands-On PATC Apr/2016 tools@bsc.es Accounts Users: nct010xx Password: f.23s.nct.0xx XX = [ 01 60 ] 2 Extrae features Parallel programming models MPI, OpenMP, pthreads, OmpSs, CUDA, OpenCL,
Parallelism V. HPC Profiling. John Cavazos. Dept of Computer & Information Sciences University of Delaware
 Parallelism V HPC Profiling John Cavazos Dept of Computer & Information Sciences University of Delaware Lecture Overview Performance Counters Profiling PAPI TAU HPCToolkit PerfExpert Performance Counters
Performance Optimization: Simulation and Real Measurement
 Performance Optimization: Simulation and Real Measurement KDE Developer Conference, Introduction Agenda Performance Analysis Profiling Tools: Examples & Demo KCachegrind: Visualizing Results What s to
HPC with PGI and Scalasca
 HPC with PGI and Scalasca Stefan Rosenberger Supervisor: Univ.-Prof. Dipl.-Ing. Dr. Gundolf Haase Institut für Mathematik und wissenschaftliches Rechnen Universität Graz May 28, 2015 Stefan Rosenberger
CSE 141 Summer 2016 Homework 2
 CSE 141 Summer 2016 Homework 2 PID: Name: 1. A matrix multiplication program can spend 10% of its execution time in reading inputs from a disk, 10% of its execution time in parsing and creating arrays
Score-P A Joint Performance Measurement Run-Time Infrastructure for Periscope, Scalasca, TAU, and Vampir
 Score-P A Joint Performance Measurement Run-Time Infrastructure for Periscope, Scalasca, TAU, and Vampir VI-HPS Team Score-P: Specialized Measurements and Analyses Mastering build systems Hooking up the
Introduction to Parallel Programming
 Introduction to Parallel Programming Linda Woodard CAC 19 May 2010 Introduction to Parallel Computing on Ranger 5/18/2010 www.cac.cornell.edu 1 y What is Parallel Programming? Using more than one processor
VIRTUAL INSTITUTE HIGH PRODUCTIVITY SUPERCOMPUTING. BSC Tools Hands-On. Germán Llort, Judit Giménez. Barcelona Supercomputing Center
 BSC Tools Hands-On Germán Llort, Judit Giménez Barcelona Supercomputing Center 2 VIRTUAL INSTITUTE HIGH PRODUCTIVITY SUPERCOMPUTING Getting a trace with Extrae Extrae features Platforms Intel, Cray, BlueGene,
Parallel architectures are enforcing the need of managing parallel software efficiently Sw design, programming, compiling, optimizing, running
 S.Bartolini Department of Information Engineering University of Siena, Italy C.A. Prete Department of Information Engineering University of Pisa, Italy GREPS Workshop (PACT 07) Brasov, Romania. 16/09/2007
Revealing the performance aspects in your code
 Revealing the performance aspects in your code 1 Three corner stones of HPC The parallelism can be exploited at three levels: message passing, fork/join, SIMD Hyperthreading is not quite threading A popular
OpenACC Course. Office Hour #2 Q&A
 OpenACC Course Office Hour #2 Q&A Q1: How many threads does each GPU core have? A: GPU cores execute arithmetic instructions. Each core can execute one single precision floating point instruction per cycle
Profiling and Workflow
 Profiling and Workflow Preben N. Olsen University of Oslo and Simula Research Laboratory preben@simula.no September 13, 2013 1 / 34 Agenda 1 Introduction What? Why? How? 2 Profiling Tracing Performance
High Performance Computing and Programming. Performance Analysis
 High Performance Computing and Programming Performance Analysis What is performance? Performance is a total effectiveness of a program What are the measures of the performance? execution time FLOPS memory
A common scenario... Most of us have probably been here. Where did my performance go? It disappeared into overheads...
 OPENMP PERFORMANCE 2 A common scenario... So I wrote my OpenMP program, and I checked it gave the right answers, so I ran some timing tests, and the speedup was, well, a bit disappointing really. Now what?.
Reducing the SPEC2006 Benchmark Suite for Simulation Based Computer Architecture Research
 Reducing the SPEC2006 Benchmark Suite for Simulation Based Computer Architecture Research Joel Hestness jthestness@uwalumni.com Lenni Kuff lskuff@uwalumni.com Computer Science Department University of
Parallel Programming on Larrabee. Tim Foley Intel Corp
 Parallel Programming on Larrabee Tim Foley Intel Corp Motivation This morning we talked about abstractions A mental model for GPU architectures Parallel programming models Particular tools and APIs This
Overview. Timers. Profilers. HPM Toolkit
 Overview Timers Profilers HPM Toolkit 2 Timers Wide range of timers available on the HPCx system Varying precision portability language ease of use 3 Timers Timer Usage Wallclock/C PU Resolution Language
Optimized Scientific Computing:
 Optimized Scientific Computing: Coding Efficiently for Real Computing Architectures Noah Kurinsky SASS Talk, November 11 2015 Introduction Components of a CPU Architecture Design Choices Why Is This Relevant
COSC 6385 Computer Architecture - Project
 COSC 6385 Computer Architecture - Project Edgar Gabriel Spring 2018 Hardware performance counters set of special-purpose registers built into modern microprocessors to store the counts of hardwarerelated
Dynamic Binary Instrumentation: Introduction to Pin
 Dynamic Binary Instrumentation: Introduction to Pin Instrumentation A technique that injects instrumentation code into a binary to collect run-time information 2 Instrumentation A technique that injects
Parallel Performance Methods and Technologies
 Parallel Performance Methods and Technologies Parallel Computing CIS 410/510 Department of Computer and Information Science Parallel Performance and Complexity q To use a scalable parallel computer well,
Threaded Programming. Lecture 9: Alternatives to OpenMP
 Threaded Programming Lecture 9: Alternatives to OpenMP What s wrong with OpenMP? OpenMP is designed for programs where you want a fixed number of threads, and you always want the threads to be consuming
Performance analysis with Periscope
 Performance analysis with Periscope M. Gerndt, V. Petkov, Y. Oleynik, S. Benedict Technische Universität petkovve@in.tum.de March 2010 Outline Motivation Periscope (PSC) Periscope performance analysis
PRACE Autumn School Basic Programming Models
 PRACE Autumn School 2010 Basic Programming Models Basic Programming Models - Outline Introduction Key concepts Architectures Programming models Programming languages Compilers Operating system & libraries
ECE 695 Numerical Simulations Lecture 3: Practical Assessment of Code Performance. Prof. Peter Bermel January 13, 2017
 ECE 695 Numerical Simulations Lecture 3: Practical Assessment of Code Performance Prof. Peter Bermel January 13, 2017 Outline Time Scaling Examples General performance strategies Computer architectures
A configurable binary instrumenter
 Mitglied der Helmholtz-Gemeinschaft A configurable binary instrumenter making use of heuristics to select relevant instrumentation points 12. April 2010 Jan Mussler j.mussler@fz-juelich.de Presentation
CS420: Operating Systems
 Threads James Moscola Department of Physical Sciences York College of Pennsylvania Based on Operating System Concepts, 9th Edition by Silberschatz, Galvin, Gagne Threads A thread is a basic unit of processing
CS691/SC791: Parallel & Distributed Computing
 CS691/SC791: Parallel & Distributed Computing Introduction to OpenMP 1 Contents Introduction OpenMP Programming Model and Examples OpenMP programming examples Task parallelism. Explicit thread synchronization.
Parallel Programming Using MPI
 Parallel Programming Using MPI Prof. Hank Dietz KAOS Seminar, February 8, 2012 University of Kentucky Electrical & Computer Engineering Parallel Processing Process N pieces simultaneously, get up to a
CS4961 Parallel Programming. Lecture 10: Data Locality, cont. Writing/Debugging Parallel Code 09/23/2010
 Parallel Programming Lecture 10: Data Locality, cont. Writing/Debugging Parallel Code Mary Hall September 23, 2010 1 Observations from the Assignment Many of you are doing really well Some more are doing
IBM PSSC Montpellier Customer Center. Content
 Content Profiling GNU Profiler (Gprof) Vprof Communications Tracing MPI Trace Library Hardware Performance Monitors Universal Performance Counters (UPC) HPM Library IBM System Blue Gene/P Specifics Personality
[Scalasca] Tool Integrations
![[Scalasca] Tool Integrations](/thumbs/95/125562042.jpg "[Scalasca] Tool Integrations") Mitglied der Helmholtz-Gemeinschaft [Scalasca] Tool Integrations Aug 2011 Bernd Mohr CScADS Performance Tools Workshop Lake Tahoe Contents Current integration of various direct measurement tools Paraver
Mitglied der Helmholtz-Gemeinschaft [Scalasca] Tool Integrations Aug 2011 Bernd Mohr CScADS Performance Tools Workshop Lake Tahoe Contents Current integration of various direct measurement tools Paraver
GPUs and Emerging Architectures
 GPUs and Emerging Architectures Mike Giles mike.giles@maths.ox.ac.uk Mathematical Institute, Oxford University e-infrastructure South Consortium Oxford e-research Centre Emerging Architectures p. 1 CPUs
Intel VTune Amplifier XE. Dr. Michael Klemm Software and Services Group Developer Relations Division
 Intel VTune Amplifier XE Dr. Michael Klemm Software and Services Group Developer Relations Division Legal Disclaimer & Optimization Notice INFORMATION IN THIS DOCUMENT IS PROVIDED AS IS. NO LICENSE, EXPRESS
COMP Superscalar. COMPSs Tracing Manual
 COMP Superscalar COMPSs Tracing Manual Version: 2.4 November 9, 2018 This manual only provides information about the COMPSs tracing system. Specifically, it illustrates how to run COMPSs applications with