Profiling: Understand Your Application
|
|
|
- Bruno Simmons
- 5 years ago
- Views:
Transcription
1 Profiling: Understand Your Application Michal Merta 1st of March 2018
2 Agenda Hardware events based sampling Some fundamental bottlenecks Overview of profiling tools perf tools Intel VTune Amplifier XE Hands-on
3 Hardware events based sampling
4 Hardware events based sampling Profiling using Performance Monitoring Units (PMU) The data collector periodically interrupts the program and collects data from PMUs The average overhead of event-based sampling is about 2% on a 1ms sampling interval The number of hardware events (Performance Monitor Counters) collected simultaneously is limited by CPU capabilities (number of PMUs) Multiple runs or multiplexing
5 Some fundamental bottlenecks
6 Some fundamental bottlenecks Clockticks/Cycles Instructions retired - how many instructions were completely executed Cycles per Instruction (CPI) how many cycles on average a single instruction took to execute (the lower the better) Instruction per Cycle (IPC) - 1/CPI
7 Some fundamental bottlenecks Clockticks/Cycles Instructions retired - how many instructions were completely executed Cycles per Instruction (CPI) how many cycles on average a single instruction took to execute (the lower the better) Instruction per Cycle (IPC) - 1/CPI Attention! CPI/IPC metric treat instructions the same. SIMD instructions will be wrongly penalized. SIMD instructions need more cycles but compute more elements concurrently. Must consider total number of instructions retired and cycles when interpreting!
8 Some fundamental bottlenecks Clockticks/Cycles Instructions retired - how many instructions were completely executed Cycles per Instruction (CPI) how many cycles on average a single instruction took to execute (the lower the better) Instruction per Cycle (IPC) - 1/CPI Attention! CPI/IPC metric treat instructions the same. SIMD instructions will be wrongly penalized. SIMD instructions need more cycles but compute more elements concurrently. Must consider total number of instructions retired and cycles when interpreting!e.g.,

9 Pipeline slots Processor front-end vs. back-end Front-end fetching and decoding instructions into uops and forward to scheduler Back-end uops from scheduler are assigned to execution units for execution and memory changes are commited (Image: Intel)
10 Pipeline slots Modern CPUs are able to allocate n uops per cycle and retire n abstract concept of n pipeline slots Individual slots can be classified based on their state during allocation. The classification is used, e.g., in VTune: Usual values for HPC application: retiring 30-70%, bad speculation 1-5%, front-end bound 5-10%, back-end bound 20-40%.
11 Some fundamental bottlenecks Front-end bound Issues when processor front-end undersupplies back-end. ICache misses when fetched instructions are not present in L1I (instruction) cache ITLB overhead translation look-aside buffer stores recent translation of virtual to physical memory. This metric estimates the performance penalty of ITLB (instruction TLB) misses. Branch resteers fraction of cycles the CPU stalled due to fetching corrected path after branch misprediction Tip: use the Profiler Guided Optimization (PGO) to improve the metrics
12 Some fundamental bottlenecks Back-end bound Issues when processor back-end not ready to handle uops provided by front-end. Can be divided into two further categories: Memory bound - execution of instructions is stalled due to memory dependencies waiting to be resolved Core bound no more instructions can be executed since there is no free execution unit (so-called port) Most common causes include Cache misses Remote memory accesses Data sharing 4K-Aliasing DTLB misses Data dependencies between instructions
13 Some fundamental bottlenecks Back-end bound Cache misses Computations are performed on data in L1 cache The smallest unit of loading data from memory towards compute units is a cache line (64 bytes) Cache miss cache line not in a cache, needs to be loaded (opposite: cache hit) Pre-configured CPU metrics are ratio of cycles of a miss to overall clock cycles. Cache misses will always be present in reality only a too high rate is a problem
14 Some fundamental bottlenecks Back-end bound Remote memory access Any access to remote memory (of other socket via QPI) is slower compared to local memory An ideal NUMA-optimized application should entirely use local memory Pre-configured metric Remote DRAM counts cycles remote memory is accessed. Compared to overall clock cycles it should be very low.
15 Some fundamental bottlenecks Back-end bound Data sharing Data can be shared between cores (and sockets) as True sharing cores share the exact same data and at least one updates/writes. Requires synchronization with other cores. False sharing different data items on the same cache line are touched by different cores. Pre-computed metrics Contested Accesses or Data sharing counts cycles LLC needs for synchronization to overall clock cycles.
16 Some fundamental bottlenecks Back-end bound 4K-Aliasing Store-forwarding (using load/store buffers) Optimization avoiding pipeline stall when load from a memory location follows recently after a store to the location. Data are not written directly to the memory (cache) but stored in a store buffer. It can only anti-alias lower 12 bit of address (4096 bytes) If a load using an address whose lower 12 bit are the same of previous store, processor wrongly assumes data being in load/store buffer The real data needs to be loaded later (5+ cycles stall) Pre-computed metrics 4K-Aliasing counts cycles of stall due to the 4K-Aliasing.
17 Some fundamental bottlenecks Back-end bound DTLB misses TLBs are small buffers to help decode logical to physical addresses on a page granularity. If data in a page is accessed and the page s address is not in TLB address needs to be decoded penalty Worst case of random page accesses causes huge amount of TLB misses Pre-computed metrics DTLB Overhead counts cycles of stall caused by DTLB misses
18 Overview of available tools gprof, oprofile, Vampir, Scalasca, Valgrind, Intel Advisor, Score-P, PAPI, Likwid,... perf tools Linux performance analysis tool available from kernel version Intel VTune Amplifier XE powerful profiler provided as a part of Intel Parallel Studio or a stand-alone product Allinea MAP profiler for OpenMP, MPI applications analyzing instructions, memory usage, I/O, communication etc.
19 perf tools
20 perf tools Performance Counters for Linux (PCL) performance measurement tool integrated into Linux since 2009 statistical profiling of whole system supports hardware performance counters, software performance counters, tracepoints, dynamic probes
21 perf tools commands $ perf usage : perf [-- version ] [--help ] [ OPTIONS ] COMMAND [ARGS ] The most commonly used perf commands are : annotate Read perf.data ( created by perf record ) and display annotated code archive Create arch. with object files with build - ids found in perf. data f. bench General framework for benchmark suites buildid - cache Manage build -id cache. buildid - list List the buildids in a perf. data file data Data file related processing diff Read perf. data files and display the differential profile evlist List the event names in a perf. data file inject Filter to augment the events stream with additional information kmem Tool to trace / measure kernel memory properties kvm Tool to trace / measure kvm guest os list List all symbolic event types lock Analyze lock events mem Profile memory accesses record Run a command and record its profile into perf. data report Read perf.data ( created by perf record ) and display the profile sched Tool to trace / measure scheduler properties ( latencies ) script Read perf.data ( created by perf record ) and display trace output stat Run a command and gather performance counter statistics test Runs sanity tests. timechart Tool to visualize total system behavior during a workload top System profiling tool. probe Define new dynamic tracepoints trace strace inspired tool
22 perf tools events Category Description Example Hardware events Basic CPU events, measured by PMU of CPU Hardware cache Data- and instructioncache events hw. events. Software events Measurable by kernel counters + tracepoint, probe events + Raw hardware event descriptors branch- cpu-cycles, misses L1-dcache-loadmisses, LLC-storemisses cpu-clock, contextswitches for Intel see: Intel(R) 64 and IA-32 Architectures Software Developer s Manual
23 perf tools events to get a list of available events: perf list $ perf list List of pre - defined events (to be used in -e): branch - instructions OR branches [ Hardware event ] branch - misses [ Hardware event ] bus - cycles [ Hardware event ] cache - misses [ Hardware event ]... alignment - faults [ Software event ] context - switches OR cs [ Software event ] cpu - clock [ Software event ]... L1 -dcache -load - misses [ Hardware cache event ] L1 -dcache - loads [ Hardware cache event ] L1 -dcache - stores [ Hardware cache event ]... branch - instructions OR cpu /branch - instructions / [ Kernel PMU event ] branch - misses OR cpu /branch - misses / [ Kernel PMU event ] bus - cycles OR cpu /bus - cycles / [ Kernel PMU event ]... rnnn [ Raw hardware event descriptor ] ( see man perf -list on how to encode it)
24 Counting events with perf stat $ perf stat./ myprogram Performance counter stats for./ myprogram : task - clock (msec ) # CPUs utilized 4,591 context - switches # K/ sec 44 cpu - migrations # K/ sec 202,626 page - faults # M/ sec 116,275,734,384 cycles # GHz 167,335,603,761 instructions # 1.44 insns per cycle 14,612,431,103 branches # M/ sec 16,714,213 branch - misses # 0.11% of all branches seconds time elapsed Some important switches -e event selection e.g. perf stat -e cycles,cache-misses./myprogram -p/-t stat events on existing process/thread id e.g. perf stat -p I <n> prints counts at regular intervals in ms -r <n> repeats measurement n times, prints avg. and std.
25 Sampling with perf report Collect samples by perf record Stores in the perf.data file (can be analyzed on different machine) Analyze using perf report By default collects cycles counts $ perf record -e branch - misses./ myprogram $ perf report Samples : 20K of event branch -misses, Event count ( approx.): Overhead Command Shared Object Symbol 21.71% myprogram libmkl_avx2.so [.] mkl_blas_avx2_xzgemv 9.99% myprogram myprogram [.] computeelementmatrix 8.89% myprogram myprogram [.] apply 8.57% myprogram myprogram [.] collect 8.49% myprogram libc so [.] _int_malloc... -g will record a call graph
26 Sampling with perf report Perf annotate function maps recorded profile information to the actual functions and instructions in the code Pressing a on any symbol in perf report displays assembly instructions of the functions together with source code
27 Intel VTune Amplifier XE
28 Intel VTune Amplifier XE Powerful performance analysis tool providing in depth metrics about the profiled applications. Enables, e.g., finding hot spots in application, measure memory and QPI bandwidth, profile threading performance, etc.

29 Hot Spots Get started with identifying what is worth optimizing: Two analysis types: Basic Hotspots: Simple instrumentation not requiring any drivers or perf but just delivers execution times. Advanced Hotspots: Sampling with basic event counters 1 requires drivers or perf and delivers instruction information. Below is an example for Advanced Hotspots: 1 Allows system wide profiling (Image: Intel)


30 Concurrency/Locks and Waits Understand threading: Two analysis types: Concurrency: Provides information about how many threads are running at the same time. (Image: Intel) Locks and Waits: Identify concurrency bottlenecks where threads are blocked due to locks/synchronization. (Image: Intel) If non-standard synchronization constructs are used, consider User-Defined Synchronization API to make this information available (see here )

31 Memory/QPI Bandwidth Select analysis type Microarchitecture Analysis/Memory Access Tab Summary gives a first overview (incl. latency) See BW details under Platform tab:
32 General Exploration Use General Exploration Analysis for a comprehensive overview of available metrics
")
33 General Exploration Use General Exploration Analysis for a comprehensive overview of available metrics (Image: Intel)

: Intel R Processor Event Reference Used by predefined CPU metrics")
34 Which Performance Metrics can be collected? Depending on analysis type, Intel VTune Amplifier XE shows two types of performance metrics: 140 predefined CPU metrics: CPU Metrics Reference Those are pre-configured by using basic event counters and also highlighted in the GUI (e.g. red or grayed out). Raw event counters from the Performance Monitoring Unit (PMU): Intel R Processor Event Reference Used by predefined CPU metrics in more or less complex formulas. Those are highly dependent on the target architecture!
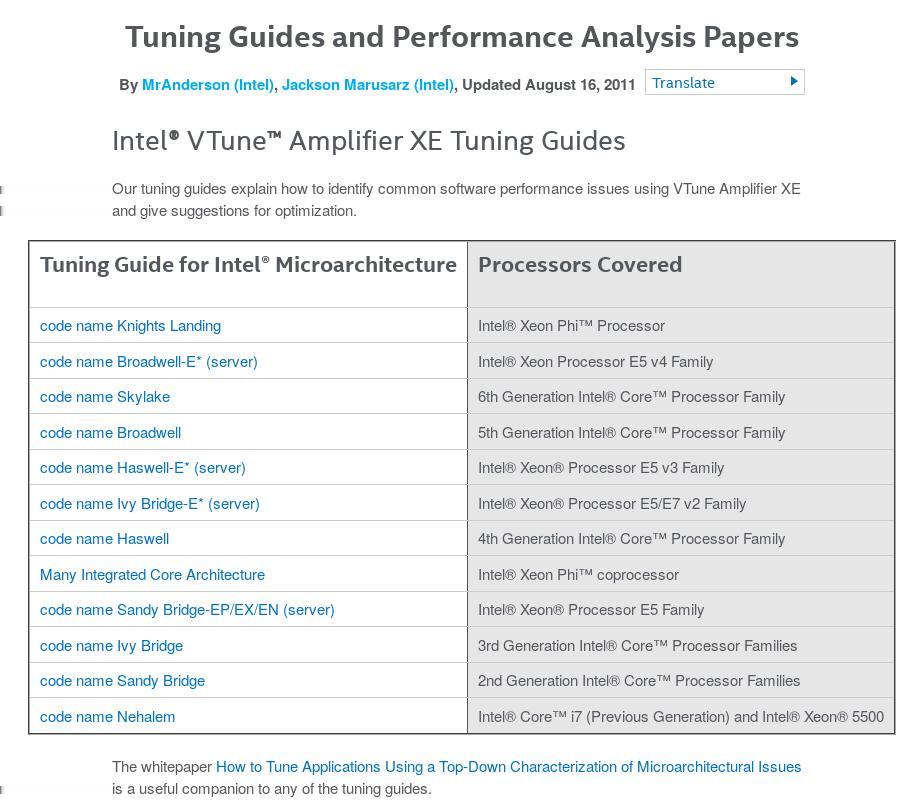
35 Tuning Guides and Performance Analysis Papers Tuning Guides and Performance Analysis Papers
36 Summary Hardware events based sampling with minimal overhead Issues can be either front-end or back-end bound Wide selection of profiling tools - free or paid - e.g., perf tools, Intel VTune Amplifier
37 Hands-on
Jackson Marusarz Intel Corporation
 Jackson Marusarz Intel Corporation Intel VTune Amplifier Quick Introduction Get the Data You Need Hotspot (Statistical call tree), Call counts (Statistical) Thread Profiling Concurrency and Lock & Waits
2
 1 2 3 4 5 6 For more information, see http://www.intel.com/content/www/us/en/processors/core/core-processorfamily.html 7 8 The logic for identifying issues on Intel Microarchitecture Codename Ivy Bridge
Intel VTune Amplifier XE
 Intel VTune Amplifier XE Vladimir Tsymbal Performance, Analysis and Threading Lab 1 Agenda Intel VTune Amplifier XE Overview Features Data collectors Analysis types Key Concepts Collecting performance
Performance analysis tools: Intel VTuneTM Amplifier and Advisor. Dr. Luigi Iapichino
 Performance analysis tools: Intel VTuneTM Amplifier and Advisor Dr. Luigi Iapichino luigi.iapichino@lrz.de Which tool do I use in my project? A roadmap to optimisation After having considered the MPI layer,
Intel profiling tools and roofline model. Dr. Luigi Iapichino
 Intel profiling tools and roofline model Dr. Luigi Iapichino luigi.iapichino@lrz.de Which tool do I use in my project? A roadmap to optimization (and to the next hour) We will focus on tools developed
KNL tools. Dr. Fabio Baruffa
 KNL tools Dr. Fabio Baruffa fabio.baruffa@lrz.de 2 Which tool do I use? A roadmap to optimization We will focus on tools developed by Intel, available to users of the LRZ systems. Again, we will skip the
PERF performance-counter for Odroid XU3/XU4
 2017/12/07 21:49 1/6 PERF performance-counter for Odroid XU3/XU4 PERF performance-counter for Odroid XU3/XU4 Linux hardware performance measurement using counters, trace-points, software performance counters,
Simplified and Effective Serial and Parallel Performance Optimization
 HPC Code Modernization Workshop at LRZ Simplified and Effective Serial and Parallel Performance Optimization Performance tuning Using Intel VTune Performance Profiler Performance Tuning Methodology Goal:
ECE 571 Advanced Microprocessor-Based Design Lecture 2
 ECE 571 Advanced Microprocessor-Based Design Lecture 2 Vince Weaver http://www.eece.maine.edu/~vweaver vincent.weaver@maine.edu 21 January 2016 Announcements HW#1 will be posted tomorrow I am handing out
Performance Tuning VTune Performance Analyzer
 Performance Tuning VTune Performance Analyzer Paul Petersen, Intel Sept 9, 2005 Copyright 2005 Intel Corporation Performance Tuning Overview Methodology Benchmarking Timing VTune Counter Monitor Call Graph
ECE 571 Advanced Microprocessor-Based Design Lecture 2
 ECE 571 Advanced Microprocessor-Based Design Lecture 2 Vince Weaver http://www.eece.maine.edu/ vweaver vincent.weaver@maine.edu 4 September 2014 Announcements HW#1 delayed until Tuesday 1 Hardware Performance
Optimize Data Structures and Memory Access Patterns to Improve Data Locality
 Optimize Data Structures and Memory Access Patterns to Improve Data Locality Abstract Cache is one of the most important resources
Introduction to Performance Tuning & Optimization Tools
 Introduction to Performance Tuning & Optimization Tools a[i] a[i+1] + a[i+2] a[i+3] b[i] b[i+1] b[i+2] b[i+3] = a[i]+b[i] a[i+1]+b[i+1] a[i+2]+b[i+2] a[i+3]+b[i+3] Ian A. Cosden, Ph.D. Manager, HPC Software
Performance Profiler. Klaus-Dieter Oertel Intel-SSG-DPD IT4I HPC Workshop, Ostrava,
 Performance Profiler Klaus-Dieter Oertel Intel-SSG-DPD IT4I HPC Workshop, Ostrava, 08-09-2016 Faster, Scalable Code, Faster Intel VTune Amplifier Performance Profiler Get Faster Code Faster With Accurate
Performance Profiling
 Performance Profiling Minsoo Ryu Real-Time Computing and Communications Lab. Hanyang University msryu@hanyang.ac.kr Outline History Understanding Profiling Understanding Performance Understanding Performance
Profiling and Workflow
 Profiling and Workflow Preben N. Olsen University of Oslo and Simula Research Laboratory preben@simula.no September 13, 2013 1 / 34 Agenda 1 Introduction What? Why? How? 2 Profiling Tracing Performance
HPC Lab. Session 4: Profiler. Sebastian Rettenberger, Chaulio Ferreira, Michael Bader. November 9, 2015
 HPC Lab Session 4: Profiler Sebastian Rettenberger, Chaulio Ferreira, Michael Bader November 9, 2015 Session 4: Profiler, November 9, 2015 1 Profiler Profiling allows you to learn where your program spent
Microarchitectural Analysis with Intel VTune Amplifier XE
 Microarchitectural Analysis with Intel VTune Amplifier XE Michael Klemm Software & Services Group Developer Relations Division 1 Legal Disclaimer INFORMATION IN THIS DOCUMENT IS PROVIDED IN CONNECTION
Tools for Intel Xeon Phi: VTune & Advisor Dr. Fabio Baruffa - LRZ,
 Tools for Intel Xeon Phi: VTune & Advisor Dr. Fabio Baruffa - fabio.baruffa@lrz.de LRZ, 27.6.- 29.6.2016 Architecture Overview Intel Xeon Processor Intel Xeon Phi Coprocessor, 1st generation Intel Xeon
Perf with the Linux Kernel. Copyright Kevin Dankwardt
 Perf with the Linux Kernel perf commands annotate annotate source code with profile info kmem kernel memory profiling kvm profile guests list list kinds of events lock analyze lock events record save profile
Bei Wang, Dmitry Prohorov and Carlos Rosales
 Bei Wang, Dmitry Prohorov and Carlos Rosales Aspects of Application Performance What are the Aspects of Performance Intel Hardware Features Omni-Path Architecture MCDRAM 3D XPoint Many-core Xeon Phi AVX-512
HPC Tools on Windows. Christian Terboven Center for Computing and Communication RWTH Aachen University.
 - Excerpt - Christian Terboven terboven@rz.rwth-aachen.de Center for Computing and Communication RWTH Aachen University PPCES March 25th, RWTH Aachen University Agenda o Intel Trace Analyzer and Collector
Munara Tolubaeva Technical Consulting Engineer. 3D XPoint is a trademark of Intel Corporation in the U.S. and/or other countries.
 Munara Tolubaeva Technical Consulting Engineer 3D XPoint is a trademark of Intel Corporation in the U.S. and/or other countries. notices and disclaimers Intel technologies features and benefits depend
Martin Kruliš, v
 Martin Kruliš 1 Optimizations in General Code And Compilation Memory Considerations Parallelism Profiling And Optimization Examples 2 Premature optimization is the root of all evil. -- D. Knuth Our goal
ECE 471 Embedded Systems Lecture 23
 ECE 471 Embedded Systems Lecture 23 Vince Weaver http://www.eece.maine.edu/~vweaver vincent.weaver@maine.edu 1 December 2015 Don t forget projects Announcements HW8, HW9, and HW10 grades were sent out.
Software and Tools for HPE s The Machine Project
 Labs Software and Tools for HPE s The Machine Project Scalable Tools Workshop Aug/1 - Aug/4, 2016 Lake Tahoe Milind Chabbi Traditional Computing Paradigm CPU DRAM CPU DRAM CPU-centric computing 2 CPU-Centric
Using Intel VTune Amplifier XE and Inspector XE in.net environment
 Using Intel VTune Amplifier XE and Inspector XE in.net environment Levent Akyil Technical Computing, Analyzers and Runtime Software and Services group 1 Refresher - Intel VTune Amplifier XE Intel Inspector
CS450/650 Notes Winter 2013 A Morton. Superscalar Pipelines
 CS450/650 Notes Winter 2013 A Morton Superscalar Pipelines 1 Scalar Pipeline Limitations (Shen + Lipasti 4.1) 1. Bounded Performance P = 1 T = IC CPI 1 cycletime = IPC frequency IC IPC = instructions per
Processors, Performance, and Profiling
 Processors, Performance, and Profiling Architecture 101: 5-Stage Pipeline Fetch Decode Execute Memory Write-Back Registers PC FP ALU Memory Architecture 101 1. Fetch instruction from memory. 2. Decode
ZSIM: FAST AND ACCURATE MICROARCHITECTURAL SIMULATION OF THOUSAND-CORE SYSTEMS
 ZSIM: FAST AND ACCURATE MICROARCHITECTURAL SIMULATION OF THOUSAND-CORE SYSTEMS DANIEL SANCHEZ MIT CHRISTOS KOZYRAKIS STANFORD ISCA-40 JUNE 27, 2013 Introduction 2 Current detailed simulators are slow (~200
Intel Architecture for HPC
 Intel Architecture for HPC Georg Zitzlsberger georg.zitzlsberger@vsb.cz 1st of March 2018 Agenda Salomon Architectures Intel R Xeon R processors v3 (Haswell) Intel R Xeon Phi TM coprocessor (KNC) Ohter
Intel VTune Amplifier XE. Dr. Michael Klemm Software and Services Group Developer Relations Division
 Intel VTune Amplifier XE Dr. Michael Klemm Software and Services Group Developer Relations Division Legal Disclaimer & Optimization Notice INFORMATION IN THIS DOCUMENT IS PROVIDED AS IS. NO LICENSE, EXPRESS
Tutorial: Finding Hotspots with Intel VTune Amplifier - Linux* Intel VTune Amplifier Legal Information
 Tutorial: Finding Hotspots with Intel VTune Amplifier - Linux* Intel VTune Amplifier Legal Information Tutorial: Finding Hotspots with Intel VTune Amplifier - Linux* Contents Legal Information... 3 Chapter
Computer Systems A Programmer s Perspective 1 (Beta Draft)
") Computer Systems A Programmer s Perspective 1 (Beta Draft) Randal E. Bryant David R. O Hallaron August 1, 2001 1 Copyright c 2001, R. E. Bryant, D. R. O Hallaron. All rights reserved. 2 Contents Preface
Computer Systems A Programmer s Perspective 1 (Beta Draft) Randal E. Bryant David R. O Hallaron August 1, 2001 1 Copyright c 2001, R. E. Bryant, D. R. O Hallaron. All rights reserved. 2 Contents Preface
ZSIM: FAST AND ACCURATE MICROARCHITECTURAL SIMULATION OF THOUSAND-CORE SYSTEMS
 ZSIM: FAST AND ACCURATE MICROARCHITECTURAL SIMULATION OF THOUSAND-CORE SYSTEMS DANIEL SANCHEZ MIT CHRISTOS KOZYRAKIS STANFORD ISCA-40 JUNE 27, 2013 Introduction 2 Current detailed simulators are slow (~200
Revealing the performance aspects in your code
 Revealing the performance aspects in your code 1 Three corner stones of HPC The parallelism can be exploited at three levels: message passing, fork/join, SIMD Hyperthreading is not quite threading A popular
Basics of Performance Engineering
 ERLANGEN REGIONAL COMPUTING CENTER Basics of Performance Engineering J. Treibig HiPerCH 3, 23./24.03.2015 Why hardware should not be exposed Such an approach is not portable Hardware issues frequently
Generic Cycle Accounting GOODA. Generic Optimization Data Analyzer
 Generic Cycle Accounting GOODA Generic Optimization Data Analyzer What is Gooda Open sourced PMU analysis tool Processes perf.data file created with "perf record" Intrinsically incorporates hierarchical
CS 2410 Mid term (fall 2015) Indicate which of the following statements is true and which is false.
 Indicate which of the following statements is true and which is false.") CS 2410 Mid term (fall 2015) Name: Question 1 (10 points) Indicate which of the following statements is true and which is false. (1) SMT architectures reduces the thread context switch time by saving in
CS 2410 Mid term (fall 2015) Name: Question 1 (10 points) Indicate which of the following statements is true and which is false. (1) SMT architectures reduces the thread context switch time by saving in
CERN IT Technical Forum
 Evaluating program correctness and performance with new software tools from Intel Andrzej Nowak, CERN openlab March 18 th 2011 CERN IT Technical Forum > An introduction to the new generation of software
Performance Tools for Technical Computing
 Christian Terboven terboven@rz.rwth-aachen.de Center for Computing and Communication RWTH Aachen University Intel Software Conference 2010 April 13th, Barcelona, Spain Agenda o Motivation and Methodology
Toward Automated Application Profiling on Cray Systems
 Toward Automated Application Profiling on Cray Systems Charlene Yang, Brian Friesen, Thorsten Kurth, Brandon Cook NERSC at LBNL Samuel Williams CRD at LBNL I have a dream.. M.L.K. Collect performance data:
Memory Subsystem Profiling with the Sun Studio Performance Analyzer
 Memory Subsystem Profiling with the Sun Studio Performance Analyzer CScADS, July 20, 2009 Marty Itzkowitz, Analyzer Project Lead Sun Microsystems Inc. marty.itzkowitz@sun.com Outline Memory performance
Intel VTune Performance Analyzer 9.1 for Windows* In-Depth
 Intel VTune Performance Analyzer 9.1 for Windows* In-Depth Contents Deliver Faster Code...................................... 3 Optimize Multicore Performance...3 Highlights...............................................
ECE 571 Advanced Microprocessor-Based Design Lecture 10
 ECE 571 Advanced Microprocessor-Based Design Lecture 10 Vince Weaver http://web.eece.maine.edu/~vweaver vincent.weaver@maine.edu 22 February 2018 Announcements HW#5 will be posted, caches Midterm: Thursday
Understanding The Performance of DPDK as a Computer Architect
 Understanding The Performance of DPDK as a Computer Architect XIAOBAN WU *, PEILONG LI *, YAN LUO *, LIANG- MIN (LARRY) WANG +, MARC PEPIN +, AND JOHN MORGAN + * UNIVERSITY OF MASSACHUSETTS LOWELL + INTEL
A Comparative Performance Evaluation of Different Application Domains on Server Processor Architectures
 A Comparative Performance Evaluation of Different Application Domains on Server Processor Architectures W.M. Roshan Weerasuriya and D.N. Ranasinghe University of Colombo School of Computing A Comparative
Workload Characterization and Optimization of TPC-H Queries on Apache Spark
 Workload Characterization and Optimization of TPC-H Queries on Apache Spark Tatsuhiro Chiba and Tamiya Onodera IBM Research - Tokyo April. 17-19, 216 IEEE ISPASS 216 @ Uppsala, Sweden Overview IBM Research
Improving Virtual Machine Scheduling in NUMA Multicore Systems
 Improving Virtual Machine Scheduling in NUMA Multicore Systems Jia Rao, Xiaobo Zhou University of Colorado, Colorado Springs Kun Wang, Cheng-Zhong Xu Wayne State University http://cs.uccs.edu/~jrao/ Multicore
CEC 450 Real-Time Systems
 CEC 450 Real-Time Systems Lecture 6 Accounting for I/O Latency September 28, 2015 Sam Siewert A Service Release and Response C i WCET Input/Output Latency Interference Time Response Time = Time Actuation
Intel Architecture for Software Developers
 Intel Architecture for Software Developers 1 Agenda Introduction Processor Architecture Basics Intel Architecture Intel Core and Intel Xeon Intel Atom Intel Xeon Phi Coprocessor Use Cases for Software
Agenda. CS 61C: Great Ideas in Computer Architecture. Virtual Memory II. Goals of Virtual Memory. Memory Hierarchy Requirements
 CS 61C: Great Ideas in Computer Architecture Virtual II Guest Lecturer: Justin Hsia Agenda Review of Last Lecture Goals of Virtual Page Tables Translation Lookaside Buffer (TLB) Administrivia VM Performance
Intel VTune Amplifier XE for Tuning of HPC Applications Intel Software Developer Conference Frankfurt, 2017 Klaus-Dieter Oertel, Intel
 Intel VTune Amplifier XE for Tuning of HPC Applications Intel Software Developer Conference Frankfurt, 2017 Klaus-Dieter Oertel, Intel Agenda Which performance analysis tool should I use first? Intel Application
Processor Architecture V! Wrap-Up!
 Processor Architecture V! Wrap-Up! Lecture 7, April 28 th 2011 Alexandre David Slides by Randal E. Bryant! Carnegie Mellon University! Overview! Wrap-Up of PIPE Design! n Performance analysis! n Fetch
EE382M 15: Assignment 2
 EE382M 15: Assignment 2 Professor: Lizy K. John TA: Jee Ho Ryoo Department of Electrical and Computer Engineering University of Texas, Austin Due: 11:59PM September 28, 2014 1. Introduction The goal of
DEPARTMENT OF COMPUTER SCIENCE AND ENGINEERING UNIT-1
 DEPARTMENT OF COMPUTER SCIENCE AND ENGINEERING Year & Semester : III/VI Section : CSE-1 & CSE-2 Subject Code : CS2354 Subject Name : Advanced Computer Architecture Degree & Branch : B.E C.S.E. UNIT-1 1.
Intel Xeon Phi Coprocessor Performance Analysis
 Intel Xeon Phi Coprocessor Performance Analysis Legal Disclaimer INFORMATION IN THIS DOCUMENT IS PROVIDED IN CONNECTION WITH INTEL PRODUCTS. NO LICENSE, EXPRESS OR IMPLIED, BY ESTOPPEL OR OTHERWISE, TO
ENGN1640: Design of Computing Systems Topic 06: Advanced Processor Design
 ENGN1640: Design of Computing Systems Topic 06: Advanced Processor Design Professor Sherief Reda http://scale.engin.brown.edu Electrical Sciences and Computer Engineering School of Engineering Brown University
CS425 Computer Systems Architecture
 CS425 Computer Systems Architecture Fall 2017 Thread Level Parallelism (TLP) CS425 - Vassilis Papaefstathiou 1 Multiple Issue CPI = CPI IDEAL + Stalls STRUC + Stalls RAW + Stalls WAR + Stalls WAW + Stalls
Benchmarking and Analysis of Software Network Data Planes
 Benchmarking and Analysis of Software Network Data Planes Maciek Konstantynowicz Distinguished Engineer, Cisco (FD.io CSIT Project Lead) Patrick Lu Performance Engineer, Intel Corporation, (FD.io pma_tools
Advanced d Instruction Level Parallelism. Computer Systems Laboratory Sungkyunkwan University
 Advanced d Instruction ti Level Parallelism Jin-Soo Kim (jinsookim@skku.edu) Computer Systems Laboratory Sungkyunkwan University http://csl.skku.edu ILP Instruction-Level Parallelism (ILP) Pipelining:
ECE 471 Embedded Systems Lecture 23
 ECE 471 Embedded Systems Lecture 23 Vince Weaver http://www.eece.maine.edu/ vweaver vincent.weaver@maine.edu 2 December 2014 Announcements Project 1 HW9 Example of disatrous code. Why write good code?
Performance Optimization: Simulation and Real Measurement
 Performance Optimization: Simulation and Real Measurement KDE Developer Conference, Introduction Agenda Performance Analysis Profiling Tools: Examples & Demo KCachegrind: Visualizing Results What s to
ProfileMe: Hardware-Support for Instruction-Level Profiling on Out-of-Order Processors
 ProfileMe: Hardware-Support for Instruction-Level Profiling on Out-of-Order Processors Jeffrey Dean Jamey Hicks Carl Waldspurger William Weihl George Chrysos Digital Equipment Corporation 1 Motivation
NEXTGenIO Performance Tools for In-Memory I/O
 NEXTGenIO Performance Tools for In- I/O holger.brunst@tu-dresden.de ZIH, Technische Universität Dresden 22 nd -23 rd March 2017 Credits Intro slides by Adrian Jackson (EPCC) A new hierarchy New non-volatile
Mental models for modern program tuning
 Mental models for modern program tuning Andi Kleen Intel Corporation Jun 2016 How can we see program performance? VS High level Important to get the common ants fast Army of ants Preliminary optimization
Reorder Buffer Implementation (Pentium Pro) Reorder Buffer Implementation (Pentium Pro)
 Reorder Buffer Implementation (Pentium Pro)") Reorder Buffer Implementation (Pentium Pro) Hardware data structures retirement register file (RRF) (~ IBM 360/91 physical registers) physical register file that is the same size as the architectural registers
Reorder Buffer Implementation (Pentium Pro) Hardware data structures retirement register file (RRF) (~ IBM 360/91 physical registers) physical register file that is the same size as the architectural registers
CSE 141 Summer 2016 Homework 2
 CSE 141 Summer 2016 Homework 2 PID: Name: 1. A matrix multiplication program can spend 10% of its execution time in reading inputs from a disk, 10% of its execution time in parsing and creating arrays
Tutorial: Analyzing MPI Applications. Intel Trace Analyzer and Collector Intel VTune Amplifier XE
 Tutorial: Analyzing MPI Applications Intel Trace Analyzer and Collector Intel VTune Amplifier XE Contents Legal Information... 3 1. Overview... 4 1.1. Prerequisites... 5 1.1.1. Required Software... 5 1.1.2.
A common scenario... Most of us have probably been here. Where did my performance go? It disappeared into overheads...
 OPENMP PERFORMANCE 2 A common scenario... So I wrote my OpenMP program, and I checked it gave the right answers, so I ran some timing tests, and the speedup was, well, a bit disappointing really. Now what?.
Security-Aware Processor Architecture Design. CS 6501 Fall 2018 Ashish Venkat
 Security-Aware Processor Architecture Design CS 6501 Fall 2018 Ashish Venkat Agenda Common Processor Performance Metrics Identifying and Analyzing Bottlenecks Benchmarking and Workload Selection Performance
ΕΛΠ 605: Προχωρηµένη Αρχιτεκτονική Υπολογιστών. Εργαστήριο Αρ. 4. Linux Monitoring Utilities (perf,top,mpstat ps, free) and gdb dissasembler, gnuplot
 and gdb dissasembler, gnuplot") ΕΛΠ 605: Προχωρηµένη Αρχιτεκτονική Υπολογιστών Εργαστήριο Αρ. 4 Linux Monitoring Utilities (perf,top,mpstat ps, free) and gdb dissasembler, gnuplot Lecturer: Zacharias Hadjilambrou Σελ. 1 Realtime monitoring
ΕΛΠ 605: Προχωρηµένη Αρχιτεκτονική Υπολογιστών Εργαστήριο Αρ. 4 Linux Monitoring Utilities (perf,top,mpstat ps, free) and gdb dissasembler, gnuplot Lecturer: Zacharias Hadjilambrou Σελ. 1 Realtime monitoring
The Processor: Instruction-Level Parallelism
 The Processor: Instruction-Level Parallelism Computer Organization Architectures for Embedded Computing Tuesday 21 October 14 Many slides adapted from: Computer Organization and Design, Patterson & Hennessy
Anastasia Ailamaki. Performance and energy analysis using transactional workloads
 Performance and energy analysis using transactional workloads Anastasia Ailamaki EPFL and RAW Labs SA students: Danica Porobic, Utku Sirin, and Pinar Tozun Online Transaction Processing $2B+ industry Characteristics:
Reducing Hit Times. Critical Influence on cycle-time or CPI. small is always faster and can be put on chip
 Reducing Hit Times Critical Influence on cycle-time or CPI Keep L1 small and simple small is always faster and can be put on chip interesting compromise is to keep the tags on chip and the block data off
COSC 6385 Computer Architecture - Thread Level Parallelism (I)
") COSC 6385 Computer Architecture - Thread Level Parallelism (I) Edgar Gabriel Spring 2014 Long-term trend on the number of transistor per integrated circuit Number of transistors double every ~18 month
COSC 6385 Computer Architecture - Thread Level Parallelism (I) Edgar Gabriel Spring 2014 Long-term trend on the number of transistor per integrated circuit Number of transistors double every ~18 month
Intel VTune Amplifier XE Overview
 Intel VTune Amplifier XE Overview June 2011 1 Intel Parallel Studio XE 2011 Phase Productivity Tool Feature Benefit Advanced Build & Debug Intel Composer XE C/C++ and Fortran compilers, performance libraries,and
CS 152 Computer Architecture and Engineering
 CS 152 Computer Architecture and Engineering Lecture 19 Advanced Processors III 2006-11-2 John Lazzaro (www.cs.berkeley.edu/~lazzaro) TAs: Udam Saini and Jue Sun www-inst.eecs.berkeley.edu/~cs152/ 1 Last
The Pentium II/III Processor Compiler on a Chip
 The Pentium II/III Processor Compiler on a Chip Ronny Ronen Senior Principal Engineer Director of Architecture Research Intel Labs - Haifa Intel Corporation Tel Aviv University January 20, 2004 1 Agenda
CS 61C: Great Ideas in Computer Architecture. Virtual Memory
 CS 61C: Great Ideas in Computer Architecture Virtual Memory Instructor: Justin Hsia 7/30/2012 Summer 2012 Lecture #24 1 Review of Last Lecture (1/2) Multiple instruction issue increases max speedup, but
Computer Science 146. Computer Architecture
 Computer Architecture Spring 24 Harvard University Instructor: Prof. dbrooks@eecs.harvard.edu Lecture 2: More Multiprocessors Computation Taxonomy SISD SIMD MISD MIMD ILP Vectors, MM-ISAs Shared Memory
The Nios II Family of Configurable Soft-core Processors
 The Nios II Family of Configurable Soft-core Processors James Ball August 16, 2005 2005 Altera Corporation Agenda Nios II Introduction Configuring your CPU FPGA vs. ASIC CPU Design Instruction Set Architecture
Stanislav Bratanov; Roman Belenov; Ludmila Pakhomova 4/27/2015
 Stanislav Bratanov; Roman Belenov; Ludmila Pakhomova 4/27/2015 What is Intel Processor Trace? Intel Processor Trace (Intel PT) provides hardware a means to trace branching, transaction, and timing information
Breaking Kernel Address Space Layout Randomization (KASLR) with Intel TSX. Yeongjin Jang, Sangho Lee, and Taesoo Kim Georgia Institute of Technology
 with Intel TSX. Yeongjin Jang, Sangho Lee, and Taesoo Kim Georgia Institute of Technology") Breaking Kernel Address Space Layout Randomization (KASLR) with Intel TSX Yeongjin Jang, Sangho Lee, and Taesoo Kim Georgia Institute of Technology Kernel Address Space Layout Randomization (KASLR) A statistical
Breaking Kernel Address Space Layout Randomization (KASLR) with Intel TSX Yeongjin Jang, Sangho Lee, and Taesoo Kim Georgia Institute of Technology Kernel Address Space Layout Randomization (KASLR) A statistical
Processor (IV) - advanced ILP. Hwansoo Han
 - advanced ILP. Hwansoo Han") Processor (IV) - advanced ILP Hwansoo Han Instruction-Level Parallelism (ILP) Pipelining: executing multiple instructions in parallel To increase ILP Deeper pipeline Less work per stage shorter clock cycle
Processor (IV) - advanced ILP Hwansoo Han Instruction-Level Parallelism (ILP) Pipelining: executing multiple instructions in parallel To increase ILP Deeper pipeline Less work per stage shorter clock cycle
Hardware Performance Monitoring Unit Working Group Outbrief
 Hardware Performance Monitoring Unit Working Group Outbrief CScADS Performance Tools for Extreme Scale Computing August 2011 hpctoolkit.org Topics From HW-centric measurements to application understanding
CS 426 Parallel Computing. Parallel Computing Platforms
 CS 426 Parallel Computing Parallel Computing Platforms Ozcan Ozturk http://www.cs.bilkent.edu.tr/~ozturk/cs426/ Slides are adapted from ``Introduction to Parallel Computing'' Topic Overview Implicit Parallelism:
Efficient and Large Scale Program Flow Tracing in Linux. Alexander Shishkin, Intel
 Efficient and Large Scale Program Flow Tracing in Linux Alexander Shishkin, Intel 16.09.2013 Overview Program flow tracing - What is it? - What is it good for? Intel Processor Trace - Features / capabilities
Memory Hierarchy Computing Systems & Performance MSc Informatics Eng. Memory Hierarchy (most slides are borrowed)
") Computing Systems & Performance Memory Hierarchy MSc Informatics Eng. 2011/12 A.J.Proença Memory Hierarchy (most slides are borrowed) AJProença, Computer Systems & Performance, MEI, UMinho, 2011/12 1 2
Computing Systems & Performance Memory Hierarchy MSc Informatics Eng. 2011/12 A.J.Proença Memory Hierarchy (most slides are borrowed) AJProença, Computer Systems & Performance, MEI, UMinho, 2011/12 1 2
TDT Coarse-Grained Multithreading. Review on ILP. Multi-threaded execution. Contents. Fine-Grained Multithreading
 Review on ILP TDT 4260 Chap 5 TLP & Hierarchy What is ILP? Let the compiler find the ILP Advantages? Disadvantages? Let the HW find the ILP Advantages? Disadvantages? Contents Multi-threading Chap 3.5
Performance. CS 3410 Computer System Organization & Programming. [K. Bala, A. Bracy, E. Sirer, and H. Weatherspoon]
![Performance. CS 3410 Computer System Organization & Programming. [K. Bala, A. Bracy, E. Sirer, and H. Weatherspoon]](/thumbs/93/113797768.jpg "Performance. CS 3410 Computer System Organization & Programming. [K. Bala, A. Bracy, E. Sirer, and H. Weatherspoon]") Performance CS 3410 Computer System Organization & Programming [K. Bala, A. Bracy, E. Sirer, and H. Weatherspoon] Performance Complex question How fast is the processor? How fast your application runs?
Performance CS 3410 Computer System Organization & Programming [K. Bala, A. Bracy, E. Sirer, and H. Weatherspoon] Performance Complex question How fast is the processor? How fast your application runs?
Memory Hierarchy Computing Systems & Performance MSc Informatics Eng. Memory Hierarchy (most slides are borrowed)
") Computing Systems & Performance Memory Hierarchy MSc Informatics Eng. 2012/13 A.J.Proença Memory Hierarchy (most slides are borrowed) AJProença, Computer Systems & Performance, MEI, UMinho, 2012/13 1 2
Computing Systems & Performance Memory Hierarchy MSc Informatics Eng. 2012/13 A.J.Proença Memory Hierarchy (most slides are borrowed) AJProença, Computer Systems & Performance, MEI, UMinho, 2012/13 1 2
Intel Parallel Studio: Vtune
 ntel Parallel Studio: Vtune C.Berthelot Christophe.Berthelot@atos.net Copyright c Bull S.A.S. 2016 1 C.Berthelot Christophe.Berthelot@atos.net c Atos Agenda ntroduction Bottelneck Gprof ntroduction The
CS 261 Fall Caching. Mike Lam, Professor. (get it??)
") CS 261 Fall 2017 Mike Lam, Professor Caching (get it??) Topics Caching Cache policies and implementations Performance impact General strategies Caching A cache is a small, fast memory that acts as a buffer
CS 261 Fall 2017 Mike Lam, Professor Caching (get it??) Topics Caching Cache policies and implementations Performance impact General strategies Caching A cache is a small, fast memory that acts as a buffer
I/O Profiling Towards the Exascale
 I/O Profiling Towards the Exascale holger.brunst@tu-dresden.de ZIH, Technische Universität Dresden NEXTGenIO & SAGE: Working towards Exascale I/O Barcelona, NEXTGenIO facts Project Research & Innovation
Real Processors. Lecture for CPSC 5155 Edward Bosworth, Ph.D. Computer Science Department Columbus State University
 Real Processors Lecture for CPSC 5155 Edward Bosworth, Ph.D. Computer Science Department Columbus State University Instruction-Level Parallelism (ILP) Pipelining: executing multiple instructions in parallel
ECE 571 Advanced Microprocessor-Based Design Lecture 4
 ECE 571 Advanced Microprocessor-Based Design Lecture 4 Vince Weaver http://www.eece.maine.edu/~vweaver vincent.weaver@maine.edu 28 January 2016 Homework #1 was due Announcements Homework #2 will be posted
CS252 S05. Main memory management. Memory hardware. The scale of things. Memory hardware (cont.) Bottleneck
 Bottleneck") Main memory management CMSC 411 Computer Systems Architecture Lecture 16 Memory Hierarchy 3 (Main Memory & Memory) Questions: How big should main memory be? How to handle reads and writes? How to find
Main memory management CMSC 411 Computer Systems Architecture Lecture 16 Memory Hierarchy 3 (Main Memory & Memory) Questions: How big should main memory be? How to handle reads and writes? How to find
Sequential Optimization. Analysis Tools and Cache Optimization. Lab Course Efficient Programming of Multicore-Systems and Supercomputers
 Sequential Optimization Analysis Tools and Cache Optimization Lab Course Efficient Programming of Multicore-Systems and Supercomputers Outline Performance analysis tools/libraries Measurement strategies
Computer Architecture Computer Science & Engineering. Chapter 5. Memory Hierachy BK TP.HCM
 Computer Architecture Computer Science & Engineering Chapter 5 Memory Hierachy Memory Technology Static RAM (SRAM) 0.5ns 2.5ns, $2000 $5000 per GB Dynamic RAM (DRAM) 50ns 70ns, $20 $75 per GB Magnetic