Eye P.A. User Guide. Table of Contents
|
|
|
- Natalie Turner
- 5 years ago
- Views:
Transcription

1 Eye P.A. User Guide support.metageek.com/hc/en-us/articles/ eye-p-a-user-guide Table of Contents System Requirements Installation Direct Capture Compatible File Formats Main Views Data Visuals Associated Data Table Analyze Copy to Clipboard Frequently Asked Questions Understanding Colors How to get a PCAP File System Requirements OPERATING SYSTEM: Microsoft Windows XP, Vista, 7, 8 OS X VIRTUALIZATION: VMware Fusion, Parallels DISPLAY RESOLUTION: 1024x768.NET FRAMEWORK: 4.0 (or better) RAM: 4 GB recommended Installation Download 1/21


2 MetaGeek Software AirPcap NX Driver (if using a Riverbed AirPcap NX) Run the Installer Locate the installation file and run it. Follow the installer prompts. If you are using an AirPcap NX to obtain packet captures, install the AirPcap NX driver as well. Run Eye P.A. In Windows 7, click the Start button, click All Programs > MetaGeek > Eye P.A. In Windows 8, press the Windows key on the keyboard, type Eye P.A., and press Enter or click the icon. Direct Capture Eye P.A. can capture packets with an accompanying AirPcap NX USB adapter. To begin, connect your device to your computer's USB port and open Eye P.A. Click the Start tab at the top of the screen. Here you will select the device that you would like to capture with, as well as the band and channel. Each AirPcap NX can capture one channel at a time. Up to three AirPcap NX's can be used to capture on multiple channels, simultaneously. Click Start Capture to being accumulating raw frames. Compatible File Formats Eye P.A. visualizes captures from a variety of sources. Captures can be obtained from within Eye P.A. with an AirPcap NX in Windows, Linux, the Wireless Diagnostics tool in macos, or from an access point. Note: Files containing ethernet traffic are not compatible with Eye P.A..pcap and.wcap Not all.pcap files are structured in the same way. Eye P.A. requires Radiotap or common headers to calculate wireless packet airtime. The most common tool used to generate compatible captures is Wireshark for Mac or Linux..pcapng (Wireshark 1.8) 2/21

3 In 2012, Wireshark changed the default filetype to.pcapng. Any version of Wireshark installed after 2012 will support this filetype. Pcapng allows more flexibility, like extendedinterface host information and annotation, but is not compatible with all tools..pkt and.apc (WildPackets OmniPeek) While experimental, WildPackets OmniPeek files that contain frames can usually be opened in Eye P.A. if they have the extensions.pkt or.apc. Each of these files will export to Wireshark in the same manner as a.pcap or.pcap-ng file..cap (Microsoft Network Monitor) Limited support for capture is available in Windows with the release of Network Monitor 3.4. The full monitor-mode capabilities are limited to certain wireless cards and might provide little-to-no information regarding data rate, RSSI, and n frames depending on your wireless card..ncf (CommView for WiFi) To acquire full n captures on a Windows machine without an AirPcap NX, use CommView for WiFi, which supports more wireless adapters than nearly any other packet capture solution, but has limitations much like Microsoft Network Monitor. Main Views Visualize Packets 3/21

4 Work Flow Across the top of Eye P.A. are 4 different tabs called the Work Flow. Capture Tab - Open captures, or create new ones with the AirPcap Nx Visualize - View captures with time graphs, multilayered pie charts, and data tables Analyze - Automatic expert analysis Packets - View conversations between AP's and clients Filter Bar The top of the filter bar is where the user can files by SSID or Vendor, MAC address, channel, data rate, RSSI, and subframe type. Users can apply exclusive filters to quickly remove data by selectiong the - before the field. Selecting + will build an inclusive filter. The Data Rate and RSSI can also be filtered based on a greater than or less than selection. For example, these filters could be used to remove all frames with an RSSI less than or equal to -90 dbm. It can also be helpful to filter out certain types of packets like beacons, acknowledgements, or other non-essential frame types to focus on the packets that matter the most. To remove specific frame types, click Subframe Filters drop-down menu, and uncheck the frames as needed. 4/21


5 Filter Bread crumbs The filter bread crumbs represent the current requirements the user has manually entered as filters or navigated to by means of the multi-layered pie chart. To remove a crumb click the x. Bread crumbs will either be black to represent exclusive filters or gray to show inclusive filters. Note: Filtering packets will affect the data exported to Wireshark. For example if beacons are unchecked from the display filters, they will be excluded from the data export. Adjustable Time Graph Eye P.A. displays a historical summary of the data capture in the top time slider. 5/21


6 The darker yellow in the background represents all frames in the capture, while the brighter yellow in the foreground of the graph represents the data currently in view after navigation and filters have been applied. Sometimes a capture may have a dark yellow without any filters applied. This means some of the frames were corrupted and are invalid for reliable display. To see them in the graphs add a check to the Show Invalid checkbox in the filter bar. To the left of the Time Graph are toggles for changing the data to reflect Air Time, Bytes, and Packets. Active Selection The Active Selection legend displays the related data to the center of the multi-layered pie chart. This data will change as the user drills down through layers. It displays total airtime, byes, number of packets, SSIDs, clients, and retry rate percentages. Below this information is a bar chart displaying the percentage of clients active at each detected data rate. Associated Data Table The Associated Data Table provides details for innermost ring of the multi-layered pie chart. Table Columns Client - Identifier for each client 6/21
7 Air Time -The amount of time used to transmit Bytes - The amount of data transferred Packets - The total number of packets per SSID, client, or subframe type Effective Data Rate - The average data rate achieved between the client and access point conversation Retry Rate - The percentage of packets that had to be resent As you sort the column headers, the treepie will be rearranged. The sorted data is displayed clockwise in the order indicated in the table data. ESSID and Radio Grouping Select the Radio button to group virtual SSID's together, or select the ESSID button to group access points with the same SSID together in the multi-layered pie chart and Associated Data table. ESSID Grouping An ESSID refers to a group of unique access points with the same SSID, typically spread out across a building or campus. When ESSID Grouping is selected, the innermost ring of the multilayered pie chart refers to the ESSID, or the name of your network. The next ring in the pie chart shows each individual SSID (or unique access point) that belongs to the ESS. 7/21


8 ESSID Grouping also extends into the Associated Data table; each line of the table groups an ESS. Each line in the Associated Data table represents a group of access points with the same SSID. Radio Grouping A Radio refers to a group of virtual SSID's on the same access point, such as "MetaGeek- Developers" and "MetaGeek-Operations". 8/21

9 When Radio Grouping is selected, the innermost ring of the multilayered pie chart refers to an individual radio, or unique access point on your network. The next ring in the pie chart shows each virtual SSID on that radio. Note: This network has a lot of virtual SSID's. Notice how much airtime they are consuming, and they are only beaconing. Eye P.A. makes this type of visualization really easy! ESSID Grouping also extends into the Associated Data table; each line of the table groups an ESS. If your Aruba or Cisco access point has a name configured, the name will be displayed. 9/21


10 Each Line in the Radio column represents a group of SSID's on the same access point. Packet Viewer Eye P.A. will display the basic details of individual packets in the Packets Table, including Subframe Type, RSSI, Data Rate, and Destination. The user can define the columns in the packet viewer by right-clicking on a header and selecting the details they wish to view. Apply filters from the Filter Bar or use the treepie on the left to drill down into the packet viewer. 10/21

11 Eye P.A. will automatically remove columns as they become redundant due to the filtered data set. For example, if the BSSID is the same in every frame, it will no longer be represented in a column. To bring back any missing columns, right-click at the top of the packet viewer table and select the needed columns. Flags Column The Flags column highlights frames that are: - Retransmissions! - Invalid Frames Data Visuals Multi-Layered Pie Charts 11/21

12 There are three multi-layered pie charts in the Visualize tab. Eye P.A.'s multi-layered pie charts continually divide each slice into more slices based on percentages. Ring Order Starting from the inside and working outward, the default ring order in Eye P.A. is: 1. Radio Group/BSSID Group 2. SSIDs 3. Clients 4. Subframe Types To alternate between the different types of data, click the arrow above and multi-layered pie chart to select Air Time, Packets, or Bytes to move it to the featured position. The size of each slice is proportionate to the total packets, bytes, or air time utilized. Data Types Packets - The proportionate amounts of packets in comparison to the total captured. Byes - 100% of the total data captured in bytes. Each slice is the total data sent by BSSID or client. Air Time - The proportionate amount of air time each station utilized. It is important to note that lower data rates use more air time than higher data rates to transfer the same number of bytes. Wireless communication is half-duplex, so only one device can transmit at a 12/21

13 time. Therefore, the amount of time each station takes prohibits the other stations from transmitting. Drill-Down Each element in the multi-layered pie chart can be clicked on, drilling down and breaking the data down into a new pie chart for easy troubleshooting. To return to a parent layer, click the center of the pie chart, or the home icon in the top left of the window. The layer directly outside of the center is represented in the table. Double clicking on a row will change the pie charts to reflect the selected data. Note: If there are multiple channels present in your capture, a message will be displayed across the pie chart. To correct this, simply select the channel you're most interested in from the Channels filter. Hover (Inspector Tool) When hovering the mouse over a slice in the multi-layered pie chart, a tool tip will appear, providing additional details like data rates, packet counts, and retry rates. This information is also displayed in the Associated Data Table. Analyze 13/21


14 Eye P.A. examines a variety of aspects of your capture, and will provide analysis based upon what it finds. After starring the networks you are interested in, a pie chart will be shown that displays the percentages of the starred network s data, retransmits, control, and management packets compared to the percentage of packets belonging to other networks. The remaining black area of the pie chart represents the amount of available air time. Below the pie chart, you will find suggestions for adjustments you can make in order to better your wireless network s performance. The areas where Eye P.A. looks for improvements include protection mechanisms, presence of legacy rates, high retransmission rates, encryption settings, and channel choice issues. 14/21


15 Any applicable tips will be shown for each network you star. Clicking the clipboard icon to the right of your selected network s name in the tips window will copy the tips for that network to your clipboard, allowing for easy export. Copy to Clipboard Eye P.A. contains a clipboard icon in each pane. Clicking this will copy the contents of the pane to the clipboard. The time graph and and treepies will be copied as images, while the active selection and associated data table will be copied as text, ready to paste into a text editor or spreadsheet application. Send to Wireshark Send any layer of the multi-layer pie chart to WireShark by clicking File in the main menu and then Send to Wireshark. Conveniently, Eye P.A. automatically bundles up the data in the current multi-layer pie chart, applies the filters you ve drilled down to select, and sends all of the packets to Wireshark for more in-depth analysis. 15/21

16 Frequently Asked Questions What is the "Broadcast" SSID? In , clients or stations can broadcast management frames called Probe Requests. Probe requests occur when stations are looking for access points they previously connected with. These do not occur in a network but Eye P.A. groups them into a broadcast group for organizational simplicity. Why won't Eye P.A. open my.pcap file? There are currently two types of.pcap files that Eye P.A. can open. The.pcap must contain frames with Radiotap or common PPI headers. Typically these captures are created using: Wireshark with an AirPcap adapter OS X with the WiFi Diagnostics tool, or Wireshark in monitor mode Linux with Wireshark or Kismet A.cap,.pcap, or.pcap-ng from an enterprise access point Why are packet counts different in Wireshark and Eye P.A.? Sometimes the capturing device receives packets that are malformed or corrupt. Eye P.A. drops any packets that do not have a proper Frame Check Sequence (FCS) in the packet, even though Wireshark will display those packets. What is a hidden SSID? Some wireless network administrators may hide their SSID, which tells the access point to not broadcast it's name. Typically the only users who know the name of the wireless network can connect to a hidden SSID. Note: This method does not provide additional security. What is the "miscellaneous" grey slice? 16/21
17 The gray slices contain small pieces of valid packet data from a lot of different sources. For example, a capture file may have 10 top talkers that make up 90 percent of the total traffic. However, 100 clients make up the remaining 10 percent. Instead of drawing each slice, Eye P.A. aggregates them into miscellaneous slices. The miscellaneous slice is colored gray because it may contain management, data, and control frames. To view any of the data in the gray slice, click on its parent slice and all of the data will be drawn. How is the Effective Data Rate calculated? The effective data rate reflects the data frames transferred to and from a BSSID and client. Eye P.A. takes the total bytes transferred and divides it by the total air time. The air time for each frame is calculated by dividing the bytes in the payload by the data rate for that frame. Understanding Color Data Rate The second layer of the multi-layered pie chart (SSID ring) is colored by the average data rate of the traffic. The shade of green is based on a sliding scale. The minimum average data rate captured is represented by light green, while the highest is represented by dark green, with shades in between. 17/21
18 Data Frames Data frames carry the actual data passed down from higher layer protocols. 18/21
19 Management Frames Usually the majority of frames on the network. Used by wireless stations to join and leave networks. 19/21

20 Control Frames Control frames help with the delivery of the data frames. Control frames must be able to be heard by all stations; therefore, they must be transmitted at one of the basic rates. Control frames are also used to clear the channel, acquire the channel, and provide unicast frame acknowledgments. 20/21
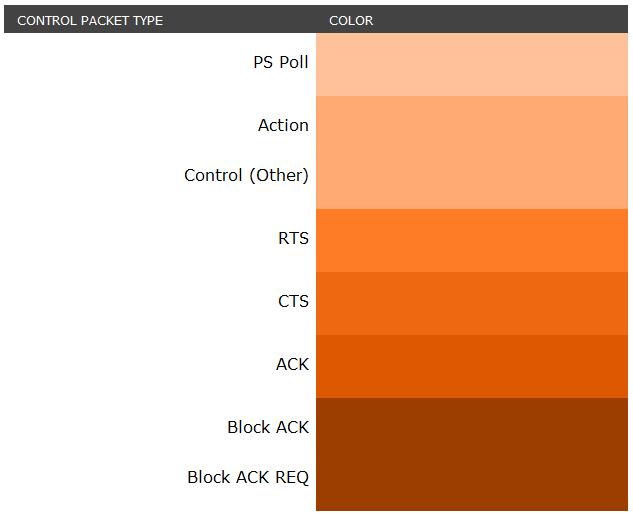
21 21/21
Table of Contents. inssider Office User Guide
 inssider Office User Guide Table of Contents Overview Navigation Networks Filters Coloring Rules Physical and Logical Grouping Channels AP Aliasing Signal Strength Threshold Copy to Clipboard Export a
About Clients, on page 1 Monitor and Troubleshoot the Health of a Client Device, on page 10. Monitor and Troubleshoot the Health of All Client Devices
 About Clients, on page 1 Monitor and Troubleshoot the Health of All Client Devices, on page 1 Monitor and Troubleshoot the Health of a Client Device, on page 10 Trace the Path of a Device, on page 13 About
SharkFest 18 Europe. Troubleshooting WLANs (Part 2) Troubleshooting WLANs using Management & Control Frames. Rolf Leutert
 Troubleshooting WLANs using Management & Control Frames. Rolf Leutert") SharkFest 18 Europe Troubleshooting WLANs (Part 2) Troubleshooting WLANs using 802.11 Management & Control Frames Rolf Leutert Leutert NetServices Switzerland www.netsniffing.ch Introduction 2 Rolf Leutert,
SharkFest 18 Europe Troubleshooting WLANs (Part 2) Troubleshooting WLANs using 802.11 Management & Control Frames Rolf Leutert Leutert NetServices Switzerland www.netsniffing.ch Introduction 2 Rolf Leutert,
Assure the Health of Your Network
 DNA Center Assurance Overview, on page 1 Monitor and Troubleshoot the Overall Health of Your Enterprise, on page 4 Monitor and Troubleshoot the Health of Your Network, on page 7 Monitor and Troubleshoot
Valley. Scheduling. Client User Manual _ Valmont Industries, Inc., Valley, NE USA. All rights reserved.
 Valley Scheduling Client User Manual 09805_0 09 Valmont Industries, Inc., Valley, NE 6806 USA. All rights reserved. www.valleyirrigation.com Valley Scheduling This page was left blank intentionally Table
Bill Analyser User Guide
 Bill Analyser User Guide emobile.ie/business Contents 1.0 Basic Concepts... 3 1.1 Users and Roles... 3 Standard Users... 3 Global Users... 3 eircom User Roles... 3 Available user roles... 3 1.2 Data Structure...
inssider User Guide inssider by MetaGeek USER GUIDE Page 1 Tel: +44 (0) Fax: +44 (0)
 Fax: +44 (0)") inssider User Guide inssider by MetaGeek USER GUIDE Page 1 inssider Free Wi-Fi Scanning Software for Windows Table of Contents Introduction Overview Getting Started Networks Table Network Table Data Columns
inssider User Guide inssider by MetaGeek USER GUIDE Page 1 inssider Free Wi-Fi Scanning Software for Windows Table of Contents Introduction Overview Getting Started Networks Table Network Table Data Columns
QDA Miner. Addendum v2.0
 QDA Miner Addendum v2.0 QDA Miner is an easy-to-use qualitative analysis software for coding, annotating, retrieving and reviewing coded data and documents such as open-ended responses, customer comments,
SharkFest 16 Europe. Troubleshooting with Monitoring Mode Finding Patterns in your pcaps
 SharkFest 16 Europe Troubleshooting 802.11 with Monitoring Mode Finding Patterns in your pcaps 19.10.2016 Thomas Baudelet #sf16eu Freelance Network & Security Troubleshooter iwaxx Sàrl About Freelance
PMS 138 C Moto Black spine width spine width 100% 100%
 Series MOTOROLA and the Stylized M Logo are registered in the US Patent & Trademark Office. All other product or service names are the property of their respective owners. 2009 Motorola, Inc. Table of
Excel 2013 Intermediate
 Instructor s Excel 2013 Tutorial 2 - Charts Excel 2013 Intermediate 103-124 Unit 2 - Charts Quick Links Chart Concepts Page EX197 EX199 EX200 Selecting Source Data Pages EX198 EX234 EX237 Creating a Chart
Monitoring the Mobility Express Network
 About the Cisco Mobility Express Monitoring Service, on page 1 Customizing the Network Summary View, on page 2 Viewing the Details of Configured WLANs, on page 5 Customizing Access Points Table View, on
Wireshark, Where Did the Time Go?
 Wireshark, Where Did the Time Go? At Cisco Meraki, we depend heavily on open source software to help us solve today s networking problems. This white paper focuses on a contribution that we made to a powerful
This section contains context-sensitive Online Help content for the Web Client > Monitor tab.
 This section contains context-sensitive Online Help content for the Web Client > tab. Viewing Switch CPU Information, page 2 Viewing Switch Memory Information, page 2 Viewing Switch Traffic and Errors
Troubleshooting VoWLAN using OmniPeek
 CHAPTER 6 Capturing Data for Wireless Analysis To troubleshoot VoWLAN, we must first capture the wireless data carrying the VoWLAN information. Capturing data for wireless analysis can be broken down into
BusinessObjects Frequently Asked Questions
 BusinessObjects Frequently Asked Questions Contents Is there a quick way of printing together several reports from the same document?... 2 Is there a way of controlling the text wrap of a cell?... 2 How
Insight: Measurement Tool. User Guide
 OMERO Beta v2.2: Measurement Tool User Guide - 1 - October 2007 Insight: Measurement Tool User Guide Open Microscopy Environment: http://www.openmicroscopy.org OMERO Beta v2.2: Measurement Tool User Guide
Xirrus Wi-Fi Inspector User s Guide
 Xirrus Wi-Fi Inspector User s Guide Xirrus Wi-Fi Inspector User s Guide Version 1.2.0 September 17, 2010 Description The Xirrus Wi-Fi Inspector is a utility for monitoring Wi-Fi networks and managing the
Keynote 08 Basics Website:
 Website: http://etc.usf.edu/te/ Keynote is Apple's presentation application. Keynote is installed as part of the iwork suite, which also includes the word processing program Pages and the spreadsheet program
econnect Baccarat User Guide EC7 June 2017
 econnect Baccarat User Guide EC7 June 2017 Table of Contents Baccarat Camera View A. Card Displayed on Virtual Table B. Bet Session Recording C. How to open a camera D. What is displayed on Data View E.
BSc Year 2 Data Communications Lab - Using Wireshark to View Network Traffic. Topology. Objectives. Background / Scenario
 BSc Year 2 Data Communications Lab - Using Wireshark to View Network Traffic Topology Objectives Part 1: (Optional) Download and Install Wireshark Part 2: Capture and Analyze Local ICMP Data in Wireshark
Lab Exercise Protocol Layers
 Lab Exercise Protocol Layers Objective To learn how protocols and layering are represented in packets. They are key concepts for structuring networks that are covered in 1.3 and 1.4 of your text. Review
Trace Collection Guidelines
 Trace Collection Guidelines WiNG 5 Vik Evans Systems Engineer Enterprise Networking and Communications 1 Troubleshooting Checklist Mandatory Information ID Description Response 1 Customer 2 Perceived Problem
Working with Charts Stratum.Viewer 6
 Working with Charts Stratum.Viewer 6 Getting Started Tasks Additional Information Access to Charts Introduction to Charts Overview of Chart Types Quick Start - Adding a Chart to a View Create a Chart with
New Finance Officer & Staff Training
 New Finance Officer & Staff Training Overview MUNIS includes many programs and tools to allow for the management of the District financials. As newer finance officers and staff, you are charged with understanding,
ARUBA INSTANT BEST PRACTICES & TROUBLESHOOTING
 ARUBA INSTANT BEST PRACTICES & TROUBLESHOOTING Technical Climb Webinar 12:00 GMT 13:00 CET 15:00 GST March 29th, 2016 Presenter: Barath Srinivasan barath.srinivasan@hpe.com Welcome to the Technical Climb
WhatsUp Gold Wireless v16.4
 WhatsUp Gold Wireless v16.4 Contents Welcome to WhatsUp Gold Wireless Wireless Overview... 1 Wireless accessibility... 3 Using WhatsUp Gold Wireless Discovering wireless devices... 4 Modifying wireless
Lab Using Wireshark to Examine Ethernet Frames
 Topology Objectives Part 1: Examine the Header Fields in an Ethernet II Frame Part 2: Use Wireshark to Capture and Analyze Ethernet Frames Background / Scenario When upper layer protocols communicate with
Kona ALL ABOUT FILES
 Kona ALL ABOUT FILES February 20, 2014 Contents Overview... 4 Add a File/Link... 5 Add a file via the Files tab... 5 Add a file via a conversation, task, or event... 6 Add a file via a comment... 7 Add
IMAGE STUDIO LITE. Tutorial Guide Featuring Image Studio Analysis Software Version 3.1
 IMAGE STUDIO LITE Tutorial Guide Featuring Image Studio Analysis Software Version 3.1 Notice The information contained in this document is subject to change without notice. LI-COR MAKES NO WARRANTY OF
Armatus 2.0 Administrator Procedures
 2015 Armatus 2.0 Administrator Procedures Praesidium 2015. All rights reserved. Armatus 2.0 Administrator Procedures Overview Introduction This guide shows you how to perform tasks in Armatus 2.0 Administrator
Ringtail Basics. Quick Start Guide
 Ringtail Basics Quick Start Guide Ringtail 8 brings a new level of simplicity, ease of use, and efficiency to document review. The following pages walk through scenarios, based on common tasks, to show
Contacting WildPackets
 Copyright 2009, WildPackets, Inc. All rights reserved. Information in this document is subject to change without notice. No part of this document may be reproduced or transmitted in any form, or by any
Welcome! SharkFest 16 Europe. Troubleshooting WLANs (Part 2) Rolf Leutert
 Rolf Leutert") SharkFest 16 Europe Troubleshooting WLANs (Part 2) Troubleshooting WLANs using 802.11 Management & Control Frames 19. October 2016 Welcome! #sf16eu Rolf Leutert Leutert NetServices Switzerland www.netsniffing.ch
SharkFest 16 Europe Troubleshooting WLANs (Part 2) Troubleshooting WLANs using 802.11 Management & Control Frames 19. October 2016 Welcome! #sf16eu Rolf Leutert Leutert NetServices Switzerland www.netsniffing.ch
Wireless LAN USB Super G 108 Mbit. Manual
 Wireless LAN USB Super G 108 Mbit Manual Dear Customer, Thanks for choosing Hamlet. Please carefully follow the instructions for its use and maintenance and, once this item has run its life span, we kindly
Introduction. Rehearse and Record Slide Shows. Advanced Presentation Options. Rehearsing Slide Show Timings. Page 1
 Advanced Presentation Options Introduction Page 1 There are many things to keep in mind when giving a presentation. How long will your presentation last? What will you say? If you're not in the same location
Calendar & Buttons Dashboard Menu Features My Profile My Favorites Watch List Adding a New Request...
 remitview User Guide 1 TABLE OF CONTENTS INTRODUCTION... 3 Calendar & Buttons... 3 GETTING STARTED.... 5 Dashboard.... 7 Menu Features... 8 PROFILE.... 10 My Profile... 10 My Favorites... 12 Watch List...
9. Wireshark I: Protocol Stack and Ethernet
 Distributed Systems 205/2016 Lab Simon Razniewski/Florian Klement 9. Wireshark I: Protocol Stack and Ethernet Objective To learn how protocols and layering are represented in packets, and to explore the
WiFi Pilot User s Manual
 WiFi Pilot User s Manual WiFi Pilot Page 1 PUBLISHED BY CACE Technologies, Inc. 1949 5 th Street, Suite 103 Davis, CA 95616 Copyright 2009 CACE Technologies, Inc. All rights reserved. No part of the contents
Akkadian Console 4.0
 Akkadian Console 4.0 User Guide Copyright and Trademarks: I. Copyright: This website and its content is copyright 2015 Akkadian Labs, LLC. All rights reserved. Except with the prior written permission
Viewing Status and Statistics
 CHAPTER 7 This chapter explains how to use ADU to view the client adapter s status and its transmit and receive statistics. The following topics are covered in this chapter: Overview of ADU and Statistics
Configuring a VAP on the WAP351, WAP131, and WAP371
 Article ID: 5072 Configuring a VAP on the WAP351, WAP131, and WAP371 Objective Virtual Access Points (VAPs) segment the wireless LAN into multiple broadcast domains that are the wireless equivalent of
The following topics describe how to use dashboards in the Firepower System:
 The following topics describe how to use dashboards in the Firepower System: About, page 1 Firepower System Dashboard Widgets, page 2 Managing, page 14 About Firepower System dashboards provide you with
Frequency tables Create a new Frequency Table
 Frequency tables Create a new Frequency Table Contents FREQUENCY TABLES CREATE A NEW FREQUENCY TABLE... 1 Results Table... 2 Calculate Descriptive Statistics for Frequency Tables... 6 Transfer Results
Wireless LAN Adapter
 ANSEL Wireless LAN Adapter 2302-wl360r User s Guide Version 1.1 08/04/2003 User s Guide 0 Copyright statement No part of this publication may be reproduced, stored in a retrieval system, or transmitted
Keynote Basics Website:
 Keynote Basics Website: http://etc.usf.edu/te/ Keynote is Apple's presentation application. Keynote is installed as part of the iwork suite, which also includes the word processing program Pages. If you
Troubleshooting WLANs (Part 1)
") SharkFest 17 Europe Troubleshooting WLANs (Part 1) Layer 1 & 2 Analysis Using AirPcap, Wi-Spy & Other Tools 8. November 2017 Rolf Leutert Leutert NetServices Switzerland www.netsniffing.ch #sf17eu Estoril,
SharkFest 17 Europe Troubleshooting WLANs (Part 1) Layer 1 & 2 Analysis Using AirPcap, Wi-Spy & Other Tools 8. November 2017 Rolf Leutert Leutert NetServices Switzerland www.netsniffing.ch #sf17eu Estoril,
Objectives: (1) To learn to capture and analyze packets using wireshark. (2) To learn how protocols and layering are represented in packets.
 To learn to capture and analyze packets using wireshark. (2) To learn how protocols and layering are represented in packets.") Team Project 1 Due: Beijing 00:01, Friday Nov 7 Language: English Turn-in (via email) a.pdf file. Objectives: (1) To learn to capture and analyze packets using wireshark. (2) To learn how protocols and
Team Project 1 Due: Beijing 00:01, Friday Nov 7 Language: English Turn-in (via email) a.pdf file. Objectives: (1) To learn to capture and analyze packets using wireshark. (2) To learn how protocols and
This tutorial shows how to use ACE to Identify the true causes of poor response time Document the problems that are found
 FTP Application Overview This tutorial shows how to use ACE to Identify the true causes of poor response time Document the problems that are found The screen images in this tutorial were captured while
Switching to Sheets from Microsoft Excel Learning Center gsuite.google.com/learning-center
 Switching to Sheets from Microsoft Excel 2010 Learning Center gsuite.google.com/learning-center Welcome to Sheets Now that you've switched from Microsoft Excel to G Suite, learn how to use Google Sheets
Version /20/2012. User Manual. AP Manager II Lite Business Class Networking
 Version 1.0 12/20/2012 User Manual AP Manager II Lite Business Class Networking Table of Contents Table of Contents Product Overview... 1 Minimum System Requirements... 2 Access Point Requirements... 2
Section 4 Cracking Encryption and Authentication
 Section 4 Cracking 802.11 Encryption and Authentication In the previous section we showed the vulnerabilities of Open Wireless LANs. In this section we ll show some of the techniques and tools used to
Using Tables, Sparklines and Conditional Formatting. Module 5. Adobe Captivate Wednesday, May 11, 2016
 Slide 1 - Using Tables, Sparklines and Conditional Formatting Using Tables, Sparklines and Conditional Formatting Module 5 Page 1 of 27 Slide 2 - Lesson Objectives Lesson Objectives Explore the find and
WiFi Advisor Wireless LAN Analyzer Quick Start Guide. October 2015 Revision OCT-2015 Technical Assistance: GO VIAVI /
 WiFi Advisor Wireless LAN Analyzer Quick Start Guide October 2015 OCT-2015 Technical Assistance: 1.844.GO VIAVI / 1.844.468.4284 1 Contents 1. WiFi Advisor Wireless LAN Analyzer Overview... 4 2. The WFED-300AC
Web Console Setup & User Guide. Version 7.1
 Web Console Setup & User Guide Version 7.1 1 Contents Page Number Chapter 1 - Installation and Access 3 Server Setup Client Setup Windows Client Setup Mac Client Setup Linux Client Setup Interoperation
Riverbed AirPcap software AirPcapReplay
 Riverbed AirPcap software AirPcapReplay 1. Introduction The purpose of this application is to replay 802.11 network traffic, whether it is contained in a trace file or simply a single packet. In addition
Context Aware Planning and Verification
 7 CHAPTER This chapter describes a number of tools and configurations that can be used to enhance the location accuracy of elements (clients, tags, rogue clients, and rogue access points) within an indoor
Visualize the Network Topology
 Network Topology Overview, page 1 Datacenter Topology, page 3 View Detailed Tables of Alarms and Links in a Network Topology Map, page 3 Determine What is Displayed in the Topology Map, page 4 Get More
Table of Contents Lesson 1: Introduction to the New Interface... 2 Lesson 2: Prepare to Work with Office
 Table of Contents Lesson 1: Introduction to the New Interface... 2 Exercise 1: The New Elements... 3 Exercise 2: Use the Office Button and Quick Access Toolbar... 4 The Office Button... 4 The Quick Access
RITIS Training Module 10 Script. To return to the Florida Analytics main page, select Florida Analytics Tools in the upper left corner of the page.
 RITIS Training Module 10 Script Welcome to the Regional Integrated Transportation Information System or RITIS Module 10 CBT. To begin, select the start button or press Shift+N on your keyboard. To return
Table of Contents. Chapter1 About g Wireless LAN USB Adapter...1
 Table of Contents Chapter1 About 802.11g Wireless LAN USB Adapter...1 1-1 Features and Benefits... 1 1-2 Applications... 2 1-3 Product Kit... 3 1-4 About IEEE 802.11g Wireless LAN USB Adapter LED Indicators...
Quick & Simple Imaging. User Guide
 Quick & Simple Imaging User Guide The Quick & Simple Imaging software package provides the user with a quick and simple way to search and find their documents, then view, print, add notes, or even e- mail
Lab Viewing Wireless and Wired NIC Information
 Objectives Part 1: Identify and Work with PC NICs Part 2: Identify and Use the System Tray Network Icons Background / Scenario This lab requires you to determine the availability and status of the network
PHOTOSHOP WORKSPACE. Interface Overview. Menus. The Tools. Palettes. Presets and Preferences PHOTOSHOP WORKSPACE UNIVERSAL TASKS PHOTO AND VIDEO TASKS
 12/30/03 2:19 PM Page 1 CHAPTER 1 Interface Overview 3 AL Menus RI 13 27 CHAPTER 4 59 ED Palettes CHAPTER 5 87 PRINT TASKS PY R IG HT Presets and Preferences PHOTO AND VIDEO TASKS MA TE CHAPTER 3 The Tools
User Guide. Web Intelligence Rich Client. Business Objects 4.1
 User Guide Web Intelligence Rich Client Business Objects 4.1 2 P a g e Web Intelligence 4.1 User Guide Web Intelligence 4.1 User Guide Contents Getting Started in Web Intelligence 4.1... 5 Log into EDDIE...
COPYRIGHTED MATERIAL PHOTOSHOP WORKSPACE. Interface Overview 3. Menus 15. The Toolbox 29. Palettes 61. Presets and Preferences 83 WEB TASKS
 PHOTOSHOP WORKSPACE CHAPTER 1 Interface Overview 3 CHAPTER 2 Menus 15 CHAPTER 3 The Toolbox 29 CHAPTER 4 Palettes 61 CHAPTER 5 Presets and Preferences 83 COPYRIGHTED MATERIAL PHOTOSHOP WORK SPACE UNIVERSAL
SlickEdit Gadgets. SlickEdit Gadgets
 SlickEdit Gadgets As a programmer, one of the best feelings in the world is writing something that makes you want to call your programming buddies over and say, This is cool! Check this out. Sometimes
WisCloud Access Controller V /6/9
 WISNETWORKS User Manual WisCloud Access Controller V 2.0 2017/6/9 Software Version 3.05.20 Table of contents WISNETWORKS... 1 Chapter 1 Overview... 3 1.1 Access Point...3 1.2 Online Use... 3 1.3 Interferences...3
Running Reports. Use the table of contents hyperlinks to navigate within the module. 1 Archibus Space Management System Training
 Running Reports Navigation of Reports Using Filter Consoles Sorting Data Smart Searches Selecting Values Index Panel Select Fields Working with Panel Bars More Records than can be displayed Exporting Reports
54Mbps g Wireless LAN. CardBus PC Card. user manual
 54Mbps 802.11g Wireless LAN CardBus PC Card user manual TABLE OF CONTENTS CHAPTER 1 ABOUT WIRELESS LAN PC CARD -------------------------------------------------1 1-1 Features and Benefits---------------------------------------------------------------------------------
Contacting Savvius. Mailing Address Savvius, Inc Treat Blvd., Suite 500 Walnut Creek, CA 94597
 Copyright 2016, Savvius, Inc. All rights reserved. Information in this document is subject to change without notice. No part of this document may be reproduced or transmitted in any form, or by any means,
Desktop Studio: Charts
 Desktop Studio: Charts Intellicus Enterprise Reporting and BI Platform Intellicus Technologies info@intellicus.com www.intellicus.com Working with Charts i Copyright 2011 Intellicus Technologies This document
A+ Guide to Managing & Maintaining Your PC, 8th Edition. Chapter 3 Introducing Windows Operating Systems
 Chapter 3 Introducing Windows Operating Systems Objectives Learn how to use Windows to interface with users, files and folders, applications, and hardware Learn about some Windows tools that you can use
RedLink Publisher Dashboard Overview January 2018
 Contents I. Publisher Dashboard Overview 2 II. Some Testimonials 2 III. The Publisher Dashboard Homepage 3 A. Purpose 3 B. Summary overview reports 4 IV. Navigation 6 V. Organization 6 A. Search 7 B. Business
Monitoring Dashboard. Figure 1: Monitoring Dashboard
 , on page 1 Network Summary, on page 4 Rogues, on page 5 Interferers, on page 5 Wireless Dashboard, on page 5 Best Practices, on page 6 Cisco Wireless Controller can be accessed using two modes Command
SharkFest 18 Europe. Troubleshooting WLANs (Part 1) Layer 1 & 2 Analysis Using Wireshark, Wi-Spy & Other Tools. Rolf Leutert
 Layer 1 & 2 Analysis Using Wireshark, Wi-Spy & Other Tools. Rolf Leutert") SharkFest 18 Europe Troubleshooting WLANs (Part 1) Layer 1 & 2 Analysis Using Wireshark, Wi-Spy & Other Tools Rolf Leutert Leutert NetServices Switzerland www.netsniffing.ch Introduction 2 Rolf Leutert,
SharkFest 18 Europe Troubleshooting WLANs (Part 1) Layer 1 & 2 Analysis Using Wireshark, Wi-Spy & Other Tools Rolf Leutert Leutert NetServices Switzerland www.netsniffing.ch Introduction 2 Rolf Leutert,
MCS 2 USB Software for OSX
 for OSX JLCooper makes no warranties, express or implied, regarding this software s fitness for a particular purpose, and in no event shall JLCooper Electronics be liable for incidental or consequential
Lab Using Wireshark to Examine Ethernet Frames
 Topology Objectives Part 1: Examine the Header Fields in an Ethernet II Frame Part 2: Use Wireshark to Capture and Analyze Ethernet Frames Background / Scenario When upper layer protocols communicate with
TRAINING GUIDE. Advanced Crystal 1
 TRAINING GUIDE Advanced Crystal 1 Using Crystal Reports with Lucity Advanced Examples 1 The fifth of a seven-part series, this workbook is designed for Crystal Reports users with some experience, who wish
BLUEPRINT READER 2010 INSTALLATION & USER GUIDE 09OCT09
 BLUEPRINT READER 2010 INSTALLATION & USER GUIDE 09OCT09 The information in this document is subject to change without notice and should not be construed as a commitment by Blueprint Software Systems Inc.
Table of Contents 1 WLAN Service Configuration 1-1
 Table of Contents 1 WLAN Service Configuration 1-1 WLAN Service Overview 1-1 Terminology 1-1 Wireless Client Access 1-2 802.11 Overview 1-4 WLAN Topologies 1-5 Single BSS 1-5 Multi-ESS 1-5 Single ESS Multiple
Manually Enable Wireless Windows 7 Network Connections Not Showing Up
 Manually Enable Wireless Windows 7 Network Connections Not Showing Up Wireless Network Connection Enabled but Not connected Fix Windows 7 repair. This article explains how to manually set up your Windows
TRAINING GUIDE. Advanced Crystal 1
 TRAINING GUIDE Advanced Crystal 1 Using Crystal Reports with Lucity Advanced Examples 1 The fifth of a seven-part series, this workbook is designed for Crystal Reports users with some experience, who wish
WhatsUp Gold v16.0 Wireless User Guide
 WhatsUp Gold v16.0 Wireless User Guide Contents Welcome to WhatsUp Gold Wireless Wireless Overview... 1 Wireless licensing and accessibility... 3 Using WhatsUp Gold Wireless Discovering wireless devices...
Using Diagnostic Tools
 Using Diagnostic Tools The Tools System Diagnostics page on the INVESTIGATE view provides several diagnostic tools that help troubleshoot various kinds of network problems and process monitors. Tech Support
Topaz Workbench Data Visualizer User Guide
 Topaz Workbench Data Visualizer User Guide Table of Contents Displaying Properties... 1 Entering Java Regular Expressions in Filter Fields... 3 Related Topics... 3 Exporting the Extract Trace Events View...
The Document Viewer (DV) provides a document s original format, including images, tables and graphs, within the Similarity Report.
 provides a document s original format, including images, tables and graphs, within the Similarity Report.") Section: Accessing the Document Viewer The Document Viewer The Document Viewer (DV) provides a document s original format, including images, tables and graphs, within the Similarity Report. Accessing the
Section: Accessing the Document Viewer The Document Viewer The Document Viewer (DV) provides a document s original format, including images, tables and graphs, within the Similarity Report. Accessing the
The Document Viewer (DV) provides a document s original format, including images, tables and graphs, within the Similarity Report.
 provides a document s original format, including images, tables and graphs, within the Similarity Report.") Section: Document Viewer Report Modes The Document Viewer The Document Viewer (DV) provides a document s original format, including images, tables and graphs, within the Similarity Report. Document Viewer
Section: Document Viewer Report Modes The Document Viewer The Document Viewer (DV) provides a document s original format, including images, tables and graphs, within the Similarity Report. Document Viewer
Desktop Studio: Charts. Version: 7.3
 Desktop Studio: Charts Version: 7.3 Copyright 2015 Intellicus Technologies This document and its content is copyrighted material of Intellicus Technologies. The content may not be copied or derived from,
3 Steps for Managing RF Interference Challenges
 WHITE PAPER 3 Steps for Managing RF Interference Challenges TABLE OF CONTENTS» Introduction» STEP ONE: Identify non-wi-fi interferers» STEP TWO: Locate non-wi-fi interferers» STEP THREE: Identify Wi-Fi
AppResponse Xpert RPM Integration Version 2 Getting Started Guide
 AppResponse Xpert RPM Integration Version 2 Getting Started Guide RPM Integration provides additional functionality to the Riverbed OPNET AppResponse Xpert real-time application performance monitoring
Gradebook Entering, Sorting, and Filtering Student Scores March 10, 2017
 Gradebook Entering, Sorting, and Filtering Student Scores March 10, 2017 1. Entering Student Scores 2. Exclude Student from Assignment 3. Missing Assignments 4. Scores by Class 5. Sorting 6. Show Filters
Navigate to Cognos Cognos Analytics supports all browsers with the exception of Microsoft Edge.
 IBM Cognos Analytics Create a List The following instructions cover how to create a list report in IBM Cognos Analytics. A list is a report type in Cognos that displays a series of data columns listing
Impress Guide Chapter 1 Introducing Impress
 Impress Guide Chapter 1 Introducing Impress This PDF is designed to be read onscreen, two pages at a time. If you want to print a copy, your PDF viewer should have an option for printing two pages on one
GRAND HD CINEMA PRO. User s Manual INDEX
 INDEX GRAND HD CINEMA PRO USB to HDMI Converter User s Manual 1. Package Contents....... 1 2. Introduction........ 1 3. System Requirement.... 1 4. Product Features...... 2 5. Hardware Overview...... 2
OneView. User s Guide
 OneView User s Guide Welcome to OneView. This user guide will show you everything you need to know to access and utilize the wealth of information available from OneView. The OneView program is an Internet-based
NetBrain POC Walk-Through
 NetBrain POC Walk-Through For OE 4.1 Dynamic Documentation Visual Troubleshooting NetBrain Technologies, Inc. 2004-2013. All rights reserved +1.800.605.7964 support@netbraintech.com www.netbraintech.com
Computer learning Center at Ewing. Course Notes - Using Picasa
 1st January 2014 Computer learning Center at Ewing Course Notes - Using Picasa These course notes describe the content of the Using Picasa course. The course notes are based on Picasa 3. This course material
SAS Mobile BI 8.1 for Windows 10: Help
 SAS Mobile BI 8.1 for Windows 10: Help Welcome Getting Started How Do I Use the App? Check out the new features. View the videos: SAS Mobile BI for Windows playlist on YouTube Use JAWS software? See the
Book 5. Chapter 1: Slides with SmartArt & Pictures... 1 Working with SmartArt Formatting Pictures Adjust Group Buttons Picture Styles Group Buttons
 Chapter 1: Slides with SmartArt & Pictures... 1 Working with SmartArt Formatting Pictures Adjust Group Buttons Picture Styles Group Buttons Chapter 2: Slides with Charts & Shapes... 12 Working with Charts