Preprint. Bovine Genome Database: Tools for Mining the Bos taurus Genome. Running Title: Bovine Genome Database
|
|
|
- Bonnie York
- 5 years ago
- Views:
Transcription
1 Preprint Hagen D.E., Unni D.R., Tayal A., Burns G.W., Elsik C.G. (2018) Bovine Genome Database: Tools for Mining the Bos taurus Genome. In: Kollmar M. (eds) Eukaryotic Genomic Databases. Methods in Molecular Biology, vol Humana Press, New York, NY ( Bovine Genome Database: Tools for Mining the Bos taurus Genome Running Title: Bovine Genome Database Darren E. Hagen 1, Deepak R. Unni 1, Aditi Tayal 1, Gregory W. Burns 1, Christine G. Elsik 1,2,3 * Affiliation: 1. Division of Animal Sciences, University of Missouri, Columbia, MO USA 2. Division of Plant Sciences, University of Missouri, Columbia, MO, USA 3. MU Informatics Institute, Univerity of Missouri, Columbia, MO, USA *Corresponding Author: Christine G. Elsik Division of Animal Sciences, Division of Plant Sciences, MU Informatics Institute University of Missouri 920 East Campus Drive Columbia, Missouri USA elsikc@missouri.edu 1
2 Abstract The Bovine Genome Database (BGD; is a web-accessible resource that supports bovine genomics research by providing genome annotation and data mining tools. BovineMine is a tool within BGD that integrates BGD data, including the genome, genes, pre-computed gene expression levels and variant consequences, with external data sources that include quantitative trait loci (QTL), orthologues, Gene Ontology, gene interactions and pathways. BovineMine enables researchers without programming skills to create custom integrated datasets for use in downstream analyses. This chapter describes how to enhance a bovine genomics project using the Bovine Genome Database, with data mining examples demonstrating BovineMine. Key words Bovine, cattle, Bos taurus, genome database, genome annotation, orthology, pathway, gene expression, single nucleotide polymorphism, data mining, InterMine, BovineMine 1. Introduction The goal of the Bovine Genome Database ( is to support the efforts of bovine genomics researchers by providing easy access to the bovine reference genome assembly and annotations of genome features via a graphical genome browser, sequence database searching, data mining, and bulk data download [1]. Data provided by BGD includes annotation data gathered from external sources as well as computed data to improve genome annotation. BGD provides tools for manual annotation, viewing multiple genome assemblies, and exploring a tissue-specific gene expression atlas for both RefSeq and Ensembl genes. In addition, BGD 2
3 hosts a data mining warehouse, BovineMine, which integrates tissue-specific gene expression levels, QTL and external sources of functional annotation, such as pathways and interactions, for fine-scale data mining and generation of custom data sets. BGD includes both the Ensembl and RefSeq gene sets, and provides database cross reference tools to seamlessly convert from one to the other. 2. Methods 2.1 Website Navigation The navigation bar of Bovine Genome Database provides access to all of the web-based informatics tools, which include data mining (BovineMine), BLAST searching, genome browsing (JBrowse), manual gene annotation (Apollo), various quick lookup tools and data download. Since the bovine reference genome has been revised several times, an Assembly History page provides information about previous and current reference genome assemblies to mitigate confusion. 2.2 BGD Lookup Tools The Lookup Tools tab in the BGD navigation bar provides access to quick lookup tools to perform chromosome or gene identifier conversion or select RNA-seq JBrowse tracks that provide expression information for specific genes (Fig.1A). These tools are actually very simple search interfaces that submit queries to BovineMine (described below) for quick lookups of single identifiers. BovineMine is recommended for more complex queries or searching a list of ids. The Lookup Tools will change depending on needs associated with specific reference 3
4 genome assemblies. For example, the current Annotation Assembly Tool, which provides locations of genes (Ensembl, RefSeq, OGSv2) on two bovine assemblies (UMD3.1 and Btau_4.6.1) will be updated upon the release of a new bovine reference genome assembly. 2.3 JBrowse, Apollo and the Faceted Track Selector Genome browsing is provided using JBrowse [2] as implemented by Apollo [3]. From a userperspective, the only differences between BGD JBrowse and BGD Apollo are the gene editing functions and the user annotation pane that are available only when logged into Apollo. The evidence tracks are identical across the browsers. All BGD users can access JBrowse, while only users registered for annotation can access Apollo. An Apollo registration link is provided in the navigation bar. An Apollo user guide and demo are available at the Apollo website ( The remainder of this section will focus on BGD specific data and browser features. BGD JBrowse includes over 300 tracks, so BGD implements a faceted track selector (Figs 1B and 1C) that is available by clicking the Select Tracks tab in the upper left corner of the browser (Fig.1D). The track selector organizes tracks into the following data types: Gene Prediction, LiftOver Gene Prediction, Genome Assembly Gaps, Alternate Assembly Alignment, Protein Homolog Alignment, Microarray Probe Alignment, Variation, QTL Region, Repeat, Combined Cufflinks, and five different RNA-seq data types. The Gene Prediction tracks are organized according to source database (e.g. RefSeq or Ensembl) and the gene type assigned by the source database (e.g. protein-coding, several non-coding gene types, pseudogenes, gene models with errors due to assembly issues). The RefSeq tracks also include gene models based on the ab initio Gnomon pipeline, and a track called ambiguous 4
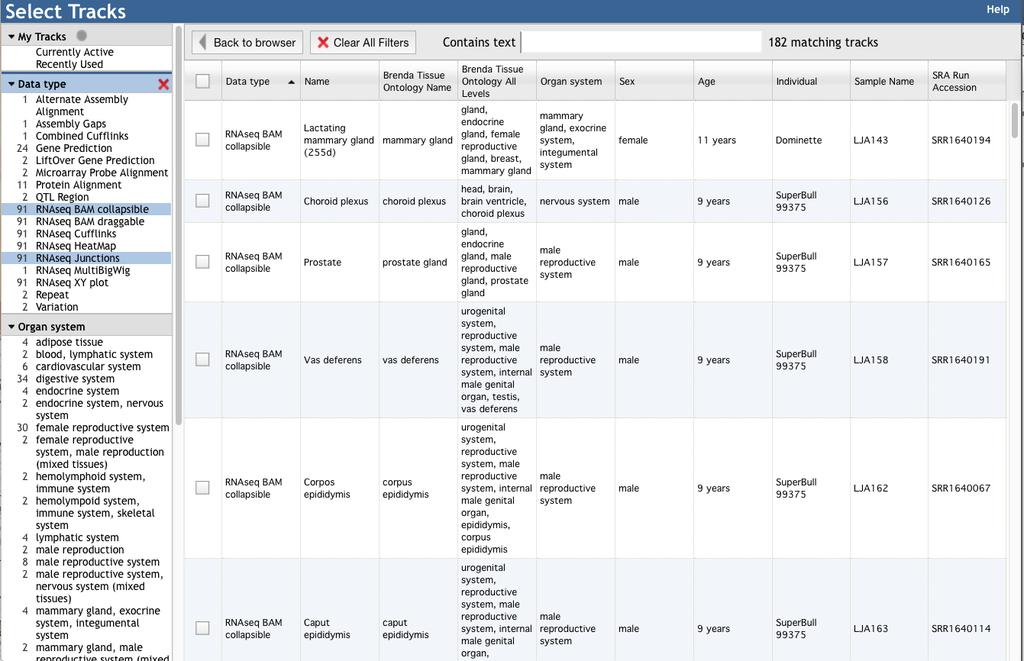
5 genes, which are gene loci that code both protein-coding and noncoding transcripts. If a particular RefSeq gene or transcript is not found in the expected track (e.g. RefSeq protein coding), you should view the ambiguous genes and frameshift genes tracks. LiftOver Gene Prediction tracks include genes that were predicted based on a previous or alternate assembly version, and are actually alignment tracks rather than gene models. Genes in the LiftOver tracks may have errors, such as missing exons, frameshifts and internal stop codons. Any gene in a LiftOver track may exist at multiple chromosome coordinates. In addition to data type categories, RNA-seq tracks are organized according to both Organ System, from the Mouse Anatomy Ontology [4] and the Uberon Anatomy Ontology [5], and Brenda Tissue Ontology [6]. After highlighting one or more data types, organ systems or tissues in the left panel, only tracks under those categories appear in the table in the right panel. Tracks can be further filtered using a text search in the Contains Text box for any information found in the table, which includes data type and track name for all tracks, Brenda Tissue Ontology Name, Brenda Tissue Ontology All Levels, Organ System, Sex, Age, Individual, Sample Name and SRA Run Accession for RNA-seq tracks. Each RNA-seq dataset is available in 6 different track configurations, which can also be filtered with the faceted track selector. The RNA-seq HeatMap and XY-Plot tracks are useful for zoomed-out views of the chromosome, to see areas with high expression levels. The other RNAseq tracks are more suitable for zoomed-in views used to compare transcript isoforms with RNAseq alignments. The Cufflinks tracks contain assembled contigs, and show up as either histograms depicting feature density when zoomed out, or gene models depicting exon/intron 5
6 structure when zoomed in sufficiently. The Junctions tracks show arcs connecting parts of spliced reads; these are useful for quickly visualizing discrepancies in exon/intron structure or split/merge gene model disagreements when viewed along with a gene prediction tracks (Fig.1D). The BAM tracks require a sufficient zoom-in level. The Collapsed BAM track is the less compute intensive of the two BAM tracks, and shows individual read alignments and spans within spliced read alignments (Fig.1D). The Draggable BAM tracks are the most compute intensive, and require the highest zoom level. This track allows annotators to drag single reads to the Apollo annotation panel, but does not provide advantages over the Collapsible BAM track when simply viewing in JBrowse. Once suitable tracks are identified, they are selected by clicking the corresponding box on the left side of the table. Clicking Back to Browser above the left side of the table hides the track selector. Within the browser, tracks can be rearranged by dragging the track label. 2.4 BLAST The BGD BLAST search interface leverages the SequenceServer platform [7]. When the search database is a genome assembly, BLAST hits are linked to JBrowse based on match coordinates. When the search database is coding sequence, transcript or peptide, BLAST hits are linked to a JBrowse location based on the hit identifier. SequenceServer also provides downloadable tabdelimited or BLAST XML reports and graphical overviews of the matches BovineMine 6
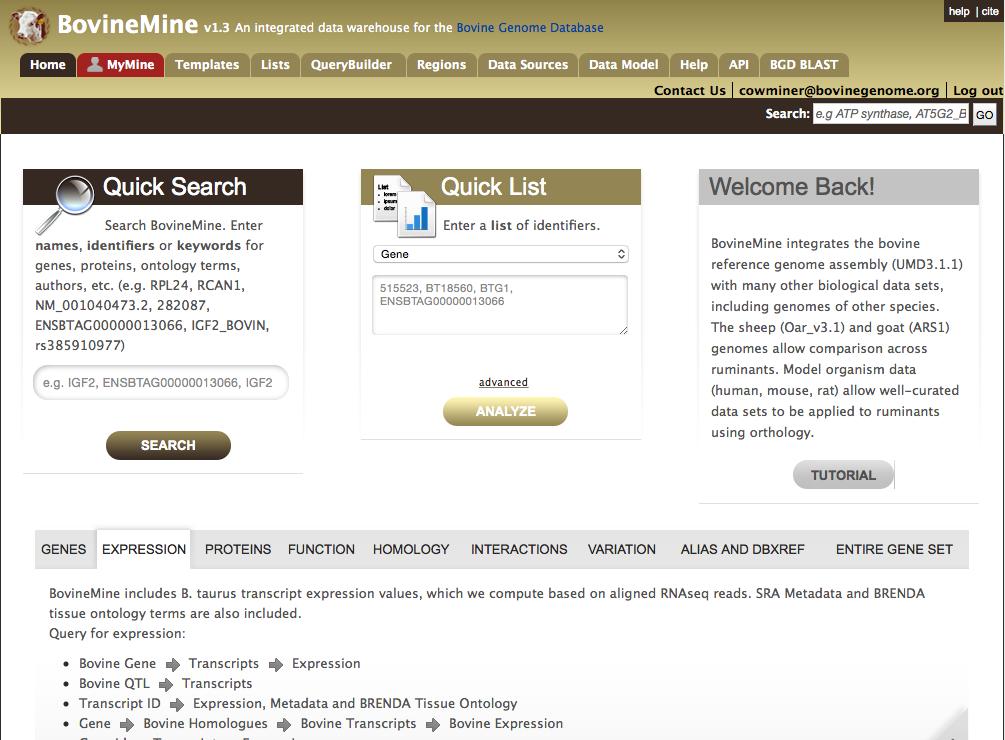
7 BovineMine is a powerful data mining tool that allows scientists with limited programming skills to exhaustively explore the bovine genome and associated biological data from a variety of external sources. BovineMine, which is accessible from the BGD navigation bar, employs the InterMine data warehousing system [8] to integrate the data and allow you to generate customized data sets. The data currently available in BovineMine include reference genome assemblies, genes, proteins, protein families and domains, orthologs and homologs, biochemical pathways, interactions, Gene Ontology annotations, cattle quantitative trait loci (QTL), variation, and publications (Table 1). BGD-specific data, including computed variant effects and RNAseq-based gene expression data, permits you to mine tissue specific gene expression levels in the context of genomic variation data. In addition to the bovine reference genome assembly, BovineMine includes the reference genome assemblies and gene sets of sheep and goat to allow researchers of non-bovine ruminants to leverage the extensive amount of available bovine genomics data BovineMine Navigation Bar and Homepage The BovineMine navigation bar is available on all BovineMine pages (Fig.2). Tabs in the navigation bar direct you to the relevant entry points for different analysis types, and also include information about the data sources (Data Sources) and a diagram depicting data integration (Data Model). The Help tab opens a new browser window with a written tutorial and short videos demonstrating BovineMine features. The Quick Search and Quick List tools on the BovineMine homepage (Fig.2) allow you to quickly search the database for a single keyword (Quick Search, more in Subheading 2.5.3) or a 7
8 list of identifiers (Quick List, more in Subheading 2.5.5). Halfway down the home page is a set of tabs that provide access to predefined template queries organized into categories (GENE, EXPRESSION, PROTEINS, FUNCTION, HOMOLOGY, INTERACTIONS, VARIATION, ALIAS AND DBXREF, ENTIRE GENE SET). The ENTIRE GENE SET category lists templates for querying entire gene sets, such as retrieving all microrna for a given organism. The ALIAS AND DBXREF category provides templates that convert identifiers between gene sets, allowing you to relate gene identifiers between the Ensembl and RefSeq gene sets. Upon the release of an updated bovine reference genome, template queries will be added to relate gene identifiers between the old and new gene sets. Subheading provides further details regarding template queries MyMine Although you may use BovineMine anonymously, creating a MyMine account provides several advantages. While logged in to MyMine, your query history is automatically saved and you can save lists, queries and template queries for use during later sessions. Your work is maintained even in the case of accidental server disconnection. You can also organize your lists with tags and share them with other MyMine users by selecting the Share with users link. You can register or log in by either choosing the Log In link in the header or by choosing the red MyMine tab in the navigation bar. Registration requires only an address to be entered in the Username area and setting a password Quick Search 8
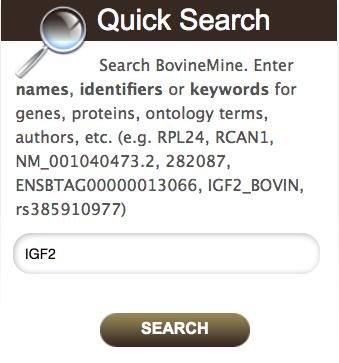
9 You can input keywords for text searching in two areas, the Quick Search box on the BovineMine homepage and the keyword search box below the navigation bar on all BovineMine pages. Since Quick Search is a full text search, you can enter any kind of identifier or text string, including the wildcard *. For example, after entering the gene symbol IGF2 into the Quick Search box and clicking Search, you will see a page summarizing the query, and over 700 results for which IGF2 is included in the text (Fig.3). You can filter results by clicking a data category or organism name within the box on the left of the page (Fig.3). Details are provided about each result, including a score indicating the similarity of your query to the result. Clicking an individual result provides the report page for that object Report Page BovineMine generates a report page with detailed information customized by data class (e.g. genes, transcripts, proteins, variants) for each data object. Every report page is a collection of tables, each of which can be sorted, filtered and exported. The gene report page is subdivided into sections including Summary, Transcripts, Protein, Function, Homology, Interactions, Publication, and Other. The Summary information includes the gene identifier, gene symbol, description, chromosomal location, strand information, and other identifiers. The Transcript section lists transcript identifiers, each of which is linked to a transcript report page that includes a table of expression values based on alignment of Illumina RNA-seq data from tissues of L1 Dominette 01449, as well as SRA metadata. The Transcript section of the Gene report includes graphical views of the transcripts; clicking a transcript graphic opens BGD JBrowse and allows you to view the transcripts in genomic context, along with other JBrowse tracks (Subheading 2.3). The Transcript section also allows you to download fasta-formatted sequences. The 9
10 Proteins section lists protein identifiers that link to Protein report pages with information such as protein family, GO annotations, InterPro domains, and curated notes from UniProt. The Function section of the Gene report provides GO annotations with evidence codes. The Homology section lists mammalian homologs List Tool The List Tool allows you to create unique datasets based on lists of identifiers. As opposed to the Quick Search function, which returns any report page containing the provided keyword, the List Tool performs a database lookup to return objects based on their primary identifiers, which include gene ids or symbols, transcript ids, and protein ids. Two list functions are available, the Quick List tool found on the BovineMine homepage and the full List Tool, available via the Lists tab in the BovineMine navigation bar. The Quick List tool is a streamlined version of the List Tool, and can be used by manually entering gene or protein identifiers separated by commas, spaces, tabs or line breaks. The advanced-function List Tool allows you to choose from among a larger array of data types, select a species, and enter a list either manually or by choosing a file to upload (Fig.4A). Clicking Lists in the navigation bar will lead you to an Upload page or the list View page. You can toggle between the two pages using Upload or View in the black bar below the BovineMine navigation bar. List analysis begins by clicking the Create List button using the main List Tool Upload page or Analyze using Quick List. BovineMine then performs a lookup and returns an intermediate page (Fig.4B) prompting you to name the list and possibly to provide further input to select from among duplicate identifiers from different data sets. Once 10
11 you click Save a list of X Genes (where X is a number), your list is saved for the duration of your session if you are not logged in, or permanently if you are logged in to MyMine. The resulting page provides your list in a table form with other relevant information (Fig.4C). The Save as List drop-down menu allows you to re-save the list if you forgot to name it before, or to select different columns in the table to save. Your saved lists can be used in BovineMine queries (Subheadings and 2.5.8). The list analysis page also contains enrichment widgets that operate on gene lists. Enrichment widgets are described further in Subheading The List View page shows user-saved lists highlighted in purple and premade BovineMine lists with a white background. The View page also includes set operation functions. Finding the difference, union or intersection between two or more saved lists leads to the creation of a new list (Fig.5). An advantage of the List Tool is that it enables you to remove redundancy in a list, or determine the source of an identifier. Identifiers submitted to the list function may include any combination of ids or symbols, and will return results as long as they are found in BovineMine and are of the selected data type. For example, (RefSeq gene id), BTG1 (gene symbol), and ENSBTAG (Ensembl gene id) each return a result when the Gene data type is selected. Thus, the List Tool allows you to perform meta-analyses of published studies without requiring you to have a priori knowledge of the data source. Entering the gene ids and symbols given above, choosing Gene and B. taurus from the respective pull-down menus, and clicking Create List returns results for these genes in cattle. A green button allowing you to Save a list of 2 Genes suggests the results need manual inspection as we submitted a list of 11
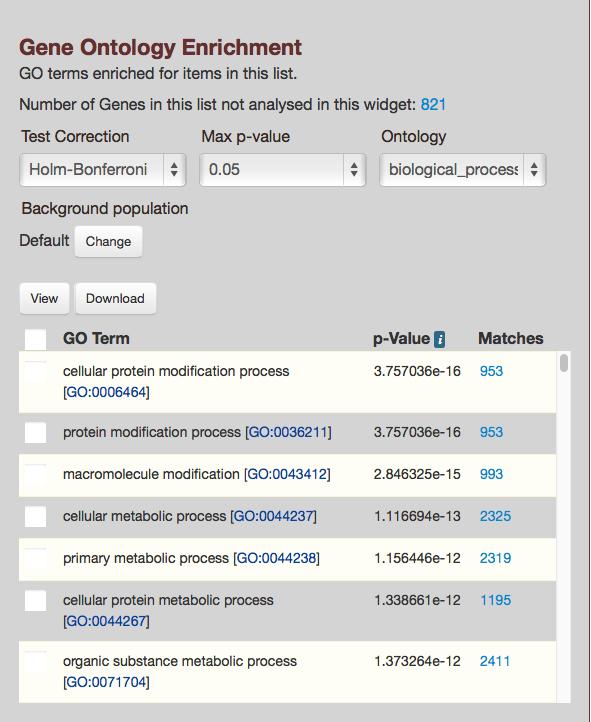
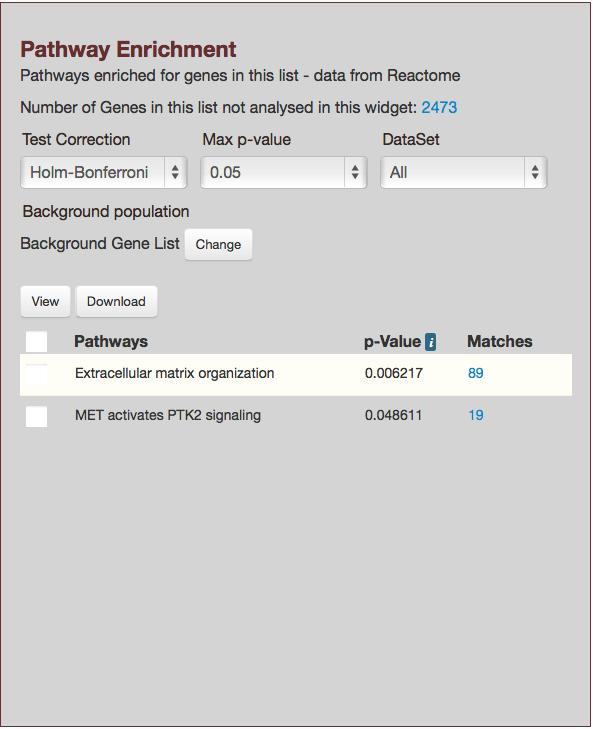
12 three genes. In this instance, the gene symbol BTG1 produced multiple records, one each for the RefSeq and Ensembl gene ids associated with BTG1, so BTG1 is not included in the count of two genes. You are asked to choose which record to include in the list by clicking the Add button to the right of the record or the Add All button in the upper right corner of the Duplicates section. After making a choice, RefSeq gene in this example, you have the option to name the list before finally saving the list by clicking Save a List of 3 Genes. This takes you to the List Analysis Page, which includes a table listing the three genes Enrichment Widgets The BovineMine List tool analyzes each list of genes for enrichment of gene ontology, pathways, and publications, and presents the data using widgets (Fig.6). Options to select test correction, p- value and background population are given for each widget. For gene enrichment analysis, the default background data set is all genes in the organism that have annotations of the type being calculated. Since BovineMine may include several gene sets for a single organism, (ex: RefSeq, Ensembl, OGS), it is recommended that you change the background population to a gene set appropriate for your subject gene list. Premade gene lists are provided for each gene set in BovineMine, and can be selected within an enrichment widget by clicking the Change button (Fig.6). The List Tool also makes it easy to create more refined background gene lists for specific questions. For example, you can create lists of all expressed genes to use as the background to test for enrichment in differentially expressed genes. Analysis of Differentially Expressed Genes Using List Enrichment Widgets: This example demonstrates use of the BovineMine List tool for enrichment analysis in a differential gene 12
13 expression study. We will use a dataset of differentially expressed genes between chorionic tissue extracted 34 days after artificial insemination (AI) and extra embryonic tissue 18 days post AI from the study reported by Biase et al. [9]. Download the file, Dataset_S01, using this link: sd01.xlsx 1. The fist step is to create a gene list that will serve as a background gene list in enrichment analysis. In this case, we will use all expressed genes. Click the List tab. Choose Gene from the Select Type pull-down menu and B. taurus from the Organism menu. 2. Select all Gene ids from column B of the spreadsheet and paste them into the List Tool text box. You might have noticed that the gene ids included ids from both Ensembl and NCBI. There is no need to separate them. It appears that Ensembl ids were the main source of ids in this study, and RefSeq ids were used when an Ensembl id did not exist for a particular gene. Click Create List. 3. In the resulting page you will notice that 10,923 out of 10,963 identifiers were found in BovineMine. The missing genes are listed at the bottom of the page. These Ensembl ids are missing because the published study used an older Ensembl gene set, and some of the genes have been removed from the newer Ensembl gene set. 4. To save your entered gene list, enter the name Background Gene List into the text box under Choose a name for the list and click the green Save a list of Genes button. An advantage of the BovineMine enrichment tool is that you were able to create the appropriate background gene list even though your data contains identifiers from different gene sets. 13
14 5. After saving the list, a new table of genes will appear. Notice that an enrichment analysis has automatically been performed and appears below the table. However, this is not the analysis you care about. This analysis compared your background list of all expressed genes to the default background list of all bovine genes in BovineMine. It is not recommended that you ever use the default background list in BovineMine, because BovineMine contains multiple gene sets, causing the default background list to be redundant. 6. The next step is to create the test gene list and perform an enrichment analysis with the List Tool. Click the List Tool tab and in the text box, paste only the gene ids found in column B from Dataset_S01 with an FDR <0.05 (rows ). And click Create List (Fig.4A). 7. Name the new list DE Gene List and click the green Save a list of 4595 Genes (Fig.4B) 8. After saving the list you are taken to the List Analysis page, with a table that can be manipulated using the column management tools (Fig.4C). 9. Further down the page you will find widgets for enrichment analysis for publications, gene ontology, and pathways as well as links to orthologs in other species. For each enrichment widget, click the Change button for Background population and select Background Gene List, which is the list you saved in step 4. The enrichment analysis will be rerun with the proper background data set (Fig.6). 14
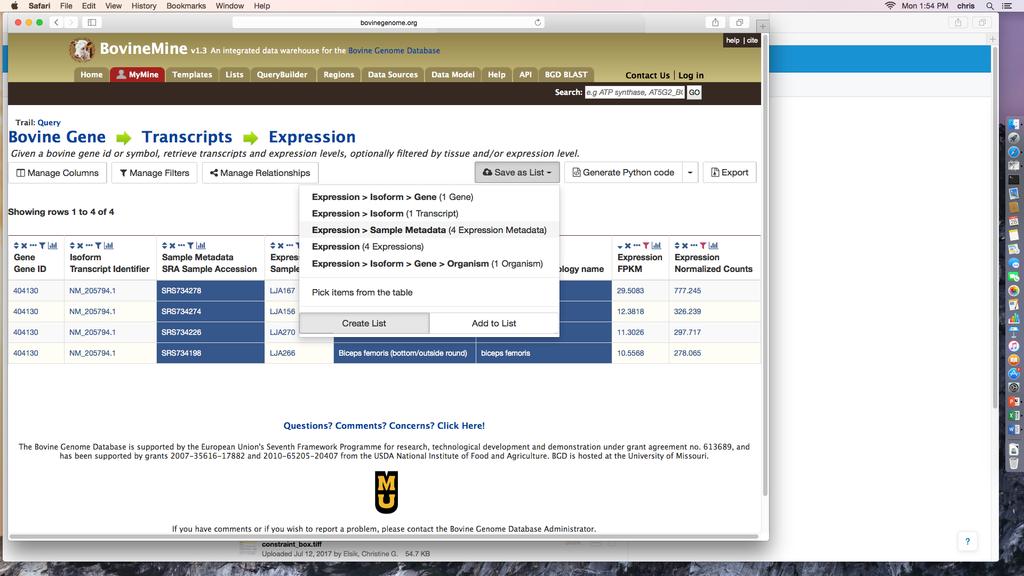
15 2.5.7 Template Queries Beyond the simple search, you can query BovineMine using predefined template queries, available by clicking either the Templates tab in the navigation bar or one of the Template category tabs in the middle of the BovineMine home page. Clicking a template query name takes you to an interface that may be pre-populated with examples and usually requires your input. For example, choosing the Bovine Gene Transcripts Expression template under the EXPRESSION category produces a web form with up to five fields for your input (Fig.7), with the Tissue field being optional. In most cases you would modify the input identifier and enter a cutoff in one of the expression level fields. You can click Show Results button to run the query or click Edit Query to go to the QueryBuilder (described in Subheading 2.5.8) to modify the query by adding or removing search constraints or selecting additional information to be included in the output. Template Query Example: Suppose you are interested in the gene Ago2, a key player of RNAidependent gene silencing. You would like to know in which tissues Ago2 is expressed, in order to make an informed decision about which tissues to focus on. Since BovineMine includes tissue levels computed on RNA-seq data of over 90 tissues from the reference genome individual, L1 Dominette 01449, you could use a simple template query to identify tissues with Ago2 expression. 15
16 1. Click the Templates tab in the toolbar at the top of the BovineMine webpage and select the template, Bovine Gene Transcripts Expression (Fig.7). 2. In the Gene field, you could enter Ago2, the NCBI gene id or the ENSEMBL gene id ENSBTAG Note that if you enter a gene symbol, you may retrieve the gene from more than one gene set. For this example, we will use the NCBI gene id Leave the tissue filter off so the results table will include information for all tissues. 4. Select >= from the pull-down menu and enter 10 in the FPKM section. 5. Click Show Results This example returns a table with four rows, each showing a tissue for which Ago2 is expressed with an FPKM of ten or greater (Fig.7). These results would allow you to focus on muscular tissue, choroid plexus, or testis for future expression studies. Furthermore, the isoform column indicates that the NCBI gene includes only one transcript isoform (NM_ ). In cases where the gene codes for multiple isoforms, each row would provide the expression data for an individual transcript isoform in that tissue QueryBuilder for Custom Queries If there is no template query to fit your needs, you can use the QueryBuilder to construct your own query. Although the QueryBuilder is not intuitive and requires experimentation to gain familiarity, mastering QueryBuilder to create an integrated data set is likely to be far more efficient than learning a scripting language such as Perl or Python. 16
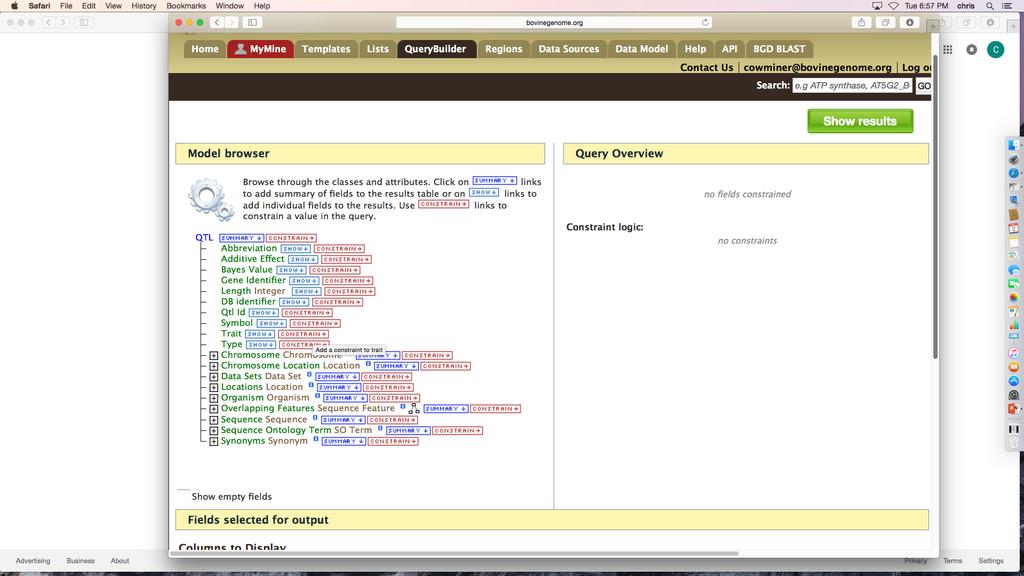
17 Before initiating query construction, you may wish to view the BovineMine data network diagram available by clicking the Data Model tab in the BovineMine navigation bar to visualize connections between data sources. In addition, the Identifier Relationship Table available on the Data Model page, and in Table 2 of this chapter, indicates which gene and protein identifiers can be used to retrieve different data sets. For example, Table 2 shows that to retrieve KEGG pathways for bovine genes, you need to input bovine RefSeq identifiers. If your dataset has Ensembl identifiers, you can use the Gene ID Database Cross Reference ID template query to convert identifiers prior to constructing your query. After choosing the QueryBuilder tab in the BovineMine navigation,bar, start building a query using the pull down menu under Select a Data Type to Begin a Query (Fig.8A). Once you select a data type, the Model Browser opens and reveals the hierarchical structure of the BovineMine data model, beginning with the data class you selected (Fig.8B). Stemming from the main data class are its attributes, subclasses and references to other data classes. A + symbol next to a data class allows you to open that part of the tree to reveal attributes and subclasses. Query construction begins by selecting either SHOW or CONSTRAIN to the right of a class or attribute. Choosing CONSTRAIN generates a pop-up box that allows you to enter an identifier for which the class will be searched (Fig.8C). When you choose CONSTRAIN at the class level, any attribute of the selected class can be used as a constraint. For example, if you select CONSTRAIN next to GENE, either a gene id or gene symbol, both listed as GENE attributes, could be used to constrain the search. If you are logged into MyMine and have already saved a list, the pop-up box provides the additional option of selecting the list to constrain multiple searches, as long as the list is composed of the appropriate data type. For example, if you choose 17
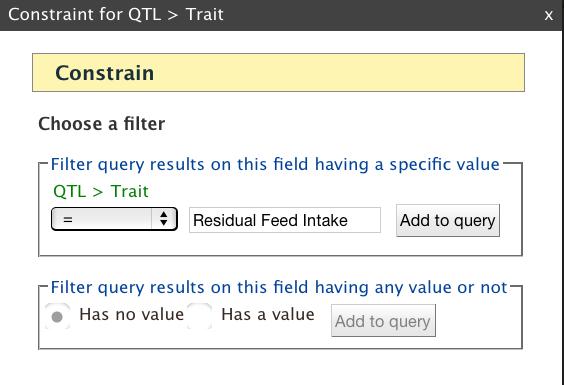
18 to construct a query by selecting the Gene data class, the list provided as a constraint must be a list of gene identifiers, not transcript or protein identifiers. Choosing SHOW next to an attribute adds the attribute as an output column. The Fields selected for output section below the Model Browser shows blue boxes that signify output columns. You can drag the boxes to modify column order, add descriptions to columns, and indicate whether a column should be sorted using the A->Z function. You can run the query by clicking Show results or you can download the XML to share the query with others. While logged into your MyMine account you can save the query as a template for reuse or additional editing. The query output table can be manipulated or filtered by using the Column Manager tools (described in Subheading ). QueryBuilder Example: Genes underlying QTL for Residual Feed Intake: BovineMine includes curated bovine QTL data from AnimalQTLdb [10], and allows you to identify QTL for a trait of interest along with genes or other genomic features underlying the QTL regions. In this example, we will retrieve RefSeq genes underlying QTL for the trait Residual Feed Intake (Fig.8). 1. Click the QueryBuilder tab in the BovineMine navigation bar. 2. In the box titled Select a Data Type to Begin a Query, use the scrolling menu and select the class QTL (Fig.8A). This action highlights QTL and enables the Select button. Now click Select. 3. You are presented with a view of the Model Browser and Query Overview (Fig.8B). The Model Browser, rooted at the QTL data class, shows the attributes of QTL and data classes that are connected to QTL. Since you would like to see data for a specific trait of interest, click CONSTRAIN next to Trait. A pop-up box appears and you can now 18
19 enter the trait Residual Feed Intake (not case sensitive) and select = from the pulldown menu (Fig.8C). Click Add to query. If you are unsure of the trait nomenclature, you can use wildcards in the constraint, for example *feed*, and later filter for the correct trait in your output table. In order to filter, you would need to show the trait in the output. After you have clicked Add to Query, notice the constraint is shown in the Query Overview. The constraint can be edited by clicking the blue pencil symbol, or removed by clicking the red X. 4. Although you constrained the query for a specific trait, you should include the trait in the output to ensure you did not make an error in entering the constraint, and to keep pertinent information together in your analysis to refer back to in the future. To do so, go back to the Model Browser, and click SHOW next to Trait under QTL. Notice in the Query Overview the word Trait is now shown in a blue box to signify it will be included in the output. 5. We would like the output table to show the AnimalQTLdb QTL identifier. To do so, click SHOW next to the attribute Qtl Id under QTL in the Model Browser 6. The next step is to constrain the organism. The Model Browser shows that the Organism class is connected to QTL. Click the + next to Organism to expand its list of attributes. Click CONSTRAIN next to the Name attribute. You will again see a pop-up box with drop-down menu options. Select = and Bos taurus from their respective menus. Click Add to query. Notice that several more lines related to Organism have been added in the Query Overview, and these are indented to indicate that the Organism is an attribute of QTL. The blue box symbol next to the word Organism indicates that your query is joining data collections to each other (the QTL collection and 19
20 the Organism collection). Clicking this symbol allows you to indicate whether a relationship is required or optional, with the default being required. 7. The next few steps are to output identifiers of genes within the QTL regions. 8. Scroll down in the Model Browser, and expand the attributes of the Overlapping Features class. Click SHOW next to DB identifier. This will create a column in the output table listing identifiers of any genome features (e.g. genes, transcripts, exons) with chromosomal coordinates that overlap the QTL region coordinates. 9. Next you will limit the list of feature identifiers to the RefSeq gene set. Click CONSTRAIN next to the Source attribute under Overlapping Features. Within the pop-up box, select = and RefSeq from the pull-down menus. Add this filter to the query by clicking Add to query. 10. The next step is to further limit the list of identifiers to only genes using a Sequence Ontology term. The Sequence Ontology [11] is a standard controlled vocabulary used to describe components of genomes and genomic data. Click the + to expand Sequence Ontology Term under Overlapping Features, making sure that you stay within the correct subtree by following the vertical line that descends from Overlapping Features. If you are not careful, you could erroneously select the Sequence Ontology Term collection that descends directly from QTL. Click CONSTRAIN next to Name under the correct Sequence Ontology Term collection. From the pull-down menu of the popup box, select gene and Add to query. At this point, query construction is complete. Looking at the Query Overview, notice that your query will output three columns: QTL id, QTL Trait and Sequence Feature DB identifier 20
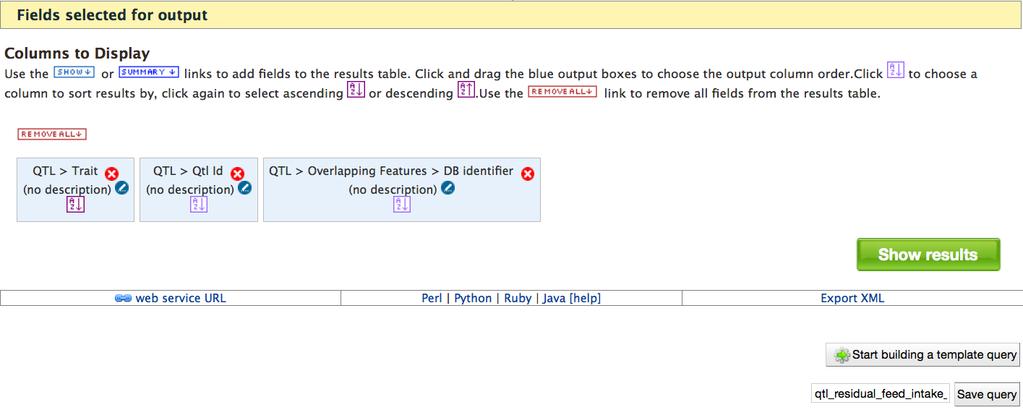
21 (Fig.8D). Your query has four constraints: QTL Trait=Residual Feed Intake, Organism Name=Bos taurus, Overlapping Features Source=RefSeq, Sequence Ontology Term Name=Gene. Notice that the query joins three data collections: QTL, Organism and Overlapping Features. Also notice, the title of each data collection includes one or more words shown in brown font. If you click a word shown in brown, the Model Browser window will automatically adjust to show the corresponding data collection in the tree (Fig.9). This is convenient way to navigate to the correct region of the tree to select more attributes for a data collection. Below the Model Browser the Columns to Display section shows the columns to be included in the output (Fig.8E). The output column order is not necessarily the same as shown in the Query Overview, but the order in which you added the column during query construction. You can drag the boxes to reorder the columns. With symbols in the blue boxes, you can eliminate columns, indicate that the output should be sorted based on a column, and add column descriptions. You have several options once query construction is complete. You can click Show results to run the query (Fig.8E). You can select Export XML and copy the XML code to share the query with other users. If you export the XML, you can use the back button of your web browser to go back to the query to run it. If you are logged into MyMine, you can save the query by entering a name in the text box and clicking Save query. The saved query can be retrieved in the Queries section under MyMine. Finally, you can click the Start building a template query which will open a very similar page with your constructed query and additional options that allow you to name and describe the template. Clicking Save template or Save and Run 21
22 will promote the query to a finalized template which can be now found under the Template tab of the BovineMine navigation bar. In the output of this example you will see the three columns, including one labeled Overlapping Features DB identifier. These identifiers are RefSeq Gene ids, because you constrained the overlapping features to be genes from the RefSeq gene set. Above the table you will see the number of rows of output. If you would like to save the genes for further analysis, you can click Save as List and then click QTL Overlapping Features. In the pop-up box, you can rename the list and then click Create List. When you saved the list of overlapping features, you might have noticed that the number of features you saved is smaller than the number of rows in your table as some of the genes were found under more than one QTL. Keep in mind, that Animal QTLdb curates QTL from the literature, and assigns unique identifiers to independently published QTL, even if they occur in the same region. Once the list is saved, you can use it with any template query that takes gene identifiers as input. Examples are Gene Gene Ontology and Gene Pathway. You can see the list via the Lists tab in the navigation bar. If necessary, click View in the black bar under the BovineMine navigation bar to toggle to the List View page. If you click on the name of the list, you will be presented with the List analysis page. For this example, you will notice the output columns are labeled as sequence features rather than genes, so gene enrichment analysis is not performed when you view the list. In order to run gene enrichment on the identifier list, use a template query, such as Gene Chromosomal Location, that is sure to output all the genes, using this sequence feature list as the identifier constraint. Running a gene-based template query will 22
23 output the identifiers as genes rather than sequence features, as you can see in the output column headers. When you save the gene ids again, you will notice the default list name starts with Gene rather than Sequence Feature, and the resulting list can be used with the List Tool for a gene list analysis, including enrichment Regions Search The Regions tab on the BovineMine navigation bar takes you to a web form that allows you to search for genomic features based on submitted chromosomal locations (chromosome ids and coordinates). The Regions search is particularly useful for bovine researchers who identify genomic variants through genome wide association studies and desire to know what genomic features exist within a specified range of the variant. Conversely, if you are interested in identifying all SNPs within a specified distance of a gene, the gene coordinates can be uploaded and the range adjusted to a desired distance. The results page provides all the features that overlap each region queried by the Regions search. The overlapped features can be exported in csv, tab delimited, gff3, or fasta file formats. Additionally, a new list can be created with the overlapped features by choosing a feature type for the Create list by feature type option. The second example in Subheading utilizes the Regions search tool Column Management The output tables of each query, list, or region search may be altered using the available tools. The top of each column header has a series of icons that may be used to sort the contents of the column, delete the column, hide the column from view, filter based on column contents, or summarize the results of the column. These functions can also be achieved using the Manage 23
24 Columns or Manage Filters buttons near the top of the page. The Manage Columns button allows you to remove entire columns, add columns, and prioritize sort order. After choosing the Manage Columns button, a pop-up window appears with a list of the columns currently available in the output table. Columns can be removed by clicking the red button to the right of a given column. Clicking the green Add columns button in the upper right portion of the pop-up window reveals a hierarchical data model browser similar to the one found in QueryBuilder. You can add new columns by selecting additional fields. The green button will now state Add X new columns, with X being the number of new fields chosen. The changes are finalized by clicking the blue Apply Changes button at the bottom. Columns can be filtered based on content by choosing the filter icon after the new column is added to the output table. All active filters can be edited or removed by clicking Manage Filters. The second example in Subheading utilizes column management tools Two Step-by-Step Examples of Meta-Analysis using BovineMine The Lists and Regions Search Tools are particularly useful for meta-analyses. An example is the meta-analysis of SNPs associated with fertility traits reported by Ortega et al. [12], in which SNPs common across different studies were identified. The comparison was relatively straightforward because the different studies used the same SNP assay. Sometimes the overlap of exact SNP identifiers or coordinates between studies does not occur due to differences in assays between studies. Another approach is to ask whether a SNP identified in one study is located within the vicinity of a SNP identified in another study. We will provide two examples of SNP 24
25 meta-analyses. In the first example, we will identify identical SNPs across studies. In the second example, we will identify SNPs from one study located within 20kb of SNPs from another study. GWAS Meta-analysis Example 1: Say you have identified a set of SNPs using the Bovine Illumina HD array, and would like to see how these SNPs align with the SNPs associated with the trait Number of Services per Conception (NSC) from Ortega et al. [12]. A challenge is that you would like to compare identifiers from the Bovine Illumina HD array with dbsnp rs identifiers from the publication. 1. The first step is to create a list using your study SNP ids. a. Click the Lists tab in the BovineMine navigation bar. b. Choose SNP from the Select Type pull-down menu and B. taurus from the for Organism menu. c. The list of identifiers in Table 3, from the Bovine Illumina HD chip, is a simulated dataset created for this example. Paste these ids into the Lists Tool text box. After pasting identifiers from a PDF file, you should ensure that each row is on its own line and there are no extra whitespaces. Sometimes you may find that converting a PDF to a Word document may help to format information from tables. d. Click Create List. e. In the resulting webpage, save the list with the name Study SNP List in the text box and click the green Save a list of 16 SNPs button. You are taken to the 25
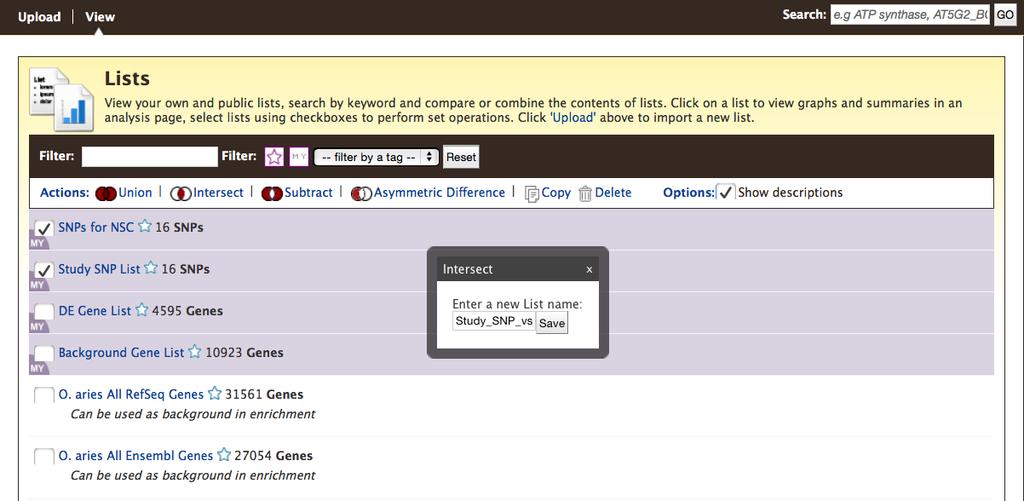
26 page showing the list you created. Notice the SNP chip identifiers have been replaced with dbsnp rs ids. 2. The next step is to create a list of SNPs associated with the trait Number of Services Per Conception from the Ortega et [12] publication. a. If possible, access the web page for that publication ( Scroll down to Table 3 in the article, and download the table as a comma separated value (csv) file. If you change the file extension to.txt, you will be able to open it in Excel. (See the next step if you cannot access the publication). b. Paste the SNP identifiers from column 1 of the Ortega et al. [1] Table 3 into the text box. The SNP ids are provided in Table 4 of this chapter in case you cannot access that publication. c. Click Create List. d. After database lookup, the result indicates that one of the SNP ids is found in more than one BovineMine dataset. Select either of those as the allele does not matter, and click Add so it will be included in your final list. Provide a name for the list such as SNPs for NSC and click Save a list of 16 SNPs. 3. The last step of this example is to perform a List intersection. If you have navigated away from the previous page, click Lists in the BovineMine navigation bar to get back to the List tool. If you are presented with the Upload page rather than a page showing your lists, click View in the black bar below the BovineMine navigation bar. You will see both Study SNP List and SNPs for NSC (Fig.5). Any list that you have created is highlighted in purple, with MY in the left corner. Check the box next to each list. Click 26
27 Intersect in the Action bar above the list, and enter a new name, such as Study_SNP_vs_SNPs_for_NSC (Fig.5). The intersection shows that three of your study SNPs were also identified by the Ortega et al. [12] study. Click the name of the list to see the SNPs. GWAS Meta-analysis Example 2: Looking for exact matching SNPs between studies might have been too stringent since your population and assay were different from those used in the Ortega et al. [12] study. You would now like to see whether any of your SNPs are located within 20kb of the SNPs identified in the previous study. 1. Since you have already created SNP lists, the next step is to create a list of regions for the SNPs for NSC identifiers to use in the Regions Search tool. a. If you are not already viewing your lists, click Lists in the BovineMine navigation bar, and if necessary, click View in the black bar below the navigation bar. b. Click the name of the list SNPs for NSC. c. Click Manage Columns above the table (Fig.10A). d. In the pop-up menu, remove the unneeded Reference Allele and Alternate Allele columns by clicking the red circles (Fig.10B). e. Click the green +Add a Column box (Fig.10B). f. Click the + sign next to Chromosome Location. Then click Start and End. Although the SNP is a single coordinate, the Region Search tool requires a Start and End coordinate (Fig.10C). 27
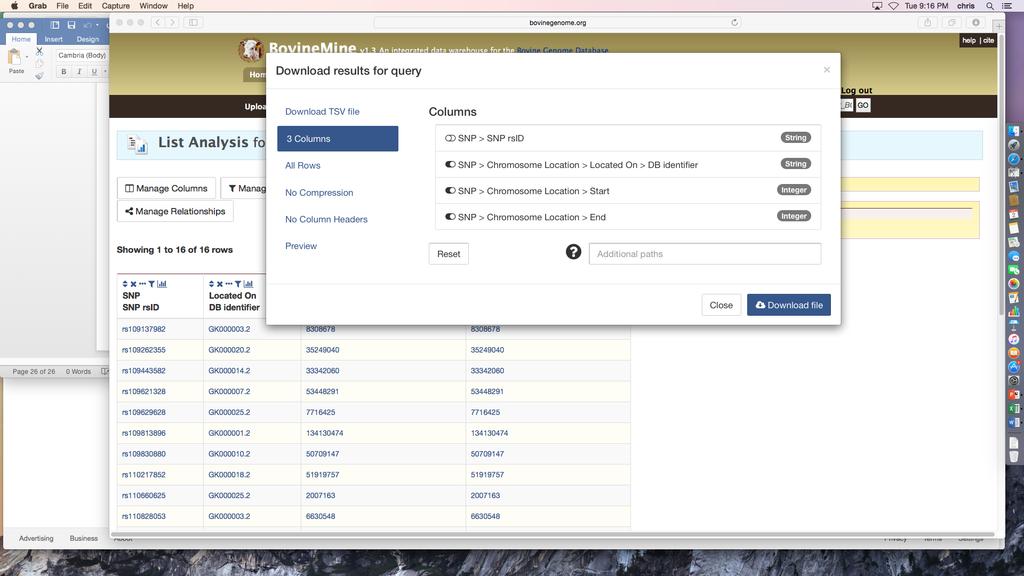
28 g. To retrieve the chromosome id, click the + sign next to Located On, and then click DB identifier (Fig.10C). h. Click the green Add 3 Columns box (Fig.10C). i. Notice columns have been added to the column list. However, the order needs to be modified to correctly format the location information for the Regions Search. Use the up arrow to move Located On >> DB identifier above Chromosome Location >> Start. Then click the blue Apply Changes box (Fig.10D). j. The next step is to export the coordinates so they can be uploaded to the regions search. Click the Export button above the table (Fig.10E). k. Enter a file name. Then mouse over All Columns to change that default setting so that only selected columns are exported. Click the toggle next to SNP > SNP rsid so that it will not be included in the output, since the Regions Search tool does not accept identifiers (Fig.10F). l. Click Download File and save the file on your computer. 2. The next steps are to perform a Regions Search for all known SNPs within 20kb of your coordinates. Click the Regions tab in the BovineMine navigation bar. a. In the Regions Search menu (Fig.11) select B. taurus from the 1. Select Organism pull-down menu. b. Click the square next to 2. Select Feature Types to uncheck all options and then click the box next to SNP as the chosen feature option. c. Upload the file you just saved. d. Type 20kb into the text box of 4. Extend your regions at both sides. e. Click Search to run the Regions Search tool. 28
29 3. After the Region Search is successfully run you are presented with an output page listing each of the regions and the numbers of SNPs identified within the regions (Fig.11). At this point you could download any results for any region separately, with a choice of formats, or you could create a SNP list for each region separately. For this example, we want to save a list of all the SNPs, so use the Create List by feature type button above the output after selecting SNP in the pull-down menu and click Go. This action creates a new list that is visible on the List View page. You are not given the opportunity to provide a name for the list; it is assigned a default name that starts with all_regions_snp_list. If you are logged into MyMine, you can change the name by clicking the MyMine tab, selecting Lists in the red tool bar, and clicking the pencil symbol next to the list name to edit it. 4. The next step is to perform a List intersection to identify SNPs from your study that are also found in the list of all SNPs that are within 20kb of SNPs identified by Ortega et al. [12]. Go to the List View page by clicking View in the black bar below the BovineMine navigation bar. Check the box next to each list. Click Intersect in the Action bar above the list, and enter a new name, such as Study_SNP_vs_SNPs_within 20kb_SNPS_for_NSC_intersection. The intersection shows that nine of your study SNPs are located within 20kb of the SNPs identified by the Ortega et al. [12] study. The two examples above provide us with very limited information. You can use the lists in a variety of ways to acquire more information. For example, you can use column management functions to determine whether these SNPs are located within genes. 29
30 1. If you are not already on a List Analysis page showing your list, click on the List name on the List View page. 2. Click Manage Columns above the List Analysis table. 3. Click the green +Add a Column button. 4. Add the following columns: a. Scroll down, open Overlapping Features and select both DB identifier and Source b. Scroll down further, open Sequence Ontology Term and select Name, being sure that you selected the Sequence Ontology Term within Overlapping Features. 5. Click the green Add 3 new columns button. 6. Click Apply changes. 7. You can see the new columns added to the output table (Fig.12). You can see in the Sequence Ontology Term column that there are several feature types. To get only genes, click the histogram icon in the column header, check gene, and select Restrict table to matching rows in the blue Filter pull down menu (Fig.12). 8. Now only rows with genes are shown. The Overlapping Features Source column indicates the genes are from three gene sets. 9. To limit the output to RefSeq genes filter the column using the histogram icon in the Overlapping Features Source column, similar to step Save this list of overlapping features using the Save as List pull-down menu, naming the list RefSeq Genes Overlapping SNPs. You will notice that you will save 7 30
31 Sequence Features even though you have 8 rows in the table, due to one gene (515321) overlapping two SNPs. 11. Since the list consists of gene ids, you can use it in any template query that accepts gene ids as input. Go to the BovineMine Home page and locate the Gene Pathways template query under the Function template category. Click the template name, and check the box next to constrain to be, make sure IN is selected, and choose the list RefSeq Genes Overlapping SNPs in the pull-down menu (Fig.13). The output shows that your genes are annotated with both Reactome and KEGG pathways. The previous examples showed you how to compare SNP lists from different studies using a combination of the List Tool and Regions Search, identify genes overlapping SNPs, and retrieve pathway information for the genes. BovineMine provides many alternatives at each of the steps. For example, rather than filtering the features overlapping SNPs for genes, you could have filtered for QTL, saved a list of QTL ids, and then used a template query to determine the traits. Another use of BovineMine related to GWAS is to identify genes in the vicinity of SNPs, along with GO terms or pathway information, in order to perform SNP-based Gene Set Enrichment Analysis (GSEA-SNP) (e.g. [13]). One could create a gene annotation data set for genes within a specified distance to all SNPs on a SNP chip by first using the List Tool to create a SNP list, followed by saving a list of SNP coordinates to be loaded into Regions search box, and then performing the Regions search with Gene selected as the feature type. In the absence of SNP ids, as may be the case in a genome resequencing project, the Regions search rather than the List Tool could be the starting point. After the gene list is saved, it can be used with the template queries to gather information about the genes. 31
32 3. Notes 3.1 BovineMine Release for this Chapter The most current release of BovineMine can be accessed from the main BGD navigation bar, or with the following URL: This chapter is based on BovineMine release 1.3, which will always be available here: You can perform the examples anonymously, but it is advisable to login to your MyMine account so that you can save your work. 3.2 Computing Expression Values and Variant Effects We trim Illumina RNA-seq reads for adaptors using Fastq-MCF ( trim for quality using DynamicTrim [14] and align reads to the bovine UMD3.1 genome assembly using TopHat2 [15]. We determine FPKM (Fragments Per Kilobase of transcript per Million mapped reads) and normalized read counts for each expression dataset for transcripts in the Ensembl and RefSeq gene sets using cuffquant and cuffnorm, which are part the Cufflinks package [16]. We use the Ensembl Variant Effect Predictor [17] to predict variant effects for the bovine gene sets. Acknowledgements The authors would like to thank Colin M. Diesh for his contributions to the development of BovineMine, BGD BLAST and BGD JBrowse/Apollo. This work was supported by funding 32
33 from the European Union's Seventh Framework Programme for research, technological development and demonstration under grant agreement no
34 References 1. Elsik CG, Unni DR, Diesh CM, Tayal A, Emery ML, Nguyen HN, Hagen DE (2016) Bovine Genome Database: new tools for gleaning function from the Bos taurus genome. Nucleic Acids Res 44 (Database issue):d doi: /nar/gkv Buels R, Yao E, Diesh CM, Hayes RD, Munoz-Torres M, Helt G, Goodstein DM, Elsik CG, Lewis SE, Stein L, Holmes IH (2016) JBrowse: a dynamic web platform for genome visualization and analysis. Genome Biol 17:66. doi: /s Lee E, Helt GA, Reese JT, Munoz-Torres MC, Childers CP, Buels RM, Stein L, Holmes IH, Elsik CG, Lewis SE (2013) Web Apollo: a web-based genomic annotation editing platform. Genome Biol 14 (8):R93. doi: /gb r93 4. Hayamizu TF, Baldock RA, Ringwald M (2015) Mouse anatomy ontologies: enhancements and tools for exploring and integrating biomedical data. Mamm Genome 26 (9-10): doi: /s Mungall CJ, Torniai C, Gkoutos GV, Lewis SE, Haendel MA (2012) Uberon, an integrative multi-species anatomy ontology. Genome Biol 13 (1):R5. doi: /gb r5 6. Gremse M, Chang A, Schomburg I, Grote A, Scheer M, Ebeling C, Schomburg D (2011) The BRENDA Tissue Ontology (BTO): the first all-integrating ontology of all organisms for enzyme sources. Nucleic Acids Res 39 (Database issue):d doi: /nar/gkq Priyam A, Woodcroft BJ, Rai V, Munagala A, Moghul I, Ter F, Gibbins MA, Moon H, Leonard G, Rumpf W, Wurm Y (2015) Sequenceserver: a modern graphical user interface for custom BLAST databases. biorxiv. doi: / Smith RN, Aleksic J, Butano D, Carr A, Contrino S, Hu F, Lyne M, Lyne R, Kalderimis A, Rutherford K, Stepan R, Sullivan J, Wakeling M, Watkins X, Micklem G (2012) InterMine: a
35 flexible data warehouse system for the integration and analysis of heterogeneous biological data. Bioinformatics 28 (23): doi: /bioinformatics/bts Biase FH, Rabel C, Guillomot M, Hue I, Andropolis K, Olmstead CA, Oliveira R, Wallace R, Le Bourhis D, Richard C, Campion E, Chaulot-Talmon A, Giraud-Delville C, Taghouti G, Jammes H, Renard JP, Sandra O, Lewin HA (2016) Massive dysregulation of genes involved in cell signaling and placental development in cloned cattle conceptus and maternal endometrium. Proc Natl Acad Sci U S A 113 (51): doi: /pnas Hu ZL, Park CA, Wu XL, Reecy JM (2013) AnimalQTLdb: an improved database tool for livestock animal QTL/association data dissemination in the post-genome era. Nucleic Acids Res 41 (Database issue):d doi: /nar/gks Eilbeck K, Lewis SE, Mungall CJ, Yandell M, Stein L, Durbin R, Ashburner M (2005) The Sequence Ontology: a tool for the unification of genome annotations. Genome Biol 6 (5):R44. doi: /gb r Ortega MS, Denicol AC, Cole JB, Null DJ, Taylor JF, Schnabel RD, Hansen PJ (2017) Association of single nucleotide polymorphisms in candidate genes previously related to genetic variation in fertility with phenotypic measurements of reproductive function in Holstein cows. J Dairy Sci. doi: /jds Neibergs HL, Settles ML, Whitlock RH, Taylor JF (2010) GSEA-SNP identifies genes associated with Johne's disease in cattle. Mammalian genome : official journal of the International Mammalian Genome Society 21 (7-8): doi: /s Cox MP, Peterson DA, Biggs PJ (2010) SolexaQA: At-a-glance quality assessment of Illumina second-generation sequencing data. BMC Bioinformatics 11:485. doi: /
36 15. Kim D, Pertea G, Trapnell C, Pimentel H, Kelley R, Salzberg SL (2013) TopHat2: accurate alignment of transcriptomes in the presence of insertions, deletions and gene fusions. Genome Biol 14 (4):R36. doi: /gb r Trapnell C, Williams BA, Pertea G, Mortazavi A, Kwan G, van Baren MJ, Salzberg SL, Wold BJ, Pachter L (2010) Transcript assembly and quantification by RNA-Seq reveals unannotated transcripts and isoform switching during cell differentiation. Nat Biotechnol 28 (5): doi: /nbt McLaren W, Pritchard B, Rios D, Chen Y, Flicek P, Cunningham F (2010) Deriving the consequences of genomic variants with the Ensembl API and SNP Effect Predictor. Bioinformatics 26 (16): doi: /bioinformatics/btq Caspi R, Billington R, Ferrer L, Foerster H, Fulcher CA, Keseler IM, Kothari A, Krummenacker M, Latendresse M, Mueller LA, Ong Q, Paley S, Subhraveti P, Weaver DS, Karp PD (2016) The MetaCyc database of metabolic pathways and enzymes and the BioCyc collection of pathway/genome databases. Nucleic Acids Res 44 (D1):D doi: /nar/gkv Chatr-Aryamontri A, Oughtred R, Boucher L, Rust J, Chang C, Kolas NK, O'Donnell L, Oster S, Theesfeld C, Sellam A, Stark C, Breitkreutz BJ, Dolinski K, Tyers M (2017) The BioGRID interaction database: 2017 update. Nucleic Acids Res 45 (D1):D369-D379. doi: /nar/gkw Zimin AV, Delcher AL, Florea L, Kelley DR, Schatz MC, Puiu D, Hanrahan F, Pertea G, Van Tassell CP, Sonstegard TS, Marcais G, Roberts M, Subramanian P, Yorke JA, Salzberg SL (2009) A whole-genome assembly of the domestic cow, Bos taurus. Genome Biol 10 (4):R42. doi: /gb r42
37 21. Bovine HapMap Consortium, Gibbs RA, Taylor JF, Van Tassell CP, Barendse W, Eversole KA, Gill CA, Green RD, Hamernik DL, Kappes SM, Lien S, Matukumalli LK, McEwan JC, Nazareth LV, Schnabel RD, Weinstock GM, Wheeler DA, Ajmone-Marsan P, Boettcher PJ, Caetano AR, Garcia JF, Hanotte O, Mariani P, Skow LC, Sonstegard TS, Williams JL, Diallo B, Hailemariam L, Martinez ML, Morris CA, Silva LO, Spelman RJ, Mulatu W, Zhao K, Abbey CA, Agaba M, Araujo FR, Bunch RJ, Burton J, Gorni C, Olivier H, Harrison BE, Luff B, Machado MA, Mwakaya J, Plastow G, Sim W, Smith T, Thomas MB, Valentini A, Williams P, Womack J, Woolliams JA, Liu Y, Qin X, Worley KC, Gao C, Jiang H, Moore SS, Ren Y, Song XZ, Bustamante CD, Hernandez RD, Muzny DM, Patil S, San Lucas A, Fu Q, Kent MP, Vega R, Matukumalli A, McWilliam S, Sclep G, Bryc K, Choi J, Gao H, Grefenstette JJ, Murdoch B, Stella A, Villa-Angulo R, Wright M, Aerts J, Jann O, Negrini R, Goddard ME, Hayes BJ, Bradley DG, Barbosa da Silva M, Lau LP, Liu GE, Lynn DJ, Panzitta F, Dodds KG (2009) Genome-wide survey of SNP variation uncovers the genetic structure of cattle breeds. Science 324 (5926): doi: /science Bovine Genome Sequencing and Analysis Consortium, Elsik CG, Tellam RL, Worley KC, Gibbs RA, Muzny DM, Weinstock GM, Adelson DL, Eichler EE, Elnitski L, Guigo R, Hamernik DL, Kappes SM, Lewin HA, Lynn DJ, Nicholas FW, Reymond A, Rijnkels M, Skow LC, Zdobnov EM, Schook L, Womack J, Alioto T, Antonarakis SE, Astashyn A, Chapple CE, Chen HC, Chrast J, Camara F, Ermolaeva O, Henrichsen CN, Hlavina W, Kapustin Y, Kiryutin B, Kitts P, Kokocinski F, Landrum M, Maglott D, Pruitt K, Sapojnikov V, Searle SM, Solovyev V, Souvorov A, Ucla C, Wyss C, Anzola JM, Gerlach D, Elhaik E, Graur D, Reese JT, Edgar RC, McEwan JC, Payne GM, Raison JM, Junier T, Kriventseva EV, Eyras E, Plass M, Donthu R, Larkin DM, Reecy J, Yang MQ, Chen L, Cheng Z, Chitko-McKown CG, Liu GE,
38 Matukumalli LK, Song J, Zhu B, Bradley DG, Brinkman FS, Lau LP, Whiteside MD, Walker A, Wheeler TT, Casey T, German JB, Lemay DG, Maqbool NJ, Molenaar AJ, Seo S, Stothard P, Baldwin CL, Baxter R, Brinkmeyer-Langford CL, Brown WC, Childers CP, Connelley T, Ellis SA, Fritz K, Glass EJ, Herzig CT, Iivanainen A, Lahmers KK, Bennett AK, Dickens CM, Gilbert JG, Hagen DE, Salih H, Aerts J, Caetano AR, Dalrymple B, Garcia JF, Gill CA, Hiendleder SG, Memili E, Spurlock D, Williams JL, Alexander L, Brownstein MJ, Guan L, Holt RA, Jones SJ, Marra MA, Moore R, Moore SS, Roberts A, Taniguchi M, Waterman RC, Chacko J, Chandrabose MM, Cree A, Dao MD, Dinh HH, Gabisi RA, Hines S, Hume J, Jhangiani SN, Joshi V, Kovar CL, Lewis LR, Liu YS, Lopez J, Morgan MB, Nguyen NB, Okwuonu GO, Ruiz SJ, Santibanez J, Wright RA, Buhay C, Ding Y, Dugan-Rocha S, Herdandez J, Holder M, Sabo A, Egan A, Goodell J, Wilczek-Boney K, Fowler GR, Hitchens ME, Lozado RJ, Moen C, Steffen D, Warren JT, Zhang J, Chiu R, Schein JE, Durbin KJ, Havlak P, Jiang H, Liu Y, Qin X, Ren Y, Shen Y, Song H, Bell SN, Davis C, Johnson AJ, Lee S, Nazareth LV, Patel BM, Pu LL, Vattathil S, Williams RL, Jr., Curry S, Hamilton C, Sodergren E, Wheeler DA, Barris W, Bennett GL, Eggen A, Green RD, Harhay GP, Hobbs M, Jann O, Keele JW, Kent MP, Lien S, McKay SD, McWilliam S, Ratnakumar A, Schnabel RD, Smith T, Snelling WM, Sonstegard TS, Stone RT, Sugimoto Y, Takasuga A, Taylor JF, Van Tassell CP, Macneil MD, Abatepaulo AR, Abbey CA, Ahola V, Almeida IG, Amadio AF, Anatriello E, Bahadue SM, Biase FH, Boldt CR, Carroll JA, Carvalho WA, Cervelatti EP, Chacko E, Chapin JE, Cheng Y, Choi J, Colley AJ, de Campos TA, De Donato M, Santos IK, de Oliveira CJ, Deobald H, Devinoy E, Donohue KE, Dovc P, Eberlein A, Fitzsimmons CJ, Franzin AM, Garcia GR, Genini S, Gladney CJ, Grant JR, Greaser ML, Green JA, Hadsell DL, Hakimov HA, Halgren R, Harrow JL, Hart EA, Hastings N, Hernandez M, Hu ZL, Ingham A, Iso-Touru T, Jamis C, Jensen K, Kapetis D, Kerr T, Khalil SS,
39 Khatib H, Kolbehdari D, Kumar CG, Kumar D, Leach R, Lee JC, Li C, Logan KM, Malinverni R, Marques E, Martin WF, Martins NF, Maruyama SR, Mazza R, McLean KL, Medrano JF, Moreno BT, More DD, Muntean CT, Nandakumar HP, Nogueira MF, Olsaker I, Pant SD, Panzitta F, Pastor RC, Poli MA, Poslusny N, Rachagani S, Ranganathan S, Razpet A, Riggs PK, Rincon G, Rodriguez-Osorio N, Rodriguez-Zas SL, Romero NE, Rosenwald A, Sando L, Schmutz SM, Shen L, Sherman L, Southey BR, Lutzow YS, Sweedler JV, Tammen I, Telugu BP, Urbanski JM, Utsunomiya YT, Verschoor CP, Waardenberg AJ, Wang Z, Ward R, Weikard R, Welsh TH, Jr., White SN, Wilming LG, Wunderlich KR, Yang J, Zhao FQ (2009) The genome sequence of taurine cattle: a window to ruminant biology and evolution. Science 324 (5926): doi: /science Sherry ST, Ward MH, Kholodov M, Baker J, Phan L, Smigielski EM, Sirotkin K (2001) dbsnp: the NCBI database of genetic variation. Nucleic Acids Res 29 (1): Lappalainen I, Lopez J, Skipper L, Hefferon T, Spalding JD, Garner J, Chen C, Maguire M, Corbett M, Zhou G, Paschall J, Ananiev V, Flicek P, Church DM (2013) DbVar and DGVa: public archives for genomic structural variation. Nucleic Acids Res 41 (Database issue):d doi: /nar/gks Vilella AJ, Severin J, Ureta-Vidal A, Heng L, Durbin R, Birney E (2009) EnsemblCompara GeneTrees: Complete, duplication-aware phylogenetic trees in vertebrates. Genome Res 19 (2): doi: /gr Aken BL, Achuthan P, Akanni W, Amode MR, Bernsdorff F, Bhai J, Billis K, Carvalho- Silva D, Cummins C, Clapham P, Gil L, Giron CG, Gordon L, Hourlier T, Hunt SE, Janacek SH, Juettemann T, Keenan S, Laird MR, Lavidas I, Maurel T, McLaren W, Moore B, Murphy DN, Nag R, Newman V, Nuhn M, Ong CK, Parker A, Patricio M, Riat HS, Sheppard D, Sparrow H,
40 Taylor K, Thormann A, Vullo A, Walts B, Wilder SP, Zadissa A, Kostadima M, Martin FJ, Muffato M, Perry E, Ruffier M, Staines DM, Trevanion SJ, Cunningham F, Yates A, Zerbino DR, Flicek P (2017) Ensembl Nucleic Acids Res 45 (D1):D635-D642. doi: /nar/gkw Bickhart DM, Rosen BD, Koren S, Sayre BL, Hastie AR, Chan S, Lee J, Lam ET, Liachko I, Sullivan ST, Burton JN, Huson HJ, Nystrom JC, Kelley CM, Hutchison JL, Zhou Y, Sun J, Crisa A, Ponce de Leon FA, Schwartz JC, Hammond JA, Waldbieser GC, Schroeder SG, Liu GE, Dunham MJ, Shendure J, Sonstegard TS, Phillippy AM, Van Tassell CP, Smith TP (2017) Single-molecule sequencing and chromatin conformation capture enable de novo reference assembly of the domestic goat genome. Nat Genet 49 (4): doi: /ng Gene Ontology Consortium (2015) Gene Ontology Consortium: going forward. Nucleic Acids Res 43 (Database issue):d doi: /nar/gku NCBI Resource Coordinators (2016) Database resources of the National Center for Biotechnology Information. Nucleic Acids Res 44 (D1):D7-19. doi: /nar/gkv Kerrien S, Aranda B, Breuza L, Bridge A, Broackes-Carter F, Chen C, Duesbury M, Dumousseau M, Feuermann M, Hinz U, Jandrasits C, Jimenez RC, Khadake J, Mahadevan U, Masson P, Pedruzzi I, Pfeiffenberger E, Porras P, Raghunath A, Roechert B, Orchard S, Hermjakob H (2012) The IntAct molecular interaction database in Nucleic Acids Res 40 (Database issue):d doi: /nar/gkr Finn RD, Attwood TK, Babbitt PC, Bateman A, Bork P, Bridge AJ, Chang HY, Dosztanyi Z, El-Gebali S, Fraser M, Gough J, Haft D, Holliday GL, Huang H, Huang X, Letunic I, Lopez R, Lu S, Marchler-Bauer A, Mi H, Mistry J, Natale DA, Necci M, Nuka G, Orengo CA, Park Y, Pesseat S, Piovesan D, Potter SC, Rawlings ND, Redaschi N, Richardson L, Rivoire C,
41 Sangrador-Vegas A, Sigrist C, Sillitoe I, Smithers B, Squizzato S, Sutton G, Thanki N, Thomas PD, Tosatto SC, Wu CH, Xenarios I, Yeh LS, Young SY, Mitchell AL (2017) InterPro in beyond protein family and domain annotations. Nucleic Acids Res 45 (D1):D190-D199. doi: /nar/gkw Kanehisa M, Furumichi M, Tanabe M, Sato Y, Morishima K (2017) KEGG: new perspectives on genomes, pathways, diseases and drugs. Nucleic Acids Res 45 (Database issue):d doi: /nar/gkw Zdobnov EM, Tegenfeldt F, Kuznetsov D, Waterhouse RM, Simao FA, Ioannidis P, Seppey M, Loetscher A, Kriventseva EV (2017) OrthoDB v9.1: cataloging evolutionary and functional annotations for animal, fungal, plant, archaeal, bacterial and viral orthologs. Nucleic Acids Res 45 (D1):D744-D749. doi: /nar/gkw NCBI Resource Coordinators (2017) Database Resources of the National Center for Biotechnology Information. Nucleic Acids Res 45 (D1):D12-D17. doi: /nar/gkw Fabregat A, Sidiropoulos K, Garapati P, Gillespie M, Hausmann K, Haw R, Jassal B, Jupe S, Korninger F, McKay S, Matthews L, May B, Milacic M, Rothfels K, Shamovsky V, Webber M, Weiser J, Williams M, Wu G, Stein L, Hermjakob H, D'Eustachio P (2016) The Reactome pathway Knowledgebase. Nucleic Acids Res 44 (D1):D doi: /nar/gkv O'Leary NA, Wright MW, Brister JR, Ciufo S, Haddad D, McVeigh R, Rajput B, Robbertse B, Smith-White B, Ako-Adjei D, Astashyn A, Badretdin A, Bao Y, Blinkova O, Brover V, Chetvernin V, Choi J, Cox E, Ermolaeva O, Farrell CM, Goldfarb T, Gupta T, Haft D, Hatcher E, Hlavina W, Joardar VS, Kodali VK, Li W, Maglott D, Masterson P, McGarvey KM, Murphy MR, O'Neill K, Pujar S, Rangwala SH, Rausch D, Riddick LD, Schoch C, Shkeda A, Storz SS, Sun H, Thibaud-Nissen F, Tolstoy I, Tully RE, Vatsan AR, Wallin C, Webb D, Wu W, Landrum
42 MJ, Kimchi A, Tatusova T, DiCuccio M, Kitts P, Murphy TD, Pruitt KD (2016) Reference sequence (RefSeq) database at NCBI: current status, taxonomic expansion, and functional annotation. Nucleic Acids Res 44 (D1):D doi: /nar/gkv Kodama Y, Shumway M, Leinonen R, International Nucleotide Sequence Database Consortium (2012) The Sequence Read Archive: explosive growth of sequencing data. Nucleic Acids Res 40 (Database issue):d doi: /nar/gkr Jiang Y, Xie M, Chen W, Talbot R, Maddox JF, Faraut T, Wu C, Muzny DM, Li Y, Zhang W, Stanton JA, Brauning R, Barris WC, Hourlier T, Aken BL, Searle SM, Adelson DL, Bian C, Cam GR, Chen Y, Cheng S, DeSilva U, Dixen K, Dong Y, Fan G, Franklin IR, Fu S, Fuentes- Utrilla P, Guan R, Highland MA, Holder ME, Huang G, Ingham AB, Jhangiani SN, Kalra D, Kovar CL, Lee SL, Liu W, Liu X, Lu C, Lv T, Mathew T, McWilliam S, Menzies M, Pan S, Robelin D, Servin B, Townley D, Wang W, Wei B, White SN, Yang X, Ye C, Yue Y, Zeng P, Zhou Q, Hansen JB, Kristiansen K, Gibbs RA, Flicek P, Warkup CC, Jones HE, Oddy VH, Nicholas FW, McEwan JC, Kijas JW, Wang J, Worley KC, Archibald AL, Cockett N, Xu X, Wang W, Dalrymple BP (2014) The sheep genome illuminates biology of the rumen and lipid metabolism. Science 344 (6188): doi: /science Nicolazzi EL, Caprera A, Nazzicari N, Cozzi P, Strozzi F, Lawley C, Pirani A, Soans C, Brew F, Jorjani H, Evans G, Simpson B, Tosser-Klopp G, Brauning R, Williams JL, Stella A (2015) SNPchiMp v.3: integrating and standardizing single nucleotide polymorphism data for livestock species. BMC Genomics 16:283. doi: /s Schreiber F, Patricio M, Muffato M, Pignatelli M, Bateman A (2014) TreeFam v9: a new website, more species and orthology-on-the-fly. Nucleic Acids Res 42 (Database issue):d doi: /nar/gkt1055
43 41. UniProt Consortium (2015) UniProt: a hub for protein information. Nucleic Acids Res 43 (Database issue):d doi: /nar/gku Huntley RP, Sawford T, Mutowo-Meullenet P, Shypitsyna A, Bonilla C, Martin MJ, O'Donovan C (2015) The GOA database: gene Ontology annotation updates for Nucleic Acids Res 43 (Database issue):d doi: /nar/gku1113 Figure Legends Figure 1. A) To assist users in selecting JBrowse tracks to visualize expression of a specific gene, BGD includes a quick lookup tool to retrieve pre-computed expression levels based on RNA-seq The tool is available via the Lookup Tool pull down menu of the BGD navigation bar. The lookup tool pulls data from BovineMine, where additional RNA-seq metadata can be retrieved. B and C) Once a tissue or sample of interest is identified, the JBrowse faceted track selector facilitates choosing RNA-seq tracks for viewing. RNA-seq tracks are categorized according to both Organ System and Brenda Tissue Ontology, and are searchable based on metadata such as sample name, SRA identifier and tissue. D) Each RNA-seq dataset is available in six different visualizations depending on the user s objective. This figure shows RNA-seq Junctions and Collapsed BAM tracks. Figure 2. The BovineMine homepage allows you to initiate analysis by using a query form for Quick Search or Quick List or by using predefined template queries organized into major data categories. Alternatively, you could select a tab in the BovineMine navigation bar for the more advanced search options available with the QueryBuilder, List Tool and Regions search.
44 Figure 3. The quick search box employs a full text search and identifies all records containing the search term. A search summary page allows you to filter by feature class and/or species. Filtered summaries can be further saved as a list by using the Create List button. Clicking the orange name of a record leads to a report page (not shown). Figure 4. A) The List Tool Upload page takes lists of identifiers as input. The correct data type must be selected. B) After a database lookup is performed, a page listing matching identifiers is provided with options to name and save the list. C) List analysis results in a table, which, like all tables in BovineMine, may be altered using icons within the column headers and using the Manage Columns, Manage Filters and Manage Relationships buttons. This figure shows the creation of the DE Gene List in example Figure 5. The List View page shows user-made lists highlighted in purple. Once a list intersection is performed, a new list appears. This figure shows the intersection performed in the first example in Subheading Figure 6. Using the List Tool with a list of gene identifiers generates enrichment widgets that include options to select test correction, p-value and background population. It is recommended that BovineMine users always select an alternative background population, since the default background population is all genes annotated with the appropriate datatype; these genes may be from more than one gene set (e.g both Ensembl and RefSeq). Alternative gene lists, including premade gene set lists and all user-saved lists, are available by clicking Change under to Background Population. This figure, showing the analysis from example 2.5.6, demonstrates
45 the difference in enrichment results after changing the background population from the default to the list of all expressed genes identified in the study [9]. Figure 7. Predefined template queries are provided for commonly used queries. The results are provided in tables, which can be altered using the icons in the column headers or the column management buttons above the table. Furthermore, you can save lists of different identifiers within the table by clicking Save as List and choosing the column of identifiers you wish to save. This figure shows the example provided in Subheading Figure 8. These figures show the steps in the QueryBuilder example in Subheading The QueryBuilder allows you to develop custom queries incorporating multiple data sources. A) From the QueryBuilder page, you can browse the data model, import queries in XML format, or view saved queries. The QueryBuilder entry page also reports your most recent query history. Query creation begins by selecting a data class and clicking select. B) The model browser allows you to create query constraints. C) When you click CONSTRAIN a pop-up menu allows you to enter information. Here the QTL output is constrained to the Trait Residual Feed Intake. D) The final Query Overview from the example shows that the query will output three columns (QTL id, QTL Trait and Sequence Feature DB identifier) and the query has four constraints: (QTL Trait=Residual Feed Intake, Organism Name=Bos taurus, Overlapping Features Source=RefSeq, Sequence Ontology Term Name=Gene). E) The output columns and their order in the final results table are illustrated by blue boxes that may be rearranged by dragging and dropping. In addition to running, a custom query can be named and saved, exported for sharing and developed into template query.
46 Figure 9. After adding each query component, the view in the Model Browser resets to the top of the tree. The Query Overview provides a trick that allows you to easily jump back to a region of the Model Browser tree to select more outputs or constraints. A) After the Sequence Feature DB Identifier was added to the query, the Model Browser view was reset. In the Query Overview, notice the words Sequence Feature in brown font. B) Clicking the word Sequence Feature in the Query Overview allows you to navigate back to the associated data collection in the Model Browser to select additional Sequence Feature attributes or constraints. Figure 10. This figure shows column management steps used in the second example described in Subheading A) Above every table are the column management buttons Manage Columns, Manage Filters and Manage Relationships. Tables can also be modified using the icons in the column headers. B) The Manage Columns menu allows you to remove existing columns and add new columns. C) If you choose to add new columns, a hierarchical data model tree is provided, allowing you to select attributes as new output columns. The attributes you select are highlighted in blue. D) After selecting attributes and clicking Apply Changes, you return to the main Manage Columns menu, where you can reorder the columns using up and down arrows. E) Clicking Apply Changes in the Manage Columns menu generates the new table. F) Clicking Export opens the Download menu. In this example, we wished to export only the SNP coordinates, not the SNP ids, so we use the toggle next to SNP > SNP id to remove it from the list of columns to be output in the tsv file.
47 Figure 11. The Regions search upload menu takes input of genomic coordinates in the text box, or uploaded as a file. Examples of accepted coordinate formats are provided above the text box. To extend the search region, either enter the distance in the text box or use the slider. The output of a Regions search is a page the lists each region with the numbers of features found. You can download data for each region in various formats, or you can generate a list of features found in all regions using Create List by Feature Type. This figure shows the Regions search performed in the second example described in Subheading Figure 12. This figure shows the table generated in step 7 of the second example described in Subheading The histogram icon in each column header produces a column summary. Clicking this icon in the Sequence Ontology Term Name column shows all the feature types overlapping the SNPs. Checking the box next to gene, then selecting Restrict table to matching rows in the Filter pull-down menu modifies the table so that only gene features are listed. Following this step, a list of gene ids can be generated. Figure 13. Template queries that take a single identifier as input can also be used with lists of identifiers of the appropriate data type. When lists are available, the option to constrain to be is automatically provided. A pull-down menu with a default IN can be changed to NOT IN. All available lists of the appropriate data type, including user-made lists, are provided for selection in the list pull-down menu. This figure shows the result of using the Genes Overlapping SNPs list from the second example described in Subheading in the Gene Pathway template query.
48 Tables Table 1. BovineMine Data Sources Data Source Reference AnimalQTLdb [10] BioCyc [18] BioGRID [19] Bovine Genome Assembly UMD3.1.1 [20] Bovine HapMap [21] Bovine Official Gene Set [22] dbsnp [23] dbvar [24] EnsemblCompara [25] Ensembl Genes [26] Goat Genome Assembly ARS1 [27] Gene Ontology [28] HomoloGene [29] IntAct [30] InterPro [31] KEGG [32] OrthoDB [33] PubMed [34] Reactome [35] RefSeq [36] Sequence Read Archive [37] Sheep Genome Assembly OAR_v3.1 [38] SNPchiMp [39] Treefam [40] UniProt [41] UniProt-GOA [42]
49 Table 2. Primary gene or protein identifiers used in data sets for different species at BovineMine. Information in this table is useful when building a query that involves a dataset that uses a specific source of gene identifier. The first three rows of the table indicate which primary gene and protein data sets are available for each species. The second part of the table indicates which of the first three data sets are related to other data sets in BovineMine, and which type of identifier is used for those relationships. The Data Class column in the second part of the table indicates the data class that has a direct relationship to the data set listed in the second column. E=Ensembl, R=RefSeq, U=UniProt.
50 Data Class! Species " Data Set! Bos taurus Capra hircus Ovis aries Sus scrofa Equus caballus Canis familiaris Mus musculus Rattus norvegicus Homo sapiens Gene Ensembl E E Gene RefSeq R R R Protein UniProt U U U U U U Gene BioCyc E E E Gene BioGRID R R R R Gene Ensembl Compara E E E E E E E Gene Gene Symbols E, R R E, R E, R E, R E, R Gene GO Annotations E, R R E, R R R R Gene Homologene R R R R R Gene IntAct E E E E E Gene KEGG R R R R R R R Gene OrthoDB E R E E E E E E E Gene Publications E, R R R R R R Gene TreeFam E E E E Gene Reactome E, R Gene UniProt E, R R E, R R R R Transcript Expression E, R Transcript dbsnp variant consequences E, R Protein InterPro U U U U U U Protein Reactome U U U U
51 Table 3. Identifiers for step 1c of the GWAS Meta-analysis in the first example described in Subheading ARS- BFGL- NGS ARS- BFGL- NGS ARS- USMARC- 670 BFGL- NGS BovineHD BovineHD BovineHD BovineHD BovineHD BovineHD BovineHD BovineHD BovineHD BovineHD BovineHD Hapmap BTA Table 4. Identifiers for step 2b in the GWAS Meta-analysis in the first example described in Subheading rs rs rs rs rs rs rs rs rs rs rs rs rs rs rs rs


52 A B C D Figure 1
53 Figure 2
54 Figure 3
55 A B C Figure 4
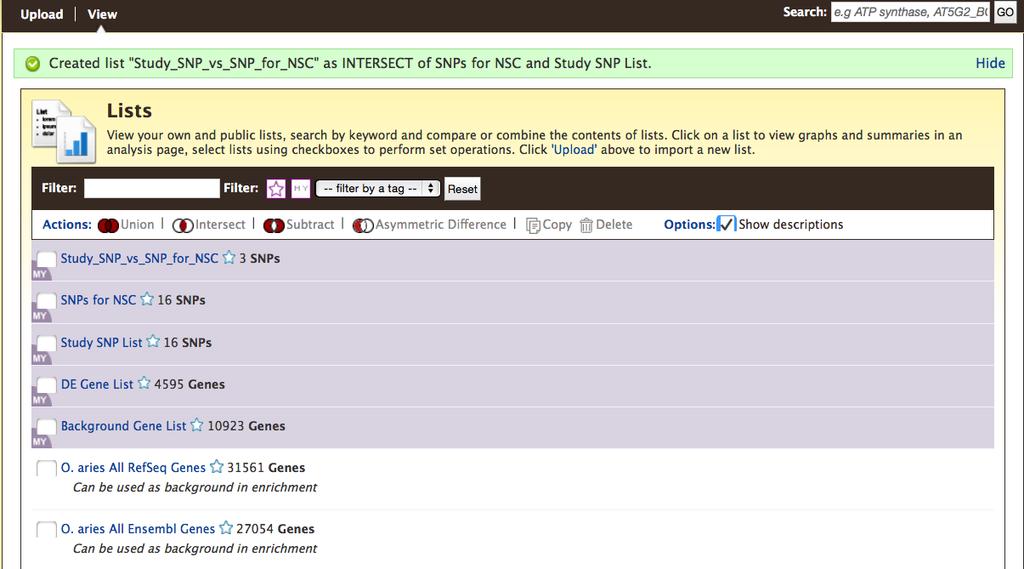
56 Figure 5


57 Figure 6
58 Figure 7


59 A B C D E Figure 8

60 A B Figure 9

61 A B C D E F Figure 10
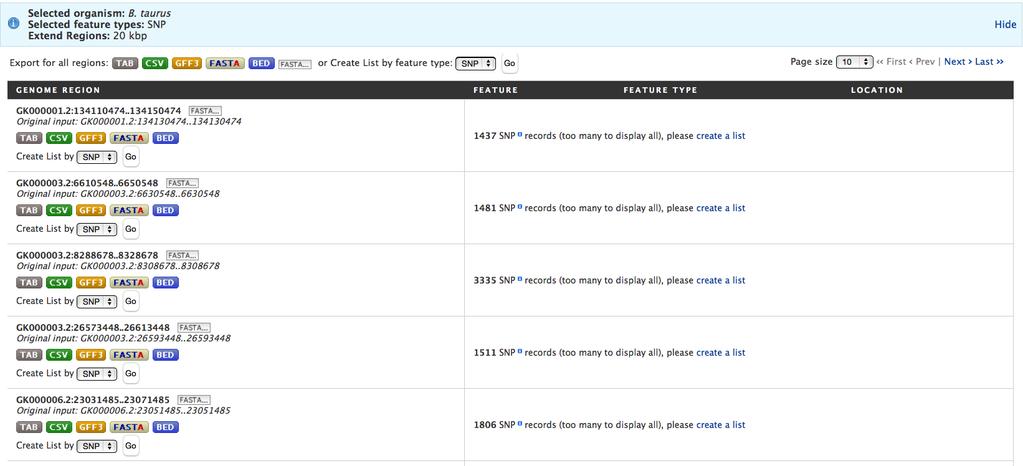
62 Figure 11
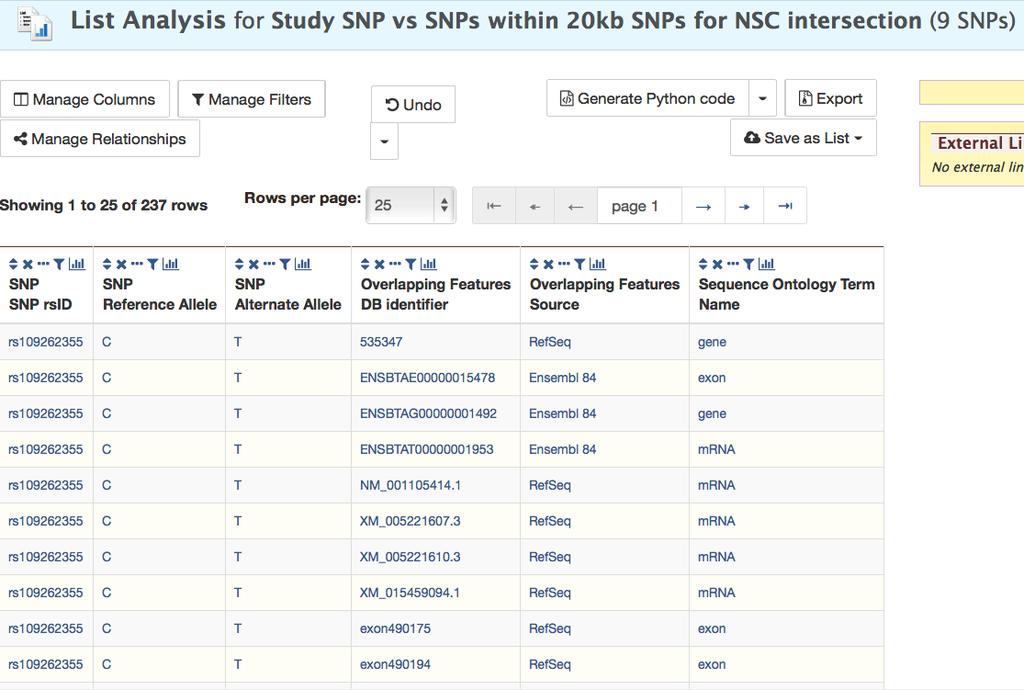

63 Figure 12
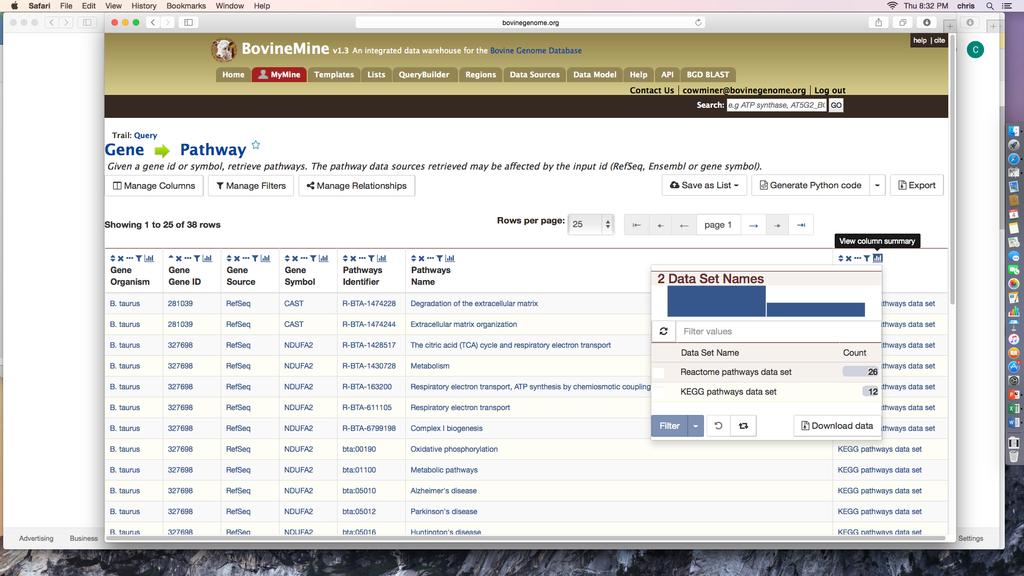
64 Figure 13
BovineMine Documentation
 BovineMine Documentation Release 1.0 Deepak Unni, Aditi Tayal, Colin Diesh, Christine Elsik, Darren Hag Oct 06, 2017 Contents 1 Tutorial 3 1.1 Overview.................................................
HymenopteraMine Documentation
 HymenopteraMine Documentation Release 1.0 Aditi Tayal, Deepak Unni, Colin Diesh, Chris Elsik, Darren Hagen Apr 06, 2017 Contents 1 Welcome to HymenopteraMine 3 1.1 Overview of HymenopteraMine.....................................
Genome Browsers - The UCSC Genome Browser
 Genome Browsers - The UCSC Genome Browser Background The UCSC Genome Browser is a well-curated site that provides users with a view of gene or sequence information in genomic context for a specific species,
Genome Browsers Guide
 Genome Browsers Guide Take a Class This guide supports the Galter Library class called Genome Browsers. See our Classes schedule for the next available offering. If this class is not on our upcoming schedule,
Tutorial 1: Exploring the UCSC Genome Browser
 Last updated: May 12, 2011 Tutorial 1: Exploring the UCSC Genome Browser Open the homepage of the UCSC Genome Browser at: http://genome.ucsc.edu/ In the blue bar at the top, click on the Genomes link.
CLC Server. End User USER MANUAL
 CLC Server End User USER MANUAL Manual for CLC Server 10.0.1 Windows, macos and Linux March 8, 2018 This software is for research purposes only. QIAGEN Aarhus Silkeborgvej 2 Prismet DK-8000 Aarhus C Denmark
Wilson Leung 05/27/2008 A Simple Introduction to NCBI BLAST
 A Simple Introduction to NCBI BLAST Prerequisites: Detecting and Interpreting Genetic Homology: Lecture Notes on Alignment Resources: The BLAST web server is available at http://www.ncbi.nih.gov/blast/
Wilson Leung 01/03/2018 An Introduction to NCBI BLAST. Prerequisites: Detecting and Interpreting Genetic Homology: Lecture Notes on Alignment
 An Introduction to NCBI BLAST Prerequisites: Detecting and Interpreting Genetic Homology: Lecture Notes on Alignment Resources: The BLAST web server is available at https://blast.ncbi.nlm.nih.gov/blast.cgi
Finding and Exporting Data. BioMart
 September 2017 Finding and Exporting Data Not sure what tool to use to find and export data? BioMart is used to retrieve data for complex queries, involving a few or many genes or even complete genomes.
Exercises. Biological Data Analysis Using InterMine workshop exercises with answers
 Exercises Biological Data Analysis Using InterMine workshop exercises with answers Exercise1: Faceted Search Use HumanMine for this exercise 1. Search for one or more of the following using the keyword
Browser Exercises - I. Alignments and Comparative genomics
 Browser Exercises - I Alignments and Comparative genomics 1. Navigating to the Genome Browser (GBrowse) Note: For this exercise use http://www.tritrypdb.org a. Navigate to the Genome Browser (GBrowse)
mirnet Tutorial Starting with expression data
 mirnet Tutorial Starting with expression data Computer and Browser Requirements A modern web browser with Java Script enabled Chrome, Safari, Firefox, and Internet Explorer 9+ For best performance and
Tutorial: RNA-Seq Analysis Part II (Tracks): Non-Specific Matches, Mapping Modes and Expression measures
: Non-Specific Matches, Mapping Modes and Expression measures") : RNA-Seq Analysis Part II (Tracks): Non-Specific Matches, Mapping Modes and February 24, 2014 Sample to Insight : RNA-Seq Analysis Part II (Tracks): Non-Specific Matches, Mapping Modes and : RNA-Seq Analysis
: RNA-Seq Analysis Part II (Tracks): Non-Specific Matches, Mapping Modes and February 24, 2014 Sample to Insight : RNA-Seq Analysis Part II (Tracks): Non-Specific Matches, Mapping Modes and : RNA-Seq Analysis
Pathway Analysis using Partek Genomics Suite 6.6 and Partek Pathway
 Pathway Analysis using Partek Genomics Suite 6.6 and Partek Pathway Overview Partek Pathway provides a visualization tool for pathway enrichment spreadsheets, utilizing KEGG and/or Reactome databases for
Genomic Analysis with Genome Browsers.
 Genomic Analysis with Genome Browsers http://barc.wi.mit.edu/hot_topics/ 1 Outline Genome browsers overview UCSC Genome Browser Navigating: View your list of regions in the browser Available tracks (eg.
Tutorial. Comparative Analysis of Three Bovine Genomes. Sample to Insight. November 21, 2017
 Comparative Analysis of Three Bovine Genomes November 21, 2017 Sample to Insight QIAGEN Aarhus Silkeborgvej 2 Prismet 8000 Aarhus C Denmark Telephone: +45 70 22 32 44 www.qiagenbioinformatics.com AdvancedGenomicsSupport@qiagen.com
MetScape User Manual
 MetScape 2.3.2 User Manual A Plugin for Cytoscape National Center for Integrative Biomedical Informatics July 2012 2011 University of Michigan This work is supported by the National Center for Integrative
When we search a nucleic acid databases, there is no need for you to carry out your own six frame translation. Mascot always performs a 6 frame
 1 When we search a nucleic acid databases, there is no need for you to carry out your own six frame translation. Mascot always performs a 6 frame translation on the fly. That is, 3 reading frames from
Tutorial. De Novo Assembly of Paired Data. Sample to Insight. November 21, 2017
 De Novo Assembly of Paired Data November 21, 2017 Sample to Insight QIAGEN Aarhus Silkeborgvej 2 Prismet 8000 Aarhus C Denmark Telephone: +45 70 22 32 44 www.qiagenbioinformatics.com AdvancedGenomicsSupport@qiagen.com
Tutorial: De Novo Assembly of Paired Data
 : De Novo Assembly of Paired Data September 20, 2013 CLC bio Silkeborgvej 2 Prismet 8000 Aarhus C Denmark Telephone: +45 70 22 32 44 Fax: +45 86 20 12 22 www.clcbio.com support@clcbio.com : De Novo Assembly
Creating and Using Genome Assemblies Tutorial
 Creating and Using Genome Assemblies Tutorial Release 8.1 Golden Helix, Inc. March 18, 2014 Contents 1. Create a Genome Assembly for Danio rerio 2 2. Building Annotation Sources 5 A. Creating a Reference
Getting Started. April Strand Life Sciences, Inc All rights reserved.
 Getting Started April 2015 Strand Life Sciences, Inc. 2015. All rights reserved. Contents Aim... 3 Demo Project and User Interface... 3 Downloading Annotations... 4 Project and Experiment Creation... 6
Tutorial: How to use the Wheat TILLING database
 Tutorial: How to use the Wheat TILLING database Last Updated: 9/7/16 1. Visit http://dubcovskylab.ucdavis.edu/wheat_blast to go to the BLAST page or click on the Wheat BLAST button on the homepage. 2.
Tutorial 4 BLAST Searching the CHO Genome
 Tutorial 4 BLAST Searching the CHO Genome Accessing the CHO Genome BLAST Tool The CHO BLAST server can be accessed by clicking on the BLAST button on the home page or by selecting BLAST from the menu bar
VectorBase Web Apollo April Web Apollo 1
 Web Apollo 1 Contents 1. Access points: Web Apollo, Genome Browser and BLAST 2. How to identify genes that need to be annotated? 3. Gene manual annotations 4. Metadata 1. Access points Web Apollo tool
8:15 Introduction/Overview Michelle Giglio. 8:45 CloVR background W. Florian Fricke. 9:15 Hands-on: Start CloVR W. Florian Fricke
 Hands-On Exercises 2016 1 Agenda 8:15 Introduction/Overview Michelle Giglio 8:45 CloVR background W. Florian Fricke 9:15 Hands-on: Start CloVR W. Florian Fricke 9:45 Break 9:55 Hands-on: Start CloVR-Microbe
Today's outline. Resources. Genome browser components. Genome browsers: Discovering biology through genomics. Genome browser tutorial materials
 Today's outline Genome browsers: Discovering biology through genomics BaRC Hot Topics April 2013 George Bell, Ph.D. http://jura.wi.mit.edu/bio/education/hot_topics/ Genome browser introduction Popular
Advanced UCSC Browser Functions
 Advanced UCSC Browser Functions Dr. Thomas Randall tarandal@email.unc.edu bioinformatics.unc.edu UCSC Browser: genome.ucsc.edu Overview Custom Tracks adding your own datasets Utilities custom tools for
Tutorial: Jump Start on the Human Epigenome Browser at Washington University
 Tutorial: Jump Start on the Human Epigenome Browser at Washington University This brief tutorial aims to introduce some of the basic features of the Human Epigenome Browser, allowing users to navigate
Genome Environment Browser (GEB) user guide
 user guide") Genome Environment Browser (GEB) user guide GEB is a Java application developed to provide a dynamic graphical interface to visualise the distribution of genome features and chromosome-wide experimental
Genome Environment Browser (GEB) user guide GEB is a Java application developed to provide a dynamic graphical interface to visualise the distribution of genome features and chromosome-wide experimental
SEEK User Manual. Introduction
 SEEK User Manual Introduction SEEK is a computational gene co-expression search engine. It utilizes a vast human gene expression compendium to deliver fast, integrative, cross-platform co-expression analyses.
How to store and visualize RNA-seq data
 How to store and visualize RNA-seq data Gabriella Rustici Functional Genomics Group gabry@ebi.ac.uk EBI is an Outstation of the European Molecular Biology Laboratory. Talk summary How do we archive RNA-seq
User Guide. v Released June Advaita Corporation 2016
 User Guide v. 0.9 Released June 2016 Copyright Advaita Corporation 2016 Page 2 Table of Contents Table of Contents... 2 Background and Introduction... 4 Variant Calling Pipeline... 4 Annotation Information
A short Introduction to UCSC Genome Browser
 A short Introduction to UCSC Genome Browser Elodie Girard, Nicolas Servant Institut Curie/INSERM U900 Bioinformatics, Biostatistics, Epidemiology and computational Systems Biology of Cancer 1 Why using
DAVID hands-on. by Ester Feldmesser, June 2017
 DAVID hands-on by Ester Feldmesser, June 2017 1. Go to the DAVID website (http://david.abcc.ncifcrf.gov/) 2. Press on Start Analysis: 3. Choose the Upload tab in the left panel: 4. Download the k-means5_arabidopsis.txt
Tutorial: Resequencing Analysis using Tracks
 : Resequencing Analysis using Tracks September 20, 2013 CLC bio Silkeborgvej 2 Prismet 8000 Aarhus C Denmark Telephone: +45 70 22 32 44 Fax: +45 86 20 12 22 www.clcbio.com support@clcbio.com : Resequencing
ChIP-Seq Tutorial on Galaxy
 1 Introduction ChIP-Seq Tutorial on Galaxy 2 December 2010 (modified April 6, 2017) Rory Stark The aim of this practical is to give you some experience handling ChIP-Seq data. We will be working with data
Differential Expression Analysis at PATRIC
 Differential Expression Analysis at PATRIC The following step- by- step workflow is intended to help users learn how to upload their differential gene expression data to their private workspace using Expression
Tutorial: Using the SFLD and Cytoscape to Make Hypotheses About Enzyme Function for an Isoprenoid Synthase Superfamily Sequence
 Tutorial: Using the SFLD and Cytoscape to Make Hypotheses About Enzyme Function for an Isoprenoid Synthase Superfamily Sequence Requirements: 1. A web browser 2. The cytoscape program (available for download
Colorado State University Bioinformatics Algorithms Assignment 6: Analysis of High- Throughput Biological Data Hamidreza Chitsaz, Ali Sharifi- Zarchi
 Colorado State University Bioinformatics Algorithms Assignment 6: Analysis of High- Throughput Biological Data Hamidreza Chitsaz, Ali Sharifi- Zarchi Although a little- bit long, this is an easy exercise
Geneious 5.6 Quickstart Manual. Biomatters Ltd
 Geneious 5.6 Quickstart Manual Biomatters Ltd October 15, 2012 2 Introduction This quickstart manual will guide you through the features of Geneious 5.6 s interface and help you orient yourself. You should
Topics of the talk. Biodatabases. Data types. Some sequence terminology...
 Topics of the talk Biodatabases Jarno Tuimala / Eija Korpelainen CSC What data are stored in biological databases? What constitutes a good database? Nucleic acid sequence databases Amino acid sequence
The Allen Human Brain Atlas offers three types of searches to allow a user to: (1) obtain gene expression data for specific genes (or probes) of
 obtain gene expression data for specific genes (or probes) of") Microarray Data MICROARRAY DATA Gene Search Boolean Syntax Differential Search Mouse Differential Search Search Results Gene Classification Correlative Search Download Search Results Data Visualization
Microarray Data MICROARRAY DATA Gene Search Boolean Syntax Differential Search Mouse Differential Search Search Results Gene Classification Correlative Search Download Search Results Data Visualization
Tutorial: chloroplast genomes
 Tutorial: chloroplast genomes Stacia Wyman Department of Computer Sciences Williams College Williamstown, MA 01267 March 10, 2005 ASSUMPTIONS: You are using Internet Explorer under OS X on the Mac. You
Welcome to the Quantitative Trait Loci (QTL) Tutorial
 Tutorial") Welcome to the Quantitative Trait Loci (QTL) Tutorial This tutorial will describe how to navigate the section of Gramene that provides information on Quantitative Trait Loci (QTL). QTL are a statistical
Welcome to the Quantitative Trait Loci (QTL) Tutorial This tutorial will describe how to navigate the section of Gramene that provides information on Quantitative Trait Loci (QTL). QTL are a statistical
User Guide. Web Intelligence Rich Client. Business Objects 4.1
 User Guide Web Intelligence Rich Client Business Objects 4.1 2 P a g e Web Intelligence 4.1 User Guide Web Intelligence 4.1 User Guide Contents Getting Started in Web Intelligence 4.1... 5 Log into EDDIE...
The UCSC Genome Browser
 The UCSC Genome Browser Search, retrieve and display the data that you want Materials prepared by Warren C. Lathe, Ph.D. Mary Mangan, Ph.D. www.openhelix.com Updated: Q3 2006 Version_0906 Copyright OpenHelix.
GenomeStudio Software Release Notes
 GenomeStudio Software 2009.2 Release Notes 1. GenomeStudio Software 2009.2 Framework... 1 2. Illumina Genome Viewer v1.5...2 3. Genotyping Module v1.5... 4 4. Gene Expression Module v1.5... 6 5. Methylation
Performing a resequencing assembly
 BioNumerics Tutorial: Performing a resequencing assembly 1 Aim In this tutorial, we will discuss the different options to obtain statistics about the sequence read set data and assess the quality, and
Tour Guide for Windows and Macintosh
 Tour Guide for Windows and Macintosh 2011 Gene Codes Corporation Gene Codes Corporation 775 Technology Drive, Suite 100A, Ann Arbor, MI 48108 USA phone 1.800.497.4939 or 1.734.769.7249 (fax) 1.734.769.7074
Getting started with Inspirometer A basic guide to managing feedback
 Getting started with Inspirometer A basic guide to managing feedback W elcome! Inspirometer is a new tool for gathering spontaneous feedback from our customers and colleagues in order that we can improve
BGGN-213: FOUNDATIONS OF BIOINFORMATICS (Lecture 14)
") BGGN-213: FOUNDATIONS OF BIOINFORMATICS (Lecture 14) Genome Informatics (Part 1) https://bioboot.github.io/bggn213_f17/lectures/#14 Dr. Barry Grant Nov 2017 Overview: The purpose of this lab session is
BGGN-213: FOUNDATIONS OF BIOINFORMATICS (Lecture 14) Genome Informatics (Part 1) https://bioboot.github.io/bggn213_f17/lectures/#14 Dr. Barry Grant Nov 2017 Overview: The purpose of this lab session is
UCSC Genome Browser ASHG 2014 Workshop
 UCSC Genome Browser ASHG 2014 Workshop We will be using human assembly hg19. Some steps may seem a bit cryptic or truncated. That is by design, so you will think about things as you go. In this document,
Performing whole genome SNP analysis with mapping performed locally
 BioNumerics Tutorial: Performing whole genome SNP analysis with mapping performed locally 1 Introduction 1.1 An introduction to whole genome SNP analysis A Single Nucleotide Polymorphism (SNP) is a variation
Expression Analysis with the Advanced RNA-Seq Plugin
 Expression Analysis with the Advanced RNA-Seq Plugin May 24, 2016 Sample to Insight CLC bio, a QIAGEN Company Silkeborgvej 2 Prismet 8000 Aarhus C Denmark Telephone: +45 70 22 32 44 www.clcbio.com support-clcbio@qiagen.com
Integrated Genome browser (IGB) installation
 installation") Integrated Genome browser (IGB) installation Navigate to the IGB download page http://bioviz.org/igb/download.html You will see three icons for download: The three icons correspond to different memory
Integrated Genome browser (IGB) installation Navigate to the IGB download page http://bioviz.org/igb/download.html You will see three icons for download: The three icons correspond to different memory
Tutorial: RNA-Seq analysis part I: Getting started
 : RNA-Seq analysis part I: Getting started August 9, 2012 CLC bio Finlandsgade 10-12 8200 Aarhus N Denmark Telephone: +45 70 22 55 09 Fax: +45 70 22 55 19 www.clcbio.com support@clcbio.com : RNA-Seq analysis
GeneSifter.Net User s Guide
 GeneSifter.Net User s Guide 1 2 GeneSifter.Net Overview Login Upload Tools Pairwise Analysis Create Projects For more information about a feature see the corresponding page in the User s Guide noted in
epigenomegateway.wustl.edu
 Everything can be found at epigenomegateway.wustl.edu REFERENCES 1. Zhou X, et al., Nature Methods 8, 989-990 (2011) 2. Zhou X & Wang T, Current Protocols in Bioinformatics Unit 10.10 (2012) 3. Zhou X,
Exon Probeset Annotations and Transcript Cluster Groupings
 Exon Probeset Annotations and Transcript Cluster Groupings I. Introduction This whitepaper covers the procedure used to group and annotate probesets. Appropriate grouping of probesets into transcript clusters
Ektron Advanced. Learning Objectives. Getting Started
 Ektron Advanced 1 Learning Objectives This workshop introduces you beyond the basics of Ektron, the USF web content management system that is being used to modify department web pages. This workshop focuses
Helpful Galaxy screencasts are available at:
 This user guide serves as a simplified, graphic version of the CloudMap paper for applicationoriented end-users. For more details, please see the CloudMap paper. Video versions of these user guides and
Working with PDF s. To open a recent file on the Start screen, double click on the file name.
 Working with PDF s Acrobat DC Start Screen (Home Tab) When Acrobat opens, the Acrobat Start screen (Home Tab) populates displaying a list of recently opened files. The search feature on the top of the
Exercise 2: Browser-Based Annotation and RNA-Seq Data
 Exercise 2: Browser-Based Annotation and RNA-Seq Data Jeremy Buhler July 24, 2018 This exercise continues your introduction to practical issues in comparative annotation. You ll be annotating genomic sequence
Step-by-Step Guide to Advanced Genetic Analysis
 Step-by-Step Guide to Advanced Genetic Analysis Page 1 Introduction In the previous document, 1 we covered the standard genetic analyses available in JMP Genomics. Here, we cover the more advanced options
Introduction to Genome Browsers
 Introduction to Genome Browsers Rolando Garcia-Milian, MLS, AHIP (Rolando.milian@ufl.edu) Department of Biomedical and Health Information Services Health Sciences Center Libraries, University of Florida
Import GEO Experiment into Partek Genomics Suite
 Import GEO Experiment into Partek Genomics Suite This tutorial will illustrate how to: Import a gene expression experiment from GEO SOFT files Specify annotations Import RAW data from GEO for gene expression
QDA Miner. Addendum v2.0
 QDA Miner Addendum v2.0 QDA Miner is an easy-to-use qualitative analysis software for coding, annotating, retrieving and reviewing coded data and documents such as open-ended responses, customer comments,
Supplementary Figure 1. Fast read-mapping algorithm of BrowserGenome.
 Supplementary Figure 1 Fast read-mapping algorithm of BrowserGenome. (a) Indexing strategy: The genome sequence of interest is divided into non-overlapping 12-mers. A Hook table is generated that contains
Scribe 4 Manual 2. Scribe 4
 Scribe 4 Manual 2 Scribe 4 Scribe 4 is an optimally flexible data analysis program that permits users to label events in live observations or in QuickTime movies, summarize event timings, and play back
Analyzing ChIP- Seq Data in Galaxy
 Analyzing ChIP- Seq Data in Galaxy Lauren Mills RISS ABSTRACT Step- by- step guide to basic ChIP- Seq analysis using the Galaxy platform. Table of Contents Introduction... 3 Links to helpful information...
You will be re-directed to the following result page.
 ENCODE Element Browser Goal: to navigate the candidate DNA elements predicted by the ENCODE consortium, including gene expression, DNase I hypersensitive sites, TF binding sites, and candidate enhancers/promoters.
LEGENDplex Data Analysis Software Version 8 User Guide
 LEGENDplex Data Analysis Software Version 8 User Guide Introduction Welcome to the user s guide for Version 8 of the LEGENDplex data analysis software for Windows based computers 1. This tutorial will
De novo genome assembly
 BioNumerics Tutorial: De novo genome assembly 1 Aims This tutorial describes a de novo assembly of a Staphylococcus aureus genome, using single-end and pairedend reads generated by an Illumina R Genome
COMMUNITIES USER MANUAL. Satori Team
 COMMUNITIES USER MANUAL Satori Team Table of Contents Communities... 2 1. Introduction... 4 2. Roles and privileges.... 5 3. Process flow.... 6 4. Description... 8 a) Community page.... 9 b) Creating community
EGAN Tutorial: A Basic Use-case
 EGAN Tutorial: A Basic Use-case July 2010 Jesse Paquette Biostatistics and Computational Biology Core Helen Diller Family Comprehensive Cancer Center University of California, San Francisco (AKA BCBC HDFCCC
W ASHU E PI G ENOME B ROWSER
 Roadmap Epigenomics Workshop W ASHU E PI G ENOME B ROWSER SOT 2016 Satellite Meeting March 17 th, 2016 Ernest N. Morial Convention Center, New Orleans, LA Presenter: Ting Wang Tutorial Overview: WashU
W ASHU E PI G ENOME B ROWSER
 W ASHU E PI G ENOME B ROWSER Keystone Symposium on DNA and RNA Methylation January 23 rd, 2018 Fairmont Hotel Vancouver, Vancouver, British Columbia, Canada Presenter: Renee Sears and Josh Jang Tutorial
Griffin Training Manual Grif-WebI Introduction (For Analysts)
") Griffin Training Manual Grif-WebI Introduction (For Analysts) Alumni Relations and Development The University of Chicago Table of Contents Chapter 1: Defining WebIntelligence... 1 Chapter 2: Working with
Griffin Training Manual Grif-WebI Introduction (For Analysts) Alumni Relations and Development The University of Chicago Table of Contents Chapter 1: Defining WebIntelligence... 1 Chapter 2: Working with
Lesson 1: Creating and formatting an Answers analysis
 Lesson 1: Creating and formatting an Answers analysis Answers is the ad-hoc query environment in the OBIEE suite. It is in Answers that you create and format analyses to help analyze business results.
UCSC Genome Browser Pittsburgh Workshop -- Practical Exercises
 UCSC Genome Browser Pittsburgh Workshop -- Practical Exercises We will be using human assembly hg19. These problems will take you through a variety of resources at the UCSC Genome Browser. You will learn
Bioinformatics Hubs on the Web
 Bioinformatics Hubs on the Web Take a class The Galter Library teaches a related class called Bioinformatics Hubs on the Web. See our Classes schedule for the next available offering. If this class is
Tutorial. Aligning contigs manually using the Genome Finishing. Sample to Insight. February 6, 2019
 Aligning contigs manually using the Genome Finishing Module February 6, 2019 Sample to Insight QIAGEN Aarhus Silkeborgvej 2 Prismet 8000 Aarhus C Denmark Telephone: +45 70 22 32 44 www.qiagenbioinformatics.com
Tutorial. RNA-Seq Analysis of Breast Cancer Data. Sample to Insight. November 21, 2017
 RNA-Seq Analysis of Breast Cancer Data November 21, 2017 Sample to Insight QIAGEN Aarhus Silkeborgvej 2 Prismet 8000 Aarhus C Denmark Telephone: +45 70 22 32 44 www.qiagenbioinformatics.com AdvancedGenomicsSupport@qiagen.com
Table of contents Genomatix AG 1
 Table of contents! Introduction! 3 Getting started! 5 The Genome Browser window! 9 The toolbar! 9 The general annotation tracks! 12 Annotation tracks! 13 The 'Sequence' track! 14 The 'Position' track!
WASHU EPIGENOME BROWSER 2018 epigenomegateway.wustl.edu
 WASHU EPIGENOME BROWSER 2018 epigenomegateway.wustl.edu 3 BROWSER MAP 14 15 16 17 18 19 20 21 22 23 24 1 2 5 4 8 9 10 12 6 11 7 13 Key 1 = Go to this page number to learn about the browser feature TABLE
Tutorial. Variant Detection. Sample to Insight. November 21, 2017
 Resequencing: Variant Detection November 21, 2017 Map Reads to Reference and Sample to Insight QIAGEN Aarhus Silkeborgvej 2 Prismet 8000 Aarhus C Denmark Telephone: +45 70 22 32 44 www.qiagenbioinformatics.com
RITIS Training Module 4 Script
 RITIS Training Module 4 Script Welcome to the Regional Integrated Information System or RITIS Module 04 CBT. To begin, select the start button or press Shift+N on your keyboard. This training module will
BLAST Exercise 2: Using mrna and EST Evidence in Annotation Adapted by W. Leung and SCR Elgin from Annotation Using mrna and ESTs by Dr. J.
 BLAST Exercise 2: Using mrna and EST Evidence in Annotation Adapted by W. Leung and SCR Elgin from Annotation Using mrna and ESTs by Dr. J. Buhler Prerequisites: BLAST Exercise: Detecting and Interpreting
Query Studio Training Guide Cognos 8 February 2010 DRAFT. Arkansas Public School Computer Network 101 East Capitol, Suite 101 Little Rock, AR 72201
 Query Studio Training Guide Cognos 8 February 2010 DRAFT Arkansas Public School Computer Network 101 East Capitol, Suite 101 Little Rock, AR 72201 2 Table of Contents Accessing Cognos Query Studio... 5
OvidSP Quick Reference Guide
 OvidSP Quick Reference Guide Opening an OvidSP Session Open the OvidSP URL with a browser or Follow a link on a web page or Use Athens or Shibboleth access Select Resources to Search In the Select Resource(s)
IHS Enerdeq Desktop International Training Guide
 IHS > Decision Support Tool IHS Enerdeq Desktop International Training Guide May 2009 Version 1.5.2 2009 IHS, All Rights Reserved. All trademarks belong to IHS or its affiliated and subsidiary companies,
User's guide to ChIP-Seq applications: command-line usage and option summary
 User's guide to ChIP-Seq applications: command-line usage and option summary 1. Basics about the ChIP-Seq Tools The ChIP-Seq software provides a set of tools performing common genome-wide ChIPseq analysis
Step-by-Step Guide to Basic Genetic Analysis
 Step-by-Step Guide to Basic Genetic Analysis Page 1 Introduction This document shows you how to clean up your genetic data, assess its statistical properties and perform simple analyses such as case-control
Sequence Analysis Pipeline
 Sequence Analysis Pipeline Transcript fragments 1. PREPROCESSING 2. ASSEMBLY (today) Removal of contaminants, vector, adaptors, etc Put overlapping sequence together and calculate bigger sequences 3. Analysis/Annotation
Pathway Analysis of Untargeted Metabolomics Data using the MS Peaks to Pathways Module
 Pathway Analysis of Untargeted Metabolomics Data using the MS Peaks to Pathways Module By: Jasmine Chong, Jeff Xia Date: 14/02/2018 The aim of this tutorial is to demonstrate how the MS Peaks to Pathways
Genetic Analysis. Page 1
 Genetic Analysis Page 1 Genetic Analysis Objectives: 1) Set up Case-Control Association analysis and the Basic Genetics Workflow 2) Use JMP tools to interact with and explore results 3) Learn advanced
Astra Scheduling Grids
 Astra Scheduling Grids To access the grids, click on the Scheduling Grids option from the Calendars tab. A default grid will be displayed as defined by the calendar permission within your role. Choosing
Astra Scheduling Grids
 Astra Scheduling Grids To access the grids, click on the Scheduling Grids option from the Calendars tab. A default grid will be displayed as defined by the calendar permission within your role. Choosing
Astra Schedule User Guide Scheduler
 Astra Schedule User Guide 7.5.12 Scheduler 1 P a g e ASTRA SCHEDULE USER GUIDE 7.5.12... 1 LOGGING INTO ASTRA SCHEDULE... 3 LOGIN CREDENTIALS... 3 WORKING WITH CALENDARS... 4 CHOOSING A CALENDAR AND FILTER...