SPSS: AN OVERVIEW. SEEMA JAGGI Indian Agricultural Statistics Research Institute Library Avenue, New Delhi
|
|
|
- Lillian Ferguson
- 6 years ago
- Views:
Transcription
1 : AN OVERVIEW SEEMA JAGGI Indian Agricultural Statistics Research Institute Library Avenue, New Delhi Introduction The abbreviation SPSS stands for Statistical Package for the Social Sciences and is a comprehensive system for analysing data. This package of programs is available for both personal and mainframe (or multi-user) computers. SPSS package consists of a set of software tools for data entry, data management, statistical analysis and presentation. SPSS integrates complex data and file management, statistical analysis and reporting functions. SPSS can take data from almost any type of file and use them to generate tabulated reports, charts, and plots of distributions and trends, descriptive statistics, and complex statistical analyses. Features of SPSS (i) It is easy to learn and use (ii) It includes a full range of data management system and editing tools (iii) It provides in-depth statistical capabilities (iv) It offers complete plotting, reporting and presentation features. SPSS makes statistical analysis accessible for the casual user and convenient for the experienced user. The data editor offers a simple and efficient spreadsheet-like facility for entering data and browsing the working data file. To invoke SPSS in the windows environment, select the appropriate SPSS icon. There are a number of different types of windows in SPSS. Data Editor. This window displays the contents of the data file. One can create new data files or modify existing ones. The Data Editor window opens automatically when one starts an SPSS session. One can have only one data file open at a time. This editor provides two views of the data. Data view. Displays the actual data values or defined value labels. Variable view. Displays variable definition information, including defined variable and value labels, data type etc. With the Data Editor, one can modify data values in the Data view in many ways like change data values; cut, copy and paste data values; add and delete cases; add and delete variables, change the order of variables. Viewer. All statistical results, tables, and charts are displayed in the Viewer. The output can be edited and saved for later use. A Viewer window opens automatically the first time you run a procedure that generates output. Draft Viewer. The output can be displayed as a simple text in this window.
2 Syntax Editor. One can paste the dialog box choices into a syntax window, where the selections appear in the form of command syntax. One can then edit the command syntax to utilize special features of SPSS not available through dialog boxes. These commands can be saved in a file for use in subsequent SPSS sessions. Pivot Table Editor. Output is displayed in pivot tables that can be modified in many ways with this editor. One can edit text, swap data in rows and columns, create multidimensional tables, and selectively hide and show results. Text Output Editor. Text output not displayed in pivot tables can be modified with the Text Output Editor. One can edit the output and change font characteristics (type, style, colour, size). Chart Editor. High-resolution charts and plots can be modified in chart windows. One can change the colours, select different type of fonts and sizes etc. Many of the tasks that are to be performed with SPSS start with menu selections. Each window has its own menu bar with menu selections appropriate for that window type. The various procedures under SPSS are File Edit View Data Transform Analyze Graphs Utilities Windows Help Analyze and Graphs menus are available on all windows, making it easy to generate new output without having to switch windows. Most menu selections open dialog boxes. One can use dialog boxes to select variables and options for analysis. Since most procedures provide a great deal of flexibility, not all of the possible choices can be contained in a single dialog box. The main dialog box usually contains the minimum information required to run a procedure. Additional specifications are made in subdialog boxes. All these above mentioned options have further suboptions. To see what applications there are, we simply move the cursor to a particular option and press, when a drop-down menu will appear. To cancel a drop-down menu, place the cursor anywhere outside the option and press the left button. 2
3 The three dots after an option term (...) on a drop-down menu, such as Define Variable...option in Data option, signifies that a dialog box will appear when this option is chosen. To cancel a dialog box, select the Cancel button in the dialog box. A rightfacing arrowhead after an option term indicates that a further submenu will appear to the right of the drop-down menu. An option with neither of these signs means that there are no further drop-down menus to select. There are five standard command pushbuttons in most dialog boxes. OK. Runs the procedure. After the variables and additional specifications are selected, click OK to run the procedure. Paste. Generates command syntax from the dialog box selections and pastes the syntax into a syntax window. Reset. Deselects any variables in the selected variable list and resets all specifications in the dialog box. Cancel. Cancels any changes in the dialog box settings since the last time it was opened and closes the dialog box. Help. Contains information about the current dialog box. Entering and Editing data The easiest way of entering data in SPSS is to type it directly into the matrix of columns and numbered rows in the Data Editor window. The columns represent variables and the rows represent cases. The variables can be defined in the variable view. Variable name must be no longer than eight characters and the name must begin with a letter. Saving data To be able to retrieve a file, we need to save it and give it a name. The default extension name for saving files is sav. Thus, we could call our data file see.sav. To save this file on a floppy disk, we carry out the following sequence: File Save As... [opens Save Data As dialog box] box under Drives: drive [e.g. a] from options listed box under File Name:, delete the asterisk and type file stem name [e.g. see] OK The output file can also be printed and saved. The extension name for output file is spo. Retrieving a saved file To retrieve this file at a later stage when it is no longer the current file, use the following procedure: File Open Data...[opens the Open Data File dialog box] box under Drives: drive [e.g. a]from options listed box under File Name: file name [e.g. see.sav] OK Basic Steps in Data Analysis Get your data into SPSS. You can open a previously saved SPSS data file, read a spreadsheet, database, or text data file, or enter your data directly in the Data Editor. 3

4 Select a procedure. Select a procedure from the menus to calculate statistics or to create a chart. Select the variables for the analysis. The variables in the data file are displayed in a dialog box for the procedure. Run the procedure. Results are displayed in the Viewer. 2. Statistical Procedures After entering the data set in Data Editor or reading an ASCII data file, we are now ready to analyse it. The Analyse option has the following sub options: Reports, Descriptive Statistics, Compare means, General Linear model, Correlate, Regression, Loglinear, Classify, Data Reduction, Scale, Non parametric tests, Time Series, Survival, Multiple response. 2.1 Descriptive Statistics This submenu provides techniques for summarising data with statistics, charts, and reports. The various sub-sub menus under this are as follows: Frequencies provide information about the relative frequency of the occurrence of each category of a variable. This can be used it to obtain summary statistics that describe the typical value and the spread of the observations. To compute summary statistics for each of several groups of cases, Means procedure or the Explore procedure can be used. Descriptives is used to calculate statistics that summarize the values of a variable like the measures of central tendency, measures of dispersion, skewness, kurtosis etc. Explore produces and displays summary statistics for all cases or separately for groups of cases. Boxplots, stem-and leaf plots, histograms, tests of normality, robust estimates of location, frequency tables and other descriptive statistics and plots can also be obtained. 4
5 Crosstabs is used to count the number of cases that have different combinations of values of two or more variables, and to calculate summary statistics and tests. The variables you use to form the categories within which the counts are obtained should have a limited number of distinct values. List Cases displays the values of variables for cases in the data file. Report Summaries in Rows produces reports in which different summary statistics are laid out in rows. Case listings are also available from this command, with or without summary statistics. Report Summaries in Columns produces reports in which different summary statistics are laid out in separate columns. Custom Tables submenu provides attractive, flexible displays of frequency counts, percentages and other statistics. 2.2 Compare Means This submenu provides techniques for testing differences among two or more means for both independent and related samples. Means computes summary statistics for a variable when the cases are subdivided into groups based on their values for other variables. Independent Sample t test is used if two unrelated samples come from populations with the same mean. The observations should be from two unrelated groups, and for testing, the mean must be an appropriate summary measure for the variable to be compared in the two groups. For more than two independent groups, the One-way ANOVA option could be used. Paired Sample t test is used to compare the means of the same subjects in two conditions or at two points in time i.e. to compare subjects who had been matched to be similar in 5
6 certain respects and then to test if two related samples come from populations with the same mean. The related, or paired, samples often result from an experiment in which the same person is observed before and after an intervention. If the distribution of the differences of the values between the members of a pair is markedly nonnormal you should consider one of the nonparametric tests. One-Way ANOVA is used to test that several independent groups come from populations with the same mean. To see which groups are significantly different from each other, multiple comparison procedures can be used through Post Hoc Multiple Comparison option which consist of the options like Least-significant difference, Duncan s multiple range test, Scheffe etc.. The contrast analysis can also be performed in order to compare the different groups or treatments by using the Contrast option. The data obtained using completely randomised design can be analysed through this option. 2.3 General Linear Model This submenu provides techniques for testing univariate and multivariate Analysis of Variance models, including repeated measures. The Univariate suboption could be used to analyse the experimental designs like Completely randomised design, Randomised block design, Latin square design, Designs for factorial experiments etc. The covariace analysis can also be performed and alternate methods for partitioning sums of squares can be selected. If only some of the interactions of a particular order are to be included, the Custom procedure should be used. If there is only one factor then One-Way ANOVA procedure should be used.. Multivariate analyses analysis-of-variance and analysis-of-covariance designs when you have two or more correlated dependent variables. Multivariate analysis of variance is used to test hypotheses about the relationship between a set of interrelated dependent variables and one or more factor or grouping variables. For example, you can test whether verbal and mathematical test scores are related to instructional method used, sex of the subject, and the interaction of method and sex. This procedure should be used only if there are several dependent variables which are related to each other. For a single dependent variable or unrelated dependent variables, the Univariate ANOVA procedures can be adopted. If the same dependent variable is measured on several occasions for each subject, the Repeated Measures procedure is to be used. Repeated Measures is used to test hypotheses about the means of a dependent variable when the same dependent variable is measured on more than one occasion for each subject. Subjects can also be classified into mutually exclusive groups, such as males or females, or type of job held. Then you can test hypotheses about the effects of the between-subject variables and the within-subject variables, as well as their interactions. 6
7 2.4 Correlate This submenu provides measures of association for two or more variables measured at the interval level. Bivariate calculates matrices of Pearson product-moment correlations, and of Kendall and Spearman nonparametric correlations, with significance levels and optional univariate statistics. The correlation coefficient is used to quantify the strength of the linear relationship between two variables. The Pearson correlation coefficient should be used only for data measured at the interval or ratio level. Spearman and Kendall correlation coefficients are nonparametric measures which are particularly useful when the data contain outliers or when the distribution of the variables is markedly nonnormal. Both the Spearman and Kendall coefficients are based on assigning ranks to the variables. Partial calculates partial correlation coefficients that describe the relationship between two variables, while adjusting for the effects of one or more additional variables. If the values of a dependent variable from a set of independent variables is to be predicted then the Linear Regression procedure may be used. If there are no control variables then the Bivariate Correlations procedure can be adopted. Nominal variables should not be used in the partial correlation procedure. 2.5 Regression This submenu provides a variety of regression techniques, including linear, logistic, nonlinear, weighted, and two-stage least-squares regression. Linear is used to examine the relationship between a dependent variable and a set of independent variables. If the dependent variable is dichotomous, then the logistic regression procedure should be used. If the dependent variable is censored, such as survival time after surgery, use the Life Tables, Kaplan-Meier, or proportional hazards procedure. Logistic estimates regression models in which the dependent variable is dichotomous. If the dependent variable has more than two categories, use the Discriminant procedure to identify variables which are useful for assigning the cases to the various groups. If the dependent variable is continuous, use the Linear Regression procedure to predict the values of the dependent variable from a set of independent variables. Probit performs probit analysis which is used to measure the relationship between a response proportion and the strength of a stimulus. For example, the probit procedure can be used to examine the relationship between the proportion of plants dying and the strength of the pesticide applied or to examine the relationship between the proportion of people buying a product and the magnitude of the incentive offered. The probit procedure should be used only if the response is 7
8 dichotomous-buy/not buy, alive/dead and several groups of subjects are exposed to different levels of some stimulus. For each stimulus level, the data must contain counts of the totals exposed and the totals responding. If the response variable is dichotomous but you do not have groups of subjects with the same values for the independent variables, one should use the Logistic Regression procedure. Nonlinear estimates nonlinear regression models, including models in which parameters are constrained. The nonlinear regression procedure can be used if one knows the equation whose parameters are to be estimated, and the equation cannot be written as the sum of parameters times some function of the independent variables. In nonlinear regression the parameter estimates are obtained iteratively. If the function is linear, or can be transformed to a linear function, then the Linear Regression procedure should be used. The Loglinear submenu provides general and hierarchical log-linear analysis and logit analysis. 2.6 Classify This submenu provides cluster and discriminant analysis. K-means Cluster performs cluster analysis using an algorithm that can handle large numbers of cases, but that requires you to specify the number of clusters. The goal of cluster analysis is to identify relatively homogeneous groups of cases based on selected characteristics. If the number of clusters to be formed is not known, then Hierarchical Cluster procedure can be used. If the observations are in known groups and one wants to predict group membership based on a set of independent variables, then the Discriminant procedure can be used. Hierarchical Cluster combines cases into clusters hierarchically, using a memoryintensive algorithm that allows you to examine many different solutions easily. Discriminant is used to classify cases into one of several known groups on the basis of various characteristics. To use the Discriminant procedure the dependent variable must have a limited number of distinct categories. Independent variables that are nominal must be recoded to dummy or contrast variables. If the dependent variable has two categories, Logistic Regression can be used. If the dependent variable is continuous one may use Linear Regression. 2.7 Data Reduction This submenu provides factor analysis, correspondence analysis, and optimal scaling. 8
9 Factor is used to identify factors that explain the correlations among a set of variables. Factor analysis is often used to summarize a large number of variables with a smaller number of derived variables, called factors. Distances computes many different measures of similarity, dissimilarity or distance. Many different measures can be used to quantify how much alike or how different two cases or variables are. Similarity measures are constructed so that large values indicate much similarity and small values indicate little similarity. Dissimilarity measures estimate the distance or unlikeness of two cases. A large dissimilarity value tells that two cases or variables are far apart. In order to decide which similarity or dissimilarity measure to use, one must consider the characteristics of the data. Special measures are available for interval data, frequency counts, and binary data. If the cases are to be classified into groups based on similarity or dissimilarity measures, one of the Cluster procedures should be used. The Conjoint submenu provides for the generation and analysis of conjoint designs. 2.8 Scale This submenu provides reliability analysis and multidimensional scaling. 2.9 Nonparametric Tests This submenu provides nonparametric tests for one sample, or for two and more paired or independent samples. Chi-Square is used to test hypotheses about the relative proportion of cases falling into several mutually exclusive groups. For example, if one wants to test the hypotheses that people are equally likely to buy six different brands of cereals, one can count the number buying each of the six brands. Based on the six observed counts Chi-Square procedure could be used to test the hypothesis that all six cereals are equally likely to be bought. The expected proportions in each of the categories don't have to be equal. The hypothetical proportions to be tested should be specified. Binomial is used to test the hypothesis that a variable comes from a binomial population with a specified probability of an event occurring. The variable can have only two values. For example, to test that the probability of an item on the assembly line is defective is one out of ten (p=0.1), take a sample of 300 items and record whether each is defective or not. Then use the binomial procedure to test the hypothesis of interest. Runs is used to test whether the two values of a dichotomous variable occur in a random sequence. The runs test is appropriate only when the order of cases in the data file is meaningful. 1-Sample Kolmogorov-Smirnov is used to compare the observed frequencies of the values of an ordinal variable, such as rated quality of work, against some specified theoretical distribution. It determines the statistical significance of the largest difference between them. In SPSS, the theoretical distribution can be Normal, Uniform or Poisson. 9
10 Alternative tests for normality are available in the Explore procedure, in the Summarize submenu. The P-P and Q-Q plots in the Graphs menu can also be used to examine the assumption of normality. 2-Independent Samples is used to compare the distribution of a variable between two nonrelated groups. Only limited assumptions are needed about the distributions from which the sample are selected. The Mann-Whitney U test is an alternative to the two sample t-test. The actual values of the data are replaced by ranks. The Kolmogorov- Smirnov test is based on the differences between the observed cumulative distributions of the two groups. The Wald-Woflowitz runs tests sorts the data values from smallest to largest and then performs a runs test on the groups numbers. The Moses Test of Extreme Reaction is used to test for differences in range between two groups. K-Independent Samples is used to compare the distribution of a variable between two or more groups. Only limited assumptions are needed about the distributions from which the samples are selected. The Kruskal-Wallis test is an alternative to one-way analysis of variance, with the actual values of the data replaced by ranks. The Median test counts the number of cases in each group that are above and below the combined median, and then performs a chi-square test. 2 Related Samples is used to compare the distribution of two related variables. Only limited assumptions are needed about the distributions from which the samples are selected. The Wilcoxon and Sign tests are nonparametric alternative to the paired samples t-test. The Wilcoxon test is more powerful than the Sign test. McNemar's test is used to determine changes in proportions for related samples. It is often used for "before and after" experimental designs when the dependent variable is dichotomous. For example, the effect of a campaign speech can be tested by analyzing the number of people whose preference for a candidate changed based on the speech. Using McNemar's test you analyze the changes to see if change in both directions is equally likely. K Related Samples is used to compare the distribution of two or more related variables. Only limited assumptions are needed about the distributions from which the samples are selected. The Friedman test is a nonparametric alternative to a single-factor repeated measures analysis of variance. You can use it when the same measurement is obtained on several occasions for a subject. For example, the Friedman test can be used to compare consumer satisfaction of 5 products when each person is asked to rate each of the products on a scale. Cochran's Q test can be used to test whether several dichotomous variables have the same mean. For example, if instead of asking each subject to rate their satisfaction with five products, you asked them for a yes/no response about each, you could use Cochran's test to test the hypothesis that all five products have the same proportion of satisfied users. Kendall's W measures the agreement among raters. Each of your cases corresponds to a rater, each of the selected variables is an item being rated. For example, if you ask a sample of customers to rank 7 ice-cream flavors from least to most liked, you can use Kendall's W to see how closely the customers agree in their ratings. 10
11 2.10 Time Series This submenu provides exponential smoothing, autocorrelated regression, ARIMA, X11 ARIMA, seasonal decomposition, spectral analysis, and related techniques Survival This submenu provides techniques for analyzing the time for some terminal event to occur, including Kaplan-Meier analysis and Cox regression Multiple Response This submenu provides facilities to define and analyze multiple-response or multipledichotomy sets. Weight Estimation estimates a linear regression model with differential weights representing the precision of observations. This command is in the Professional Statistics option. If the variance of the dependent variable is not constant for all of the values of the independent variable, weights which are inversely proportional to the variance of the dependent variable can be incorporated into the analysis. This results in a better solution. The Weight Estimation procedure can also be used to estimate the weights when the variance of the dependent variable is related to the values of an independent variable. If you know the weights for each case you can use the linear regression procedure to obtain a weighted least squares solution. The linear regression procedure provides a large number of diagnostic statistics which help you evaluate how well the model fits your data. 2-Stage Least Squares performs two-stage least squares regression for models in which the error term is related to the predictors. This command is in the Professional Statistics option. For example, if you want to model the demand for a product as a function of price, advertising expenses, cost of the materials, and some economic indicators, you may find that the error term of the model is correlated with one or more of the independent variables. Two-stage least squares allows you to estimate such a model. Correspondence Analysis analyzes correspondence tables (such as crosstabulations) to best measure the distances between categories or between variables. This command is in the Categories option. Homogeneity Analysis is an optimal scaling procedure analogous in some ways to factor analysis, but capable of analyzing categorical or ordinal variables. The technique is also known as multiple correspondence analysis. This command is in the Categories option. Nonlinear Components performs nonlinear principal-components analysis to try to reduce the dimensionality of a set of variables. This command is in the Categories option. Overals performs nonlinear canonical correlation analysis to determine how similar sets of variables are to one another. This command is in the Categories option. 11
12 3. Other Options 3.1 Transform Compute calculates the values for either a new or an existing variable, for all cases or for cases satisfying a logical criterion. Random Number Seed sets the seed used by the pseudo-random number generator to a specific value, so that you can reproduce a sequence of pseudo-random numbers. Count creates a variable that counts the occurrences of the same value(s) in a list of variables for each case. Recode into Same Variables reassigns the values of existing variables or collapses ranges of existing values into new values. Recode into Different Variables reassigns the values of existing variables to new variables or collapses ranges of existing values into new variables. Rank Cases creates new variables containing ranks, normal scores, or similar ranking scores for numeric variables. Automatic Recode reassigns the values of existing variables to consecutive integers in new variables. Create Time Series creates a time-series variable as a function of an existing series, for example, lagged or leading values, differences, cumulative sums. This command is in the Trends option. Replace Missing Values substitutes non-missing values for missing values, using the series mean or one of several time-series functions. This command is in the Trends option. Run Pending Transforms executes transformation commands that are pending due to the Transformation Options setting in the Preferences dialog. 3.2 Utilities Command Index take you to the dialog box for a command if you know its name in the SPSS command language. Fonts lets you choose a font, style, and size for SPSS Data Editor, output, and syntax windows. Variable Information displays the Variables window, which shows information about the variables in your working data file, and allows you to scroll the data editor to a specific variable, or copy variable names to the designated syntax window. File Information displays information about the working data file in the output window. Output Page Titles lets you specify a title and subtitle for output from SPSS. They appear in the page header, if it is displayed. (Preferences in the Edit menu controls the page header.) 12
13 Define Sets defines sets of variables for use in other dialog boxes. Use Sets lets you select which defined sets of variables should appear in the sourcevariable lists of other dialog boxes. Grid Lines turns grid lines on and off in the Data Editor window. This command is available when the Data Editor is active. Value Labels turns on and off the display of Value Labels (instead of actual values) in the Data Editor window. When Value Labels are displayed you can edit data with a pop-up menu of labels. This command is available when the Data Editor is active. Auto New Case turns on and off the automatic creation of new cases by cursor movement below the last case in the Data Editor window. This command is available when the Data Editor is active. Designate Window designates the active window to receive output from SPSS commands (if it is an output window); or to receive commands pasted from dialog boxes (if it is a syntax window). You can also designate a window by clicking the! button on its icon bar. This command is available when an output or syntax window is active. 3.3 Graphs Bar generates a simple, clustered, or stacked bar chart of the data. Line generates a simple or multiple line chart of the data. Area generate a simple or stacked area chart of the data. Pie generates a simple pie chart or a composite bar chart from the data. High-Low plots pairs or triples of values, for example high, low, and closing prices. Pareto creates Pareto charts, bar charts with a line superimposed showing the cumulative sum. Control produces the most commonly-used process-control charts. Boxplot generates boxplots showing the median, interquartile range, outliers, and extreme cases of individual variables. Scatter generates a simple or overlay scatterplot, a scatterplot matrix, or a 3-D scatterplot from the data. Histogram generates a histogram showing the distribution of an individual variable. Normal P-P plots the cumulative proportions of a variable's distribution against the cumulative proportions of the normal distribution. 13
14 Normal Q-Q plots the quantiles of a variable's distribution against the quantiles of the normal distribution. Sequence produces a plot of one or more variables by order in the file, suitable for examining time-series data. Time Series: Autocorrelations calculates and plots the autocorrelation function (ACF) and partial autocorrelation function of one or more series to any specified number of lags, displaying the Box-Ljung statistic at each lag to test the overall hypothesis that the ACF is zero at all lags. Time Series: Cross-correlations calculates and plots the cross-correlation function of two or more series for positive, negative, and zero lags. Time Series: Spectral calculates and plots univariate or bivariate periodograms and spectral density functions, which express variation in a time series (or covariation in two time series) as the sum of a series of sinusoidal components. It can optionally save various components of the frequency analysis as new series. EXERCISES Exercise 1: A Completely Randomised Design was conducted with three treatments A, B, C where treatment A is replicated 6 times and B and C are replicated 4 times. Analyse the data. A B C The above data should be entered as given below in the Data Editor: Treat Yield

![Factor: ] Continue Contrasts.](/docs-images/76/74365005/images/15-1.jpg ".. Coefficients: -1 Add Coefficients: 1 Add Continue [This")
15 SPSS Commands Analyze Compare means One-way ANOVA Yield button [puts yield under Dependent List: ] Treat [puts treat under Factor: ] Continue Contrasts... Coefficients: -1 Add Coefficients: 1 Add Continue [This compares treatment 1 with treatment 2] OK. Output 15
16 Exercise 2: Analyse the data of a 2 3 Factorial Experiment conducted using a randomized complete block design with three replications. The three factors were the fertilizers viz. Nitrogen (N), Phosphorus (P) and Potassium (K). The purpose of the experiment is to determine the effect of different kinds of fertilizers on potato crop yield. The yields under 8 treatment combinations for each of the three randomized blocks are given below: Block-I npk (1) k np p n nk pk Block-II P nk k np (1) npk pk n Block-III P npk nk (1) n k pk np The data for the above layout should be entered in the following manner: Rep N P K Yield SPSS Commands Analyze GLM Yield button [puts yield under Dependent list: ] N [puts N under Factor: ] P K Rep Continue Model... [opens Model dialogue box] Custom Rep. [puts Rep under Model: ] N P K Interaction 16


17 N P [puts N*P under Model: ] [All the interactions can be entered this way] Continue OK. Output 17
18 Exercise 3: Analyse the following 2 3 Factorial-experiment in blocks of 4 plots, involving three fertilizers N, P, K, each at two levels. Replication I Replication II Replication III Block 1 Block 2 Block 3 Block 4 Block 5 Block 6 np 101 p 88 (1) 125 np 115 pk 75 n 53 npk 111 n 90 npk 95 k 95 nk 100 npk 76 (1) 75 pk 115 nk 80 pk 90 (1) 55 p 65 k 55 nk 75 p 100 n 80 np 92 k 82 The data for the above should be entered in the following manner in Data Editor: Rep Block N P K Yield SPSS Commands Analyze GLM Yield button [puts yield under Dependent list: ] N [puts N under Factor: ] P K Rep Block Continue Model... [opens Model dialogue box] Custom Rep. [puts Rep under Model: ] Block N P 18
![K Interaction N P [puts N*P under Model: ] [All the interactions can be entered this way] Continue OK.](/docs-images/76/74365005/images/19-0.jpg "Exercise 4: An experiment on cotton was conducted to study the effect of folliar application of urea in combinations with insecticidal sprays on the cotton yield.")
19 K Interaction N P [puts N*P under Model: ] [All the interactions can be entered this way] Continue OK. Exercise 4: An experiment on cotton was conducted to study the effect of folliar application of urea in combinations with insecticidal sprays on the cotton yield. Six treatments were tried in a 6x6 Latin Square Design. The layout plan and yield is given below: T T T T T T T T T T T T T T T T T T Analyse the data. Enter the data under the following factors: Row Column Treat. Yield and so on... T T T T T T T T T T T T T T T T T T SPSS Commands Analyze GLM Yield button [puts yield under Dependent list: ] Row [puts row under Factor: ] Column Treat. Continue Model... Custom Row [puts row under Model: ] Column Treat. [puts column and treat. under Model: ] Continue OK. 19
, V 2 (IR5), V 3 (C4-C6), V 4 (Peta) - Main plot treatments 2.")
20 Output Exercise 5: An experiment on rice crop was conducted in split plot design with three replications. Factors tried in the experiment are 1. 4 variety of rice crop: V 1 (IR8), V 2 (IR5), V 3 (C4-C6), V 4 (Peta) - Main plot treatments 2. 6 levels of N: N 0 =0, N 1 =60, N 2 =90, N 3 =120, N 4 =150 and N 5 =180 kg N/ha- Sub plot treatments Grain yield data in kg/ha is as given below: GRAIN YIELD Kg/ha VARIETY REP-I REP-II REP-III N 0 (0 Kg N/ha) V V V V N 1 (60 Kg N/ha) V V V V N 2 (90 Kg N/ha) V
 V 1 845 883 881 V 2 622 738 600 V 3 559 712 548 V 4 224 138 201 Analyse the data and draw conclusions.")
21 V V V N 3 (120 Kg N/ha) V V V V N 4 (150 Kg N/ha) V V V V N 5 (180 Kg N/ha) V V V V Analyse the data and draw conclusions. Data Entry in SPSS 21


22 Selection of Variables and Model Output 22

 Output")
23 Syntax for testing mainplot with Error(a) Output of Syntax 23
, average Plant Height (PH), average Number of Green Leaves (NGL) and Yield (Kg./plot). No. PP PH NGL Yield 1 142.00 0.5250 8.20 2.")
24 Exercise 6: The following data pertains to Jowar crop on yield and biometrical characters. The biometrical characters are average Plant Population (PP), average Plant Height (PH), average Number of Green Leaves (NGL) and Yield (Kg./plot). No. PP PH NGL Yield Fit a multiple linear regression equation by taking yield as dependent variable and biometrical characters as explanatory variables. Data Entry 24
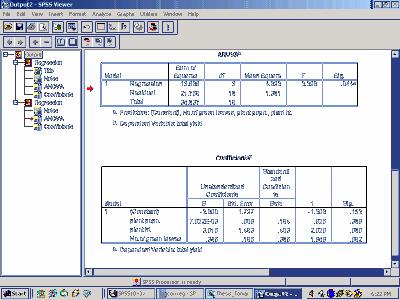
25 Output 25
SPSS: AN OVERVIEW. V.K. Bhatia Indian Agricultural Statistics Research Institute, New Delhi
 SPSS: AN OVERVIEW V.K. Bhatia Indian Agricultural Statistics Research Institute, New Delhi-110012 The abbreviation SPSS stands for Statistical Package for the Social Sciences and is a comprehensive system
Minitab 18 Feature List
 Minitab 18 Feature List * New or Improved Assistant Measurement systems analysis * Capability analysis Graphical analysis Hypothesis tests Regression DOE Control charts * Graphics Scatterplots, matrix
SPSS Modules Features
 SPSS Modules Features Core System Functionality (included in every license) Data access and management Data Prep features: Define Variable properties tool; copy data properties tool, Visual Bander, Identify
Bluman & Mayer, Elementary Statistics, A Step by Step Approach, Canadian Edition
 Bluman & Mayer, Elementary Statistics, A Step by Step Approach, Canadian Edition Online Learning Centre Technology Step-by-Step - Minitab Minitab is a statistical software application originally created
1. Basic Steps for Data Analysis Data Editor. 2.4.To create a new SPSS file
 1 SPSS Guide 2009 Content 1. Basic Steps for Data Analysis. 3 2. Data Editor. 2.4.To create a new SPSS file 3 4 3. Data Analysis/ Frequencies. 5 4. Recoding the variable into classes.. 5 5. Data Analysis/
JMP 10 Student Edition Quick Guide
 JMP 10 Student Edition Quick Guide Instructions presume an open data table, default preference settings and appropriately typed, user-specified variables of interest. RMC = Click Right Mouse Button Graphing
Minitab 17 commands Prepared by Jeffrey S. Simonoff
 Minitab 17 commands Prepared by Jeffrey S. Simonoff Data entry and manipulation To enter data by hand, click on the Worksheet window, and enter the values in as you would in any spreadsheet. To then save
MINITAB Release Comparison Chart Release 14, Release 13, and Student Versions
 Technical Support Free technical support Worksheet Size All registered users, including students Registered instructors Number of worksheets Limited only by system resources 5 5 Number of cells per worksheet
Data Analysis and Solver Plugins for KSpread USER S MANUAL. Tomasz Maliszewski
 Data Analysis and Solver Plugins for KSpread USER S MANUAL Tomasz Maliszewski tmaliszewski@wp.pl Table of Content CHAPTER 1: INTRODUCTION... 3 1.1. ABOUT DATA ANALYSIS PLUGIN... 3 1.3. ABOUT SOLVER PLUGIN...
Organizing Your Data. Jenny Holcombe, PhD UT College of Medicine Nuts & Bolts Conference August 16, 3013
 Organizing Your Data Jenny Holcombe, PhD UT College of Medicine Nuts & Bolts Conference August 16, 3013 Learning Objectives Identify Different Types of Variables Appropriately Naming Variables Constructing
Technical Support Minitab Version Student Free technical support for eligible products
 Technical Support Free technical support for eligible products All registered users (including students) All registered users (including students) Registered instructors Not eligible Worksheet Size Number
Product Catalog. AcaStat. Software
 Product Catalog AcaStat Software AcaStat AcaStat is an inexpensive and easy-to-use data analysis tool. Easily create data files or import data from spreadsheets or delimited text files. Run crosstabulations,
Learn What s New. Statistical Software
 Statistical Software Learn What s New Upgrade now to access new and improved statistical features and other enhancements that make it even easier to analyze your data. The Assistant Data Customization
8. MINITAB COMMANDS WEEK-BY-WEEK
 8. MINITAB COMMANDS WEEK-BY-WEEK In this section of the Study Guide, we give brief information about the Minitab commands that are needed to apply the statistical methods in each week s study. They are
Mean Tests & X 2 Parametric vs Nonparametric Errors Selection of a Statistical Test SW242
 Mean Tests & X 2 Parametric vs Nonparametric Errors Selection of a Statistical Test SW242 Creation & Description of a Data Set * 4 Levels of Measurement * Nominal, ordinal, interval, ratio * Variable Types
Nuts and Bolts Research Methods Symposium
 Organizing Your Data Jenny Holcombe, PhD UT College of Medicine Nuts & Bolts Conference August 16, 3013 Topics to Discuss: Types of Variables Constructing a Variable Code Book Developing Excel Spreadsheets
Brief Guide on Using SPSS 10.0
 Brief Guide on Using SPSS 10.0 (Use student data, 22 cases, studentp.dat in Dr. Chang s Data Directory Page) (Page address: http://www.cis.ysu.edu/~chang/stat/) I. Processing File and Data To open a new
JMP Book Descriptions
 JMP Book Descriptions The collection of JMP documentation is available in the JMP Help > Books menu. This document describes each title to help you decide which book to explore. Each book title is linked
Table Of Contents. Table Of Contents
 Statistics Table Of Contents Table Of Contents Basic Statistics... 7 Basic Statistics Overview... 7 Descriptive Statistics Available for Display or Storage... 8 Display Descriptive Statistics... 9 Store
SPSS. (Statistical Packages for the Social Sciences)
") Inger Persson SPSS (Statistical Packages for the Social Sciences) SHORT INSTRUCTIONS This presentation contains only relatively short instructions on how to perform basic statistical calculations in SPSS.
Inger Persson SPSS (Statistical Packages for the Social Sciences) SHORT INSTRUCTIONS This presentation contains only relatively short instructions on how to perform basic statistical calculations in SPSS.
UNIT 4. Research Methods in Business
 UNIT 4 Preparing Data for Analysis:- After data are obtained through questionnaires, interviews, observation or through secondary sources, they need to be edited. The blank responses, if any have to be
Introduction. About this Document. What is SPSS. ohow to get SPSS. oopening Data
 Introduction About this Document This manual was written by members of the Statistical Consulting Program as an introduction to SPSS 12.0. It is designed to assist new users in familiarizing themselves
An introduction to SPSS
 An introduction to SPSS To open the SPSS software using U of Iowa Virtual Desktop... Go to https://virtualdesktop.uiowa.edu and choose SPSS 24. Contents NOTE: Save data files in a drive that is accessible
Further Maths Notes. Common Mistakes. Read the bold words in the exam! Always check data entry. Write equations in terms of variables
 Further Maths Notes Common Mistakes Read the bold words in the exam! Always check data entry Remember to interpret data with the multipliers specified (e.g. in thousands) Write equations in terms of variables
Forfattere Intro to SPSS 19.0 Description
 Forfattere Nicholas Fritsche Rasmus Porsgaard Casper Voigt Rasmussen Martin Klint Hansen Morten Christoffersen Ulrick Tøttrup Niels Yding Sørensen Morten Mondrup Andreassen Jesper Pedersen Intro to SPSS
Excel 2010 with XLSTAT
 Excel 2010 with XLSTAT J E N N I F E R LE W I S PR I E S T L E Y, PH.D. Introduction to Excel 2010 with XLSTAT The layout for Excel 2010 is slightly different from the layout for Excel 2007. However, with
Ivy s Business Analytics Foundation Certification Details (Module I + II+ III + IV + V)
") Ivy s Business Analytics Foundation Certification Details (Module I + II+ III + IV + V) Based on Industry Cases, Live Exercises, & Industry Executed Projects Module (I) Analytics Essentials 81 hrs 1. Statistics
Ivy s Business Analytics Foundation Certification Details (Module I + II+ III + IV + V) Based on Industry Cases, Live Exercises, & Industry Executed Projects Module (I) Analytics Essentials 81 hrs 1. Statistics
STATISTICS (STAT) Statistics (STAT) 1
 Statistics (STAT) 1") Statistics (STAT) 1 STATISTICS (STAT) STAT 2013 Elementary Statistics (A) Prerequisites: MATH 1483 or MATH 1513, each with a grade of "C" or better; or an acceptable placement score (see placement.okstate.edu).
Statistics (STAT) 1 STATISTICS (STAT) STAT 2013 Elementary Statistics (A) Prerequisites: MATH 1483 or MATH 1513, each with a grade of "C" or better; or an acceptable placement score (see placement.okstate.edu).
IBM SPSS Statistics Traditional License packages and features
 IBM SPSS Statistics Traditional License packages and features 1 2 3 The includes the following features: Data access and management Compare two data files for compatibility Data prep features: Define Variable
Base package The Base subscription includes the following features:
 IBM SPSS Statistics Subscription: Base, add-ons and features 1 2 3 Base package The Base subscription includes the following features: Data access and management Compare two data files for compatibility
IBM SPSS Categories 23
 IBM SPSS Categories 23 Note Before using this information and the product it supports, read the information in Notices on page 55. Product Information This edition applies to version 23, release 0, modification
Applied Regression Modeling: A Business Approach
 i Applied Regression Modeling: A Business Approach Computer software help: SAS SAS (originally Statistical Analysis Software ) is a commercial statistical software package based on a powerful programming
Statistical Package for the Social Sciences INTRODUCTION TO SPSS SPSS for Windows Version 16.0: Its first version in 1968 In 1975.
 Statistical Package for the Social Sciences INTRODUCTION TO SPSS SPSS for Windows Version 16.0: Its first version in 1968 In 1975. SPSS Statistics were designed INTRODUCTION TO SPSS Objective About the
FreeJSTAT for Windows. Manual
 FreeJSTAT for Windows Manual (c) Copyright Masato Sato, 1998-2018 1 Table of Contents 1. Introduction 3 2. Functions List 6 3. Data Input / Output 7 4. Summary Statistics 8 5. t-test 9 6. ANOVA 10 7. Contingency
Fathom Dynamic Data TM Version 2 Specifications
 Data Sources Fathom Dynamic Data TM Version 2 Specifications Use data from one of the many sample documents that come with Fathom. Enter your own data by typing into a case table. Paste data from other
SAS (Statistical Analysis Software/System)
") SAS (Statistical Analysis Software/System) SAS Adv. Analytics or Predictive Modelling:- Class Room: Training Fee & Duration : 30K & 3 Months Online Training Fee & Duration : 33K & 3 Months Learning SAS:
SAS (Statistical Analysis Software/System) SAS Adv. Analytics or Predictive Modelling:- Class Room: Training Fee & Duration : 30K & 3 Months Online Training Fee & Duration : 33K & 3 Months Learning SAS:
CHAPTER 7 EXAMPLES: MIXTURE MODELING WITH CROSS- SECTIONAL DATA
 Examples: Mixture Modeling With Cross-Sectional Data CHAPTER 7 EXAMPLES: MIXTURE MODELING WITH CROSS- SECTIONAL DATA Mixture modeling refers to modeling with categorical latent variables that represent
Predict Outcomes and Reveal Relationships in Categorical Data
 PASW Categories 18 Specifications Predict Outcomes and Reveal Relationships in Categorical Data Unleash the full potential of your data through predictive analysis, statistical learning, perceptual mapping,
Data Mining Chapter 3: Visualizing and Exploring Data Fall 2011 Ming Li Department of Computer Science and Technology Nanjing University
 Data Mining Chapter 3: Visualizing and Exploring Data Fall 2011 Ming Li Department of Computer Science and Technology Nanjing University Exploratory data analysis tasks Examine the data, in search of structures
Applied Regression Modeling: A Business Approach
 i Applied Regression Modeling: A Business Approach Computer software help: SPSS SPSS (originally Statistical Package for the Social Sciences ) is a commercial statistical software package with an easy-to-use
Basic concepts and terms
 CHAPTER ONE Basic concepts and terms I. Key concepts Test usefulness Reliability Construct validity Authenticity Interactiveness Impact Practicality Assessment Measurement Test Evaluation Grading/marking
Why is Statistics important in Bioinformatics?
 Why is Statistics important in Bioinformatics? Random processes are inherent in evolution and in sampling (data collection). Errors are often unavoidable in the data collection process. Statistics helps
Also, for all analyses, two other files are produced upon program completion.
 MIXOR for Windows Overview MIXOR is a program that provides estimates for mixed-effects ordinal (and binary) regression models. This model can be used for analysis of clustered or longitudinal (i.e., 2-level)
Research Methods for Business and Management. Session 8a- Analyzing Quantitative Data- using SPSS 16 Andre Samuel
 Research Methods for Business and Management Session 8a- Analyzing Quantitative Data- using SPSS 16 Andre Samuel A Simple Example- Gym Purpose of Questionnaire- to determine the participants involvement
Creating a data file and entering data
 4 Creating a data file and entering data There are a number of stages in the process of setting up a data file and analysing the data. The flow chart shown on the next page outlines the main steps that
StatCalc User Manual. Version 9 for Mac and Windows. Copyright 2018, AcaStat Software. All rights Reserved.
 StatCalc User Manual Version 9 for Mac and Windows Copyright 2018, AcaStat Software. All rights Reserved. http://www.acastat.com Table of Contents Introduction... 4 Getting Help... 4 Uninstalling StatCalc...
Statistical Pattern Recognition
 Statistical Pattern Recognition Features and Feature Selection Hamid R. Rabiee Jafar Muhammadi Spring 2014 http://ce.sharif.edu/courses/92-93/2/ce725-2/ Agenda Features and Patterns The Curse of Size and
User Services Spring 2008 OBJECTIVES Introduction Getting Help Instructors
 User Services Spring 2008 OBJECTIVES Use the Data Editor of SPSS 15.0 to to import data. Recode existing variables and compute new variables Use SPSS utilities and options Conduct basic statistical tests.
Table of Contents (As covered from textbook)
") Table of Contents (As covered from textbook) Ch 1 Data and Decisions Ch 2 Displaying and Describing Categorical Data Ch 3 Displaying and Describing Quantitative Data Ch 4 Correlation and Linear Regression
Table of Contents (As covered from textbook) Ch 1 Data and Decisions Ch 2 Displaying and Describing Categorical Data Ch 3 Displaying and Describing Quantitative Data Ch 4 Correlation and Linear Regression
Using the DATAMINE Program
 6 Using the DATAMINE Program 304 Using the DATAMINE Program This chapter serves as a user s manual for the DATAMINE program, which demonstrates the algorithms presented in this book. Each menu selection
STATA 13 INTRODUCTION
 STATA 13 INTRODUCTION Catherine McGowan & Elaine Williamson LONDON SCHOOL OF HYGIENE & TROPICAL MEDICINE DECEMBER 2013 0 CONTENTS INTRODUCTION... 1 Versions of STATA... 1 OPENING STATA... 1 THE STATA
Statistical Pattern Recognition
 Statistical Pattern Recognition Features and Feature Selection Hamid R. Rabiee Jafar Muhammadi Spring 2013 http://ce.sharif.edu/courses/91-92/2/ce725-1/ Agenda Features and Patterns The Curse of Size and
CHAPTER 1 INTRODUCTION
 Introduction CHAPTER 1 INTRODUCTION Mplus is a statistical modeling program that provides researchers with a flexible tool to analyze their data. Mplus offers researchers a wide choice of models, estimators,
Psychology Press is an imprint of the Taylor & Francis Group, an informa business
 First published 2012 by Psychology Press 27 Church Road, Hove, East Sussex BN3 2FA Simultaneously published in the USA and Canada by Psychology Press, 711 Third Avenue, New York NY 10017 Psychology Press
Learner Expectations UNIT 1: GRAPICAL AND NUMERIC REPRESENTATIONS OF DATA. Sept. Fathom Lab: Distributions and Best Methods of Display
 CURRICULUM MAP TEMPLATE Priority Standards = Approximately 70% Supporting Standards = Approximately 20% Additional Standards = Approximately 10% HONORS PROBABILITY AND STATISTICS Essential Questions &
book 2014/5/6 15:21 page v #3 List of figures List of tables Preface to the second edition Preface to the first edition
 book 2014/5/6 15:21 page v #3 Contents List of figures List of tables Preface to the second edition Preface to the first edition xvii xix xxi xxiii 1 Data input and output 1 1.1 Input........................................
Correctly Compute Complex Samples Statistics
 SPSS Complex Samples 15.0 Specifications Correctly Compute Complex Samples Statistics When you conduct sample surveys, use a statistics package dedicated to producing correct estimates for complex sample
Chapter 1. Using the Cluster Analysis. Background Information
 Chapter 1 Using the Cluster Analysis Background Information Cluster analysis is the name of a multivariate technique used to identify similar characteristics in a group of observations. In cluster analysis,
SPSS QM II. SPSS Manual Quantitative methods II (7.5hp) SHORT INSTRUCTIONS BE CAREFUL
 SHORT INSTRUCTIONS BE CAREFUL") SPSS QM II SHORT INSTRUCTIONS This presentation contains only relatively short instructions on how to perform some statistical analyses in SPSS. Details around a certain function/analysis method not covered
SPSS QM II SHORT INSTRUCTIONS This presentation contains only relatively short instructions on how to perform some statistical analyses in SPSS. Details around a certain function/analysis method not covered
Data analysis using Microsoft Excel
 Introduction to Statistics Statistics may be defined as the science of collection, organization presentation analysis and interpretation of numerical data from the logical analysis. 1.Collection of Data
The Power and Sample Size Application
 Chapter 72 The Power and Sample Size Application Contents Overview: PSS Application.................................. 6148 SAS Power and Sample Size............................... 6148 Getting Started:
CHAPTER 2. GENERAL PROGRAM STRUCTURE
 CHAPTER 2. GENERAL PROGRAM STRUCTURE Windows Latent GOLD contains a main window called the Viewer. Viewer. When you estimate a model, all statistical results, tables and plots are displayed in the Viewer.
WELCOME! Lecture 3 Thommy Perlinger
 Quantitative Methods II WELCOME! Lecture 3 Thommy Perlinger Program Lecture 3 Cleaning and transforming data Graphical examination of the data Missing Values Graphical examination of the data It is important
Statistical Pattern Recognition
 Statistical Pattern Recognition Features and Feature Selection Hamid R. Rabiee Jafar Muhammadi Spring 2012 http://ce.sharif.edu/courses/90-91/2/ce725-1/ Agenda Features and Patterns The Curse of Size and
Statistical Good Practice Guidelines. 1. Introduction. Contents. SSC home Using Excel for Statistics - Tips and Warnings
 Statistical Good Practice Guidelines SSC home Using Excel for Statistics - Tips and Warnings On-line version 2 - March 2001 This is one in a series of guides for research and support staff involved in
Fact Sheet No.1 MERLIN
 Fact Sheet No.1 MERLIN Fact Sheet No.1: MERLIN Page 1 1 Overview MERLIN is a comprehensive software package for survey data processing. It has been developed for over forty years on a wide variety of systems,
Minitab detailed
 Minitab 18.1 - detailed ------------------------------------- ADDITIVE contact sales: 06172-5905-30 or minitab@additive-net.de ADDITIVE contact Technik/ Support/ Installation: 06172-5905-20 or support@additive-net.de
Choosing the Right Procedure
 3 CHAPTER 1 Choosing the Right Procedure Functional Categories of Base SAS Procedures 3 Report Writing 3 Statistics 3 Utilities 4 Report-Writing Procedures 4 Statistical Procedures 6 Available Statistical
Right-click on whatever it is you are trying to change Get help about the screen you are on Help Help Get help interpreting a table
 Q Cheat Sheets What to do when you cannot figure out how to use Q What to do when the data looks wrong Right-click on whatever it is you are trying to change Get help about the screen you are on Help Help
Choosing the Right Procedure
 3 CHAPTER 1 Choosing the Right Procedure Functional Categories of Base SAS Procedures 3 Report Writing 3 Statistics 3 Utilities 4 Report-Writing Procedures 4 Statistical Procedures 5 Efficiency Issues
GraphPad Prism Features
 GraphPad Prism Features GraphPad Prism 4 is available for both Windows and Macintosh. The two versions are very similar. You can open files created on one platform on the other platform with no special
CHAPTER 5. BASIC STEPS FOR MODEL DEVELOPMENT
 CHAPTER 5. BASIC STEPS FOR MODEL DEVELOPMENT This chapter provides step by step instructions on how to define and estimate each of the three types of LC models (Cluster, DFactor or Regression) and also
The basic arrangement of numeric data is called an ARRAY. Array is the derived data from fundamental data Example :- To store marks of 50 student
 Organizing data Learning Outcome 1. make an array 2. divide the array into class intervals 3. describe the characteristics of a table 4. construct a frequency distribution table 5. constructing a composite
STATS PAD USER MANUAL
 STATS PAD USER MANUAL For Version 2.0 Manual Version 2.0 1 Table of Contents Basic Navigation! 3 Settings! 7 Entering Data! 7 Sharing Data! 8 Managing Files! 10 Running Tests! 11 Interpreting Output! 11
LAB 1 INSTRUCTIONS DESCRIBING AND DISPLAYING DATA
 LAB 1 INSTRUCTIONS DESCRIBING AND DISPLAYING DATA This lab will assist you in learning how to summarize and display categorical and quantitative data in StatCrunch. In particular, you will learn how to
IBM SPSS Categories. Predict outcomes and reveal relationships in categorical data. Highlights. With IBM SPSS Categories you can:
 IBM Software IBM SPSS Statistics 19 IBM SPSS Categories Predict outcomes and reveal relationships in categorical data Highlights With IBM SPSS Categories you can: Visualize and explore complex categorical
Index. Bar charts, 106 bartlett.test function, 159 Bottles dataset, 69 Box plots, 113
 Index A Add-on packages information page, 186 187 Linux users, 191 Mac users, 189 mirror sites, 185 Windows users, 187 aggregate function, 62 Analysis of variance (ANOVA), 152 anova function, 152 as.data.frame
CREATING SIMULATED DATASETS Edition by G. David Garson and Statistical Associates Publishing Page 1
 Copyright @c 2012 by G. David Garson and Statistical Associates Publishing Page 1 @c 2012 by G. David Garson and Statistical Associates Publishing. All rights reserved worldwide in all media. No permission
Minitab Study Card J ENNIFER L EWIS P RIESTLEY, PH.D.
 Minitab Study Card J ENNIFER L EWIS P RIESTLEY, PH.D. Introduction to Minitab The interface for Minitab is very user-friendly, with a spreadsheet orientation. When you first launch Minitab, you will see
IENG484 Quality Engineering Lab 1 RESEARCH ASSISTANT SHADI BOLOUKIFAR
 IENG484 Quality Engineering Lab 1 RESEARCH ASSISTANT SHADI BOLOUKIFAR SPSS (Statistical package for social science) Originally is acronym of Statistical Package for the Social Science but, now it stands
Quick Start Guide Jacob Stolk PhD Simone Stolk MPH November 2018
 Quick Start Guide Jacob Stolk PhD Simone Stolk MPH November 2018 Contents Introduction... 1 Start DIONE... 2 Load Data... 3 Missing Values... 5 Explore Data... 6 One Variable... 6 Two Variables... 7 All
ECLT 5810 Data Preprocessing. Prof. Wai Lam
 ECLT 5810 Data Preprocessing Prof. Wai Lam Why Data Preprocessing? Data in the real world is imperfect incomplete: lacking attribute values, lacking certain attributes of interest, or containing only aggregate
Math 227 EXCEL / MEGASTAT Guide
 Math 227 EXCEL / MEGASTAT Guide Introduction Introduction: Ch2: Frequency Distributions and Graphs Construct Frequency Distributions and various types of graphs: Histograms, Polygons, Pie Charts, Stem-and-Leaf
Bar Charts and Frequency Distributions
 Bar Charts and Frequency Distributions Use to display the distribution of categorical (nominal or ordinal) variables. For the continuous (numeric) variables, see the page Histograms, Descriptive Stats
STAT 3304/5304 Introduction to Statistical Computing. Introduction to SAS
 STAT 3304/5304 Introduction to Statistical Computing Introduction to SAS What is SAS? SAS (originally an acronym for Statistical Analysis System, now it is not an acronym for anything) is a program designed
SPSS INSTRUCTION CHAPTER 9
 SPSS INSTRUCTION CHAPTER 9 Chapter 9 does no more than introduce the repeated-measures ANOVA, the MANOVA, and the ANCOVA, and discriminant analysis. But, you can likely envision how complicated it can
Correctly Compute Complex Samples Statistics
 PASW Complex Samples 17.0 Specifications Correctly Compute Complex Samples Statistics When you conduct sample surveys, use a statistics package dedicated to producing correct estimates for complex sample
Chapter 5: The beast of bias
 Chapter 5: The beast of bias Self-test answers SELF-TEST Compute the mean and sum of squared error for the new data set. First we need to compute the mean: + 3 + + 3 + 2 5 9 5 3. Then the sum of squared
Introduction to StatsDirect, 15/03/2017 1
 INTRODUCTION TO STATSDIRECT PART 1... 2 INTRODUCTION... 2 Why Use StatsDirect... 2 ACCESSING STATSDIRECT FOR WINDOWS XP... 4 DATA ENTRY... 5 Missing Data... 6 Opening an Excel Workbook... 6 Moving around
STA 570 Spring Lecture 5 Tuesday, Feb 1
 STA 570 Spring 2011 Lecture 5 Tuesday, Feb 1 Descriptive Statistics Summarizing Univariate Data o Standard Deviation, Empirical Rule, IQR o Boxplots Summarizing Bivariate Data o Contingency Tables o Row
Data can be in the form of numbers, words, measurements, observations or even just descriptions of things.
 + What is Data? Data is a collection of facts. Data can be in the form of numbers, words, measurements, observations or even just descriptions of things. In most cases, data needs to be interpreted and
Using SPSS with The Fundamentals of Political Science Research
 Using SPSS with The Fundamentals of Political Science Research Paul M. Kellstedt and Guy D. Whitten Department of Political Science Texas A&M University c Paul M. Kellstedt and Guy D. Whitten 2009 Contents
Advanced Analytics with Enterprise Guide Catherine Truxillo, Ph.D., Stephen McDaniel, and David McNamara, SAS Institute Inc.
 Advanced Analytics with Enterprise Guide Catherine Truxillo, Ph.D., Stephen McDaniel, and David McNamara, SAS Institute Inc., Cary, NC ABSTRACT From SAS/STAT to SAS/ETS to SAS/QC to SAS/GRAPH, Enterprise
Your Name: Section: INTRODUCTION TO STATISTICAL REASONING Computer Lab #4 Scatterplots and Regression
 Your Name: Section: 36-201 INTRODUCTION TO STATISTICAL REASONING Computer Lab #4 Scatterplots and Regression Objectives: 1. To learn how to interpret scatterplots. Specifically you will investigate, using
Exploring Data. This guide describes the facilities in SPM to gain initial insights about a dataset by viewing and generating descriptive statistics.
 This guide describes the facilities in SPM to gain initial insights about a dataset by viewing and generating descriptive statistics. 2018 by Minitab Inc. All rights reserved. Minitab, SPM, SPM Salford
WolStat: A new statistics package for the behavioral and social sciences
 Behavior Research Methods 2008, 40 (I), 94-101 doi: 10.3758/13RM40.1.94 WolStat: A new statistics package for the behavioral and social sciences ALLEN H. WOLACH Illinois Institute of Technology, Chicago,
Vocabulary. 5-number summary Rule. Area principle. Bar chart. Boxplot. Categorical data condition. Categorical variable.
 5-number summary 68-95-99.7 Rule Area principle Bar chart Bimodal Boxplot Case Categorical data Categorical variable Center Changing center and spread Conditional distribution Context Contingency table
SAS Visual Analytics 8.2: Working with Report Content
 SAS Visual Analytics 8.2: Working with Report Content About Objects After selecting your data source and data items, add one or more objects to display the results. SAS Visual Analytics provides objects
IBMSPSSSTATL1P: IBM SPSS Statistics Level 1
 SPSS IBMSPSSSTATL1P IBMSPSSSTATL1P: IBM SPSS Statistics Level 1 Version: 4.4 QUESTION NO: 1 Which statement concerning IBM SPSS Statistics application windows is correct? A. At least one Data Editor window
MHPE 494: Data Analysis. Welcome! The Analytic Process
 MHPE 494: Data Analysis Alan Schwartz, PhD Department of Medical Education Memoona Hasnain,, MD, PhD, MHPE Department of Family Medicine College of Medicine University of Illinois at Chicago Welcome! Your