Quick Start Guide Jacob Stolk PhD Simone Stolk MPH November 2018
|
|
|
- Brendan Hardy
- 5 years ago
- Views:
Transcription

1 Quick Start Guide Jacob Stolk PhD Simone Stolk MPH November 2018
2 Contents Introduction... 1 Start DIONE... 2 Load Data... 3 Missing Values... 5 Explore Data... 6 One Variable... 6 Two Variables... 7 All Variables... 9 Recode Data Numerical to Categorical Categorical to Categorical Deleting Recoded Variables Analyse Data Learn Network Structure Calculate Conditional Probabilities Edit Network Structure Fit Parameters Save Data... 23
3 Introduction Data analysis with DIONE is typically done in four main steps: 1. load the data to be analysed 2. explore the data using standard statistical tools to get a better intuition of data characteristics, trends, relationships, etc. 3. recode data, if needed: example transform numerical data to categorical data or group categories of categorical data to new categories 4. analyse the data using sophisticated data analysis algorithms; at present learning of Bayesian networks from data and inference using these networks are implemented This guide shows and explains these steps with a simple demonstration data set with fictitious data on variables such as having visited a country with a high incidence of tuberculosis, smoking, age, having the diseases of tuberculosis or lung cancer, and X-ray results. 1
4 Start DIONE To launch DIONE, double-click the DIONE desktop icon or select DIONE in the Windows Start Menu - All Programs. The start screen looks like this, with the Dashboard tab selected: The other tabs are Explore and Graphical Model. In the Dashboard tab there are two tables: after loading data the Variables table will show the variable names and the Data table will show data of selected variables. At the top right hand side there are visual representations of selected data, and at the bottom right hand side there is a table with frequency distributions and test results of selected data. At the top of the screen there is a toolbar with buttons for loading and saving data and for data analysis. To the right of the buttons there is an area displaying messages about what the program is doing (in light blue), including possible error messages (in red). 2


5 Load Data In the current version only data loading from CSV files is supported and it is assumed that column headers of the CSV data file contain variable names. To load data from a CSV file, press button Load Data and in the Open Data File dialog choose the data file you wish to analyse. In this guide the file healthdemo.csv is used: Now you see the variable names (column headers in the CSV file) in the Variables table at the left of the screen: 3
.")
6 Select the variables you want to analyse (possibly all) by clicking on a variable name and using Ctrl-click and/or Shift-click for multiple selection. If there are many variables, you can easily locate desired variables by typing part of their names in the <filter> field (clearing the <filter> field shows all variables again). You can now see data corresponding to the selected variables in the Data table in the middle of the screen: If you want to remove one or more of the selected variables from the analysis, right-click on the column headers of these variables and press button Clear Selection: You can also press button Clear All to remove all variables from the Data table and start again selecting variables form the Variables table. 4


7 Missing Values The default code for missing values is NA. If your data have a different code for missing values, you can set that code in the <missing> field by typing the desired code and pressing the Enter key: You can also set a code for a specific variable in the Variables table row for that variable: 5
8 Explore Data Before proceeding to sophisticated data analysis, it is usually a good idea to explore the data with relatively simple tools to develop a better understanding of their characteristics. With DIONE it is simple to explore data by looking at one variable at a time or by comparing two variables, so data exploration is limited to univariate and bivariate methods: frequency tables, bar charts, histograms, scatter plots and calculation of chi-square tests and risk ratios with p-values. To make it easy to decide which variables are most interesting for multivariate analysis, it is also possible to obtain bivariate comparisons between all variables. Multivariate analysis in the current version of DIONE is done by learning a Bayesian network from the data value of the variables of interest, which will be represented by nodes in the network. The learned network can then be used for inference. One Variable Select a variable in the Data table, by clicking anywhere in its data column, to see a bar chart and/or histogram and a frequency table of this variable s data at the right of the screen: For categorical or ordinal variables a bar chart is shown. For numerical variables a histogram is shown and under the frequency data in the frequency table their mean, median and standard deviation are shown. Notes: While a variable is selected, it cannot be removed from the analysis by right-clicking on its column header; if you want to remove it, first ensure the variable is not selected, i.e. the variable s data are not highlighted. To deselect all variables, click in the id column. 6


9 This example from the same data set also shows a histogram for a numerical variable: Two Variables Select any pair of variables, using Ctrl-click anywhere in the second data column, to compare two variables, with results in the bar chart, as well as a two way frequency table: 7
. The risk ratio is also calculated with corresponding confidence interval and p-values.")
: Their correlation coefficient is shown in the")
10 The chi square p-value indicates the significance of the relation between the variables (the lower the p-value, the more significant). The risk ratio is also calculated with corresponding confidence interval and p-values. A more detailed view of the analysis results is shown in the Explore tab: When two numerical variables are selected, they are compared in a scatter plot, including a linear line of best fit (regression line): Their correlation coefficient is shown in the results table after the frequency data. 8


11 All Variables To obtain bivariate comparisons between all variables, start by selecting one variable as the desired outcome variable, with which all other variables will be compared: Go to the Explore tab and press button Calculate Bivariate Tests under the results table: Scroll to the right in the results table to see the p values of chi square tests of the selected outcome variable and all other variables, ordered from most to least significant association. This allows you to see quickly which variables have the most significant association with the selected outcome variable and so are likely to be of interest for further analysis. For numerical data correlations of all variables with the outcome variable are also calculated. In this case results are ordered first according to increasing p value of the chi square tests, and variables with approximately equal p values (i.e. with difference in p values less than 0.01) are ordered according to decreasing correlation (i.e. higher to lower absolute value of the correlation coefficient). 9
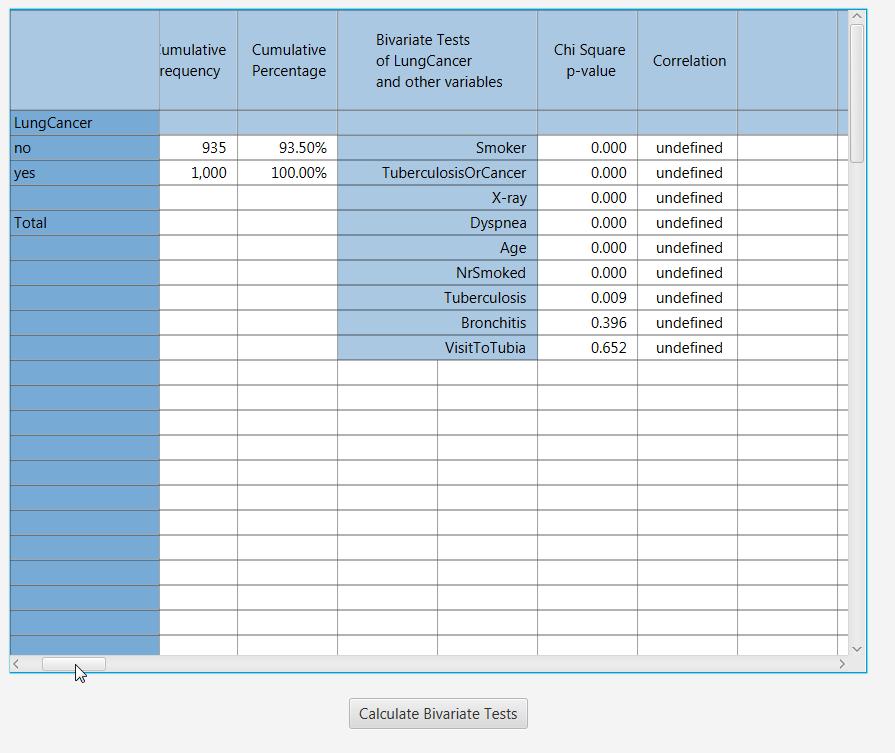
12 10

13 Recode Data The Bayesian network learning algorithms supported by the current version produce the most meaningful results with categorical data. Often numerical data are available, such as age in the second example of the Explore Data section. You can recode such variables to categorical variables in the Explore tab. You can also recode categorical variables to new categorical variables with different categories, typically to reduce the number of categories. Numerical to Categorical For example, we would like to recode the variable Age, which has values from 6 to 83 years old, to a variable with two categories (age groups). When Age is selected in the Dashboard tab, the Explore tab shows this histogram: Type the value 2 in the Number of Bins text field to organize the age data in two categories. The cut off point between the two categories is automatically made, but can be changed by pressing button Change Bins: 11
 (one cut off value for two bins, two for three bins, etc.")
14 In the Recoded Variable Name field a name is proposed for the new variable, which you can accept or change to a name you prefer. In the Bin Borders field, type the desired cut off value(s) (one cut off value for two bins, two for three bins, etc.; the cut off value itself will be in the next higher bin), then press OK: 12


15 The histogram will now look like this: When you are satisfied with the new categories, perform the actual recoding by pressing button Recode Variable. This will create a new variable with the new name, with two categories (<35 and 35): 13


16 Categorical to Categorical An example of recoding a categorical variable to a new categorical variable with different categories is variable MINVOL from data file alarm.csv. When MINVOL is selected in the Dashboard tab, the Explore tab shows this bar chart: 14

17 Now press button Change Categories to map the existing categories of the variable to the desired new categories and optionally give a new name for the recoded variable: 15
18 When you are satisfied with the proposed recoding, press button Recode Variable next to the Change Categories button to actually create the new recoded variable: 16

19 Deleting Recoded Variables Recoding a variable creates a new recoded variable. What if you are not happy with the new variable and you would prefer to delete it? That is possible by clicking the little red cross that is visible next to all recoded variables: Note that this is only possible during the session in which you do the recoding. Saving your data to a file will save recoded variables in the same way as other variables, so when later reloading a file with recoded variables, there are treated in the same way as all other variables and can no longer be deleted from DIONE. You could of course edit the data file with another program such as Excel if you really want to delete some data. 17

20 Analyse Data Ensure that the variables you want to analyse are selected in the Variables table and shown in the Data table. If you want to change the variables to analyse, change the selected variables as explained under Load Data. Learn Network Structure Now press button Learn Structure to learn a Bayesian network from the selected data. The result should look something like this: In the learned Bayesian network, nodes represent variables and arrows represent possible causal relations between variables. Directed lines, with arrows, represent possible causal relations including the direction of causality, while undirected lines, without arrows, represent possible causal relations with unspecified causal direction. If there is no significant association between two variables, there is no line between their nodes. Calculate Conditional Probabilities More information about these relations can be gained by fitting parameters of the network to obtain conditional probability tables, showing the probability of values of a node given values of its parent nodes. The parameter fitting algorithm requires that the graph is directed, i.e. no undirected arrows are present. If there are undirected arrows (or arrows that do not make sense to you), first edit the network structure as explained hereafter. 18

21 Edit Network Structure If undirected arrows are present in the learned network, you can give them a direction by selecting an arrow (clicking on the line of the arrow) and pushing the D key on your keyboard, possibly several times until the arrow has the direction you want: In this way you can also change the direction of already directed arrows if their direction does not make sense to you. Similarly, you can delete arrows with the Delete key: 19
22 To add a new arrow between two nodes, first hover with the cursor over the node that is considered the cause and where the arrow is to start, such that the cursor is a hand and there is a green frame around the node: Now press the left mouse button and move the mouse to draw an arrow to the node that is considered the effect and where the arrow is to end: When there is a green frame around the effect node, release the mouse button. 20


23 Fit Parameters When you are done editing network connections and the graph is completely directed, i.e. there are no undirected edges present, you can calculate conditional probabilities and other parameters by pressing button Fit Parameters. When the algorithm has finished, right-click on any node to see its conditional probability table, showing probabilities given the values of its parents: Right-click on any arrow to see its strength (a measure of the strength of evidence for the relation and its direction, with a maximum of 1 and minimum of 0): 21

24 Now you can perform inference on the Bayesian network by setting evidence on one or more nodes, then recomputing marginal probabilities to see the effect of the evidence on the other nodes: 22

25 Save Data In the current version only data saving to CSV files is supported and in the saved CSV file column headers contain variable names, with values in the columns. The saved data file will have all original data and any recoded data, for example the recoded Age variable here: Note that the saved data file will have the data of recoded variables, but recoded variables are now considered normal variables, so can no longer be deleted in DIONE after reopening the new data file. To save data to a CSV file, press button Save Data and in the Save Data File dialog enter a name for the data file you wish to create: 23
1. Basic Steps for Data Analysis Data Editor. 2.4.To create a new SPSS file
 1 SPSS Guide 2009 Content 1. Basic Steps for Data Analysis. 3 2. Data Editor. 2.4.To create a new SPSS file 3 4 3. Data Analysis/ Frequencies. 5 4. Recoding the variable into classes.. 5 5. Data Analysis/
INSTRUCTIONS FOR USING MICROSOFT EXCEL PERFORMING DESCRIPTIVE AND INFERENTIAL STATISTICS AND GRAPHING
 APPENDIX INSTRUCTIONS FOR USING MICROSOFT EXCEL PERFORMING DESCRIPTIVE AND INFERENTIAL STATISTICS AND GRAPHING (Developed by Dr. Dale Vogelien, Kennesaw State University) ** For a good review of basic
1 Introduction to Using Excel Spreadsheets
 Survey of Math: Excel Spreadsheet Guide (for Excel 2007) Page 1 of 6 1 Introduction to Using Excel Spreadsheets This section of the guide is based on the file (a faux grade sheet created for messing with)
User Services Spring 2008 OBJECTIVES Introduction Getting Help Instructors
 User Services Spring 2008 OBJECTIVES Use the Data Editor of SPSS 15.0 to to import data. Recode existing variables and compute new variables Use SPSS utilities and options Conduct basic statistical tests.
S-PLUS INSTRUCTIONS FOR CASE STUDIES IN THE STATISTICAL SLEUTH
 S-PLUS INSTRUCTIONS FOR CASE STUDIES IN THE STATISTICAL SLEUTH Dan Schafer January, 2002 This guide contains brief instructions for accomplishing the graphical and numerical analyses of the case studies
Survey of Math: Excel Spreadsheet Guide (for Excel 2016) Page 1 of 9
 Page 1 of 9") Survey of Math: Excel Spreadsheet Guide (for Excel 2016) Page 1 of 9 Contents 1 Introduction to Using Excel Spreadsheets 2 1.1 A Serious Note About Data Security.................................... 2 1.2
Survey of Math: Excel Spreadsheet Guide (for Excel 2016) Page 1 of 9 Contents 1 Introduction to Using Excel Spreadsheets 2 1.1 A Serious Note About Data Security.................................... 2 1.2
Introduction to Excel Workshop
 Introduction to Excel Workshop Empirical Reasoning Center September 9, 2016 1 Important Terminology 1. Rows are identified by numbers. 2. Columns are identified by letters. 3. Cells are identified by the
Research Methods for Business and Management. Session 8a- Analyzing Quantitative Data- using SPSS 16 Andre Samuel
 Research Methods for Business and Management Session 8a- Analyzing Quantitative Data- using SPSS 16 Andre Samuel A Simple Example- Gym Purpose of Questionnaire- to determine the participants involvement
Using Large Data Sets Workbook Version A (MEI)
") Using Large Data Sets Workbook Version A (MEI) 1 Index Key Skills Page 3 Becoming familiar with the dataset Page 3 Sorting and filtering the dataset Page 4 Producing a table of summary statistics with
Using Large Data Sets Workbook Version A (MEI) 1 Index Key Skills Page 3 Becoming familiar with the dataset Page 3 Sorting and filtering the dataset Page 4 Producing a table of summary statistics with
Pre-Lab Excel Problem
 Pre-Lab Excel Problem Read and follow the instructions carefully! Below you are given a problem which you are to solve using Excel. If you have not used the Excel spreadsheet a limited tutorial is given
StatCalc User Manual. Version 9 for Mac and Windows. Copyright 2018, AcaStat Software. All rights Reserved.
 StatCalc User Manual Version 9 for Mac and Windows Copyright 2018, AcaStat Software. All rights Reserved. http://www.acastat.com Table of Contents Introduction... 4 Getting Help... 4 Uninstalling StatCalc...
Opening a Data File in SPSS. Defining Variables in SPSS
 Opening a Data File in SPSS To open an existing SPSS file: 1. Click File Open Data. Go to the appropriate directory and find the name of the appropriate file. SPSS defaults to opening SPSS data files with
Introduction. Inserting and Modifying Tables. Word 2010 Working with Tables. To Insert a Blank Table: Page 1
 Word 2010 Working with Tables Introduction Page 1 A table is a grid of cells arranged in rows and columns. Tables can be customized and are useful for various tasks such as presenting text information
Ontario Cancer Profiles User Help File
 Ontario Cancer Profiles User Help File Contents Introduction... 2 Module 1 Tool Overview and Layout... 3 Overview of the tool... 3 Highlights vs. selections... 6 Data suppression or unreliable estimates...
Statistics with a Hemacytometer
 Statistics with a Hemacytometer Overview This exercise incorporates several different statistical analyses. Data gathered from cell counts with a hemacytometer is used to explore frequency distributions
Multivariate Normal Random Numbers
 Multivariate Normal Random Numbers Revised: 10/11/2017 Summary... 1 Data Input... 3 Analysis Options... 4 Analysis Summary... 5 Matrix Plot... 6 Save Results... 8 Calculations... 9 Summary This procedure
Introduction to Excel Workshop
 Introduction to Excel Workshop Empirical Reasoning Center June 6, 2016 1 Important Terminology 1. Rows are identified by numbers. 2. Columns are identified by letters. 3. Cells are identified by the row-column
Subject. Creating a diagram. Dataset. Importing the data file. Descriptive statistics with TANAGRA.
 Subject Descriptive statistics with TANAGRA. The aim of descriptive statistics is to describe the main features of a collection of data in quantitative terms 1. The visualization of the whole data table
Math 227 EXCEL / MEGASTAT Guide
 Math 227 EXCEL / MEGASTAT Guide Introduction Introduction: Ch2: Frequency Distributions and Graphs Construct Frequency Distributions and various types of graphs: Histograms, Polygons, Pie Charts, Stem-and-Leaf
Brief Guide on Using SPSS 10.0
 Brief Guide on Using SPSS 10.0 (Use student data, 22 cases, studentp.dat in Dr. Chang s Data Directory Page) (Page address: http://www.cis.ysu.edu/~chang/stat/) I. Processing File and Data To open a new
SPSS for Survey Analysis
 STC: SPSS for Survey Analysis 1 SPSS for Survey Analysis STC: SPSS for Survey Analysis 2 SPSS for Surveys: Contents Background Information... 4 Opening and creating new documents... 5 Starting SPSS...
San Francisco State University
 San Francisco State University Michael Bar Instructions for Excel 1. Plotting analytical function. 2 Suppose that you need to plot the graph of a function f ( x) = x on the interval [ 5,5]. Step 1: make
Data Management Project Using Software to Carry Out Data Analysis Tasks
 Data Management Project Using Software to Carry Out Data Analysis Tasks This activity involves two parts: Part A deals with finding values for: Mean, Median, Mode, Range, Standard Deviation, Max and Min
SPSS QM II. SPSS Manual Quantitative methods II (7.5hp) SHORT INSTRUCTIONS BE CAREFUL
 SHORT INSTRUCTIONS BE CAREFUL") SPSS QM II SHORT INSTRUCTIONS This presentation contains only relatively short instructions on how to perform some statistical analyses in SPSS. Details around a certain function/analysis method not covered
SPSS QM II SHORT INSTRUCTIONS This presentation contains only relatively short instructions on how to perform some statistical analyses in SPSS. Details around a certain function/analysis method not covered
Minitab 17 commands Prepared by Jeffrey S. Simonoff
 Minitab 17 commands Prepared by Jeffrey S. Simonoff Data entry and manipulation To enter data by hand, click on the Worksheet window, and enter the values in as you would in any spreadsheet. To then save
NAME: BEST FIT LINES USING THE NSPIRE
 NAME: BEST FIT LINES USING THE NSPIRE For this portion of the activity, you will be using the same data sets you just completed where you visually estimated the line of best fit..) Load the data sets into
1. Move your mouse to the location you wish text to appear in the document. 2. Click the mouse. The insertion point appears.
 Word 2010 Text Basics Introduction Page 1 It is important to know how to perform basic tasks with text when working in a word processing application. In this lesson you will learn the basics of working
STATISTICS FOR PSYCHOLOGISTS
 STATISTICS FOR PSYCHOLOGISTS SECTION: JAMOVI CHAPTER: USING THE SOFTWARE Section Abstract: This section provides step-by-step instructions on how to obtain basic statistical output using JAMOVI, both visually
Excel Primer CH141 Fall, 2017
 Excel Primer CH141 Fall, 2017 To Start Excel : Click on the Excel icon found in the lower menu dock. Once Excel Workbook Gallery opens double click on Excel Workbook. A blank workbook page should appear
Excel 2007 New Features Table of Contents
 Table of Contents Excel 2007 New Interface... 1 Quick Access Toolbar... 1 Minimizing the Ribbon... 1 The Office Button... 2 Format as Table Filters and Sorting... 2 Table Tools... 4 Filtering Data... 4
Statistics and Graphics Functions
 Statistics and Graphics Functions Statistics and Graphics Functions Frequency Tables and Diagrams for Variables With the help of the Statistics and Graphics module, MAXQDA can create frequency tables and
How to Create a Box Plot in Excel
 How to Create a Box Plot in Excel Prerequisite knowledge: Box Plot also called a box-and-whisker plot provides a horizontal or vertical graphical representation of a distribution of data where the end
SmartView. User Guide - Analysis. Version 2.0
 SmartView User Guide - Analysis Version 2.0 Table of Contents Page i Table of Contents Table Of Contents I Introduction 1 Dashboard Layouts 2 Dashboard Mode 2 Story Mode 3 Dashboard Controls 4 Dashboards
2. Click the From Beginning command in the Start Slide Show group to start the slide show with the first slide.
 Presenting Slide Show Introduction Page 1 Once your slide show is completed, you will need to learn how to present it to an audience. PowerPoint offers several tools and features that can assist you in
Chapter One: Getting Started With IBM SPSS for Windows
 Chapter One: Getting Started With IBM SPSS for Windows Using Windows The Windows start-up screen should look something like Figure 1-1. Several standard desktop icons will always appear on start up. Note
Also, for all analyses, two other files are produced upon program completion.
 MIXOR for Windows Overview MIXOR is a program that provides estimates for mixed-effects ordinal (and binary) regression models. This model can be used for analysis of clustered or longitudinal (i.e., 2-level)
Microsoft Excel Lab: Data Analysis
 1 Microsoft Excel Lab: The purpose of this lab is to prepare the student to use Excel as a tool for analyzing data taken in other courses. The example used here comes from a Freshman physics lab with measurements
After opening Stata for the first time: set scheme s1mono, permanently
 Stata 13 HELP Getting help Type help command (e.g., help regress). If you don't know the command name, type lookup topic (e.g., lookup regression). Email: tech-support@stata.com. Put your Stata serial
Budget Exercise for Intermediate Excel
 Budget Exercise for Intermediate Excel Follow the directions below to create a 12 month budget exercise. Read through each individual direction before performing it, like you are following recipe instructions.
1. Right-click the worksheet tab you want to rename. The worksheet menu appears. 2. Select Rename.
 Excel 2010 Worksheet Basics Introduction Page 1 Every Excel workbook contains at least one or more worksheets. If you are working with a large amount of related data, you can use worksheets to help organize
Creating a data file and entering data
 4 Creating a data file and entering data There are a number of stages in the process of setting up a data file and analysing the data. The flow chart shown on the next page outlines the main steps that
Installation 3. PerTrac Reporting Studio Overview 4. The Report Design Window Overview 8. Designing the Report (an example) 13
 13") Contents Installation 3 PerTrac Reporting Studio Overview 4 The Report Design Window Overview 8 Designing the Report (an example) 13 PerTrac Reporting Studio Charts 14 Chart Editing/Formatting 17 PerTrac
Contents Installation 3 PerTrac Reporting Studio Overview 4 The Report Design Window Overview 8 Designing the Report (an example) 13 PerTrac Reporting Studio Charts 14 Chart Editing/Formatting 17 PerTrac
Training Guide. Microsoft Excel 2010 Advanced 1 Using Conditional and Custom Formats. Applying Conditional Formatting
 Microsoft Excel 2010 Advanced 1 Using Conditional and Custom Formats Applying Conditional Formatting Excel lets you quickly apply Conditional Formatting to help you explore and analyze data visually, detect
HydroOffice Diagrams
 Hydro Office Software for Water Sciences HydroOffice Diagrams User Manual for Ternary 1.0, Piper 2.0 and Durov 1.0 tool HydroOffice.org Citation: Gregor M. 2013. HydroOffice Diagrams user manual for Ternary1.0,
Introduction to Microsoft Word 2007 Quickguide
 Introduction to Microsoft Word 2007 Quickguide Opening Word -Click the Start button -Click Programs from the start menu -Select Microsoft Office -Click Microsoft Office Word 2007 -A new blank document
Microsoft Word: Steps To Success (The Bare Essentials)
") Microsoft Word: Steps To Success (The Bare Essentials) Workbook by Joyce Kirst 2005 Microsoft Word: Step to Success (The Bare Essentials) Page Contents 1 Starting Word 2 Save 3 Exit 5 Toolbars, Alignment,
Microsoft Word: Steps To Success (The Bare Essentials) Workbook by Joyce Kirst 2005 Microsoft Word: Step to Success (The Bare Essentials) Page Contents 1 Starting Word 2 Save 3 Exit 5 Toolbars, Alignment,
Microsoft. Computer Training Center 1515 SW 10 th Avenue Topeka KS
 Microsoft Computer Training Center 1515 SW 10 th Avenue Topeka KS 66604-1374 785.580.4606 class@tscpl.org www.tscpl.org Microsoft Word 2007 Introduction to Word Processing 1 How to Start Word is a full-featured
Learning Word The ABCs of Microsoft Word. 8/19/2015 The Computor Tutor 1
 Learning Word 2013 The ABCs of Microsoft Word 8/19/2015 The Computor Tutor 1 The Program Open Word Margins are preset to Normal, 1 inch for Top, Bottom, Right & Left; change by clicking on Page Layout
Microsoft MOS-EXP. Microsoft Excel 2002 Core.
 Microsoft MOS-EXP Microsoft Excel 2002 Core http://killexams.com/exam-detail/mos-exp Answer: A, C Cells may be deleted by either selecting Edit, Delete on the Menu bar, or by right-clicking the selected
Technology Assignment: Scatter Plots
 The goal of this assignment is to create a scatter plot of a set of data. You could do this with any two columns of data, but for demonstration purposes we ll work with the data in the table below. You
Quality and Six Sigma Tools using MINITAB Statistical Software: A complete Guide to Six Sigma DMAIC Tools using MINITAB
 Samples from MINITAB Book Quality and Six Sigma Tools using MINITAB Statistical Software A complete Guide to Six Sigma DMAIC Tools using MINITAB Prof. Amar Sahay, Ph.D. One of the major objectives of this
The HOME Tab: Cut Copy Vertical Alignments
 The HOME Tab: Cut Copy Vertical Alignments Text Direction Wrap Text Paste Format Painter Borders Cell Color Text Color Horizontal Alignments Merge and Center Highlighting a cell, a column, a row, or the
Microsoft Word 2007 on Windows
 1 Microsoft Word 2007 on Windows Word is a very popular text formatting and editing program. It is the standard for writing papers and other documents. This tutorial and quick start guide will help you
Session One: MINITAB Basics
 8 Session One: MINITAB Basics, 8-2 Start MINITAB, 8-3 Open a Worksheet, 8-3 Enter Data from the Keyboard, 8-4 Enter Patterned Data, 8-4 Save Your Project, 8-5 Compute Descriptive Statistics, 8-6 Perform
Spreadsheet View and Basic Statistics Concepts
 Spreadsheet View and Basic Statistics Concepts GeoGebra 3.2 Workshop Handout 9 Judith and Markus Hohenwarter www.geogebra.org Table of Contents 1. Introduction to GeoGebra s Spreadsheet View 2 2. Record
Introduction. About this Document. What is SPSS. ohow to get SPSS. oopening Data
 Introduction About this Document This manual was written by members of the Statistical Consulting Program as an introduction to SPSS 12.0. It is designed to assist new users in familiarizing themselves
Tables in Microsoft Word
 Tables in Microsoft Word In this lesson we re going to create and work with Tables in Microsoft Word. Tables are used to improve the organisation and presentation of data in your documents. If you haven
Microsoft Excel 2007 Creating a XY Scatter Chart
 Microsoft Excel 2007 Creating a XY Scatter Chart Introduction This document will walk you through the process of creating a XY Scatter Chart using Microsoft Excel 2007 and using the available Excel features
Excel: Creating Charts and Graphs
 Excel: Creating Charts and Graphs Charts for Excel 2013 1 Charts for Excel 2013 2 Background Information This short workshop is designed to provide an overview for creating and formatting charts and sparklines
Interactive View Instructions
 Interactive View Instructions Definition... 2 Navigator... 2 IView Tool Bar... 3 View Pane... 3 Charting... 4 Charting IView Tasks... 4 Back Charting... 6 Correcting Charting Errors... 6 Copy Documentation...
Contents. Group 2 Excel Handouts 2010
 Contents Styles... 2 Conditional Formatting... 2 Create a New Rule... 4 Format as Table... 5 Create your own New Table Style... 8 Cell Styles... 9 New Cell Style... 10 Merge Styles... 10 Sparklines...
VHIMS QUICK REFERENCE GUIDE TO INCIDENT ANALYSER
 Introduction Incident Analyser allows users with the appropriate permissions to view and create Incident statistical reports based on selected filters and external factors. For example you may wish to
Gradebook Entering, Sorting, and Filtering Student Scores March 10, 2017
 Gradebook Entering, Sorting, and Filtering Student Scores March 10, 2017 1. Entering Student Scores 2. Exclude Student from Assignment 3. Missing Assignments 4. Scores by Class 5. Sorting 6. Show Filters
An introduction to SPSS
 An introduction to SPSS To open the SPSS software using U of Iowa Virtual Desktop... Go to https://virtualdesktop.uiowa.edu and choose SPSS 24. Contents NOTE: Save data files in a drive that is accessible
To learn more about the Milestones window choose: Help Help Topics Select the Index tab and type in the feature. For Example toolbox.
 To learn more about the Milestones window choose: Help Help Topics Select the Index tab and type in the feature. For Example toolbox. 1 of 12 CHOOSE THE DATES TAB TO: 1. Set the schedule s Date Range.
Rev. C 11/09/2010 Downers Grove Public Library Page 1 of 41
 Table of Contents Objectives... 3 Introduction... 3 Excel Ribbon Components... 3 Office Button... 4 Quick Access Toolbar... 5 Excel Worksheet Components... 8 Navigating Through a Worksheet... 8 Making
Minitab Study Card J ENNIFER L EWIS P RIESTLEY, PH.D.
 Minitab Study Card J ENNIFER L EWIS P RIESTLEY, PH.D. Introduction to Minitab The interface for Minitab is very user-friendly, with a spreadsheet orientation. When you first launch Minitab, you will see
Insight: Measurement Tool. User Guide
 OMERO Beta v2.2: Measurement Tool User Guide - 1 - October 2007 Insight: Measurement Tool User Guide Open Microscopy Environment: http://www.openmicroscopy.org OMERO Beta v2.2: Measurement Tool User Guide
Getting to know ESTAT: The Exploratory Spatio-Temporal Analysis Toolkit
 Getting to know ESTAT: The Exploratory Spatio-Temporal Analysis Toolkit ESTAT, the Exploratory Spatio-Temporal Analysis Toolkit is an interactive Geographic Visualization (GeoVisualization) environment
Intermediate Word for Windows
 Intermediate Word for Windows Version: 2002 Academic Computing Support Information Technology Services Tennessee Technological University September 2003 1. Opening Word for Windows In the PC labs, click
Year 10 General Mathematics Unit 2
 Year 11 General Maths Year 10 General Mathematics Unit 2 Bivariate Data Chapter 4 Chapter Four 1 st Edition 2 nd Edition 2013 4A 1, 2, 3, 4, 6, 7, 8, 9, 10, 11 1, 2, 3, 4, 6, 7, 8, 9, 10, 11 2F (FM) 1,
Construction IC User Guide. Analyse Markets.
 Construction IC User Guide Analyse Markets clientservices.construction@globaldata.com https://construction.globaldata.com Analyse Markets Our Market Analysis Tools are designed to give you highly intuitive
Beginner s Guide to Microsoft Excel 2002
 Beginner s Guide to Microsoft Excel 2002 Microsoft Excel lets you create spreadsheets, which allow you to make budgets, track inventories, calculate profits, and design charts and graphs. 1. Open Start
Designed by Jason Wagner, Course Web Programmer, Office of e-learning NOTE ABOUT CELL REFERENCES IN THIS DOCUMENT... 1
 Excel Essentials Designed by Jason Wagner, Course Web Programmer, Office of e-learning NOTE ABOUT CELL REFERENCES IN THIS DOCUMENT... 1 FREQUENTLY USED KEYBOARD SHORTCUTS... 1 FORMATTING CELLS WITH PRESET
BASIC MICROSOFT POWERPOINT
 BASIC MICROSOFT POWERPOINT PART ONE PHONE: 504-838-1144 IT Training Team Jefferson Parish Library EMAIL: jpltrain@jplibrary.net In this class you will learn to: Launch, close, and interact with Microsoft
Using Microsoft Word. Paragraph Formatting. Displaying Hidden Characters
 Using Microsoft Word Paragraph Formatting Every time you press the full-stop key in a document, you are telling Word that you are finishing one sentence and starting a new one. Similarly, if you press
- 1 - Fig. A5.1 Missing value analysis dialog box
 WEB APPENDIX Sarstedt, M. & Mooi, E. (2019). A concise guide to market research. The process, data, and methods using SPSS (3 rd ed.). Heidelberg: Springer. Missing Value Analysis and Multiple Imputation
INTRODUCTION... 1 UNDERSTANDING CELLS... 2 CELL CONTENT... 4
 Introduction to Microsoft Excel 2016 INTRODUCTION... 1 The Excel 2016 Environment... 1 Worksheet Views... 2 UNDERSTANDING CELLS... 2 Select a Cell Range... 3 CELL CONTENT... 4 Enter and Edit Data... 4
Using Tables, Sparklines and Conditional Formatting. Module 5. Adobe Captivate Wednesday, May 11, 2016
 Slide 1 - Using Tables, Sparklines and Conditional Formatting Using Tables, Sparklines and Conditional Formatting Module 5 Page 1 of 27 Slide 2 - Lesson Objectives Lesson Objectives Explore the find and
DEPARTMENT OF HEALTH AND HUMAN SCIENCES HS900 RESEARCH METHODS
 DEPARTMENT OF HEALTH AND HUMAN SCIENCES HS900 RESEARCH METHODS Using SPSS Topics addressed today: 1. Accessing data from CMR 2. Starting SPSS 3. Getting familiar with SPSS 4. Entering data 5. Saving data
Getting Started with JMP at ISU
 Getting Started with JMP at ISU 1 Introduction JMP (pronounced like jump ) is the new campus-wide standard statistical package for introductory statistics courses at Iowa State University. JMP is produced
1. Data Analysis Yields Numbers & Visualizations. 2. Why Visualize Data? 3. What do Visualizations do? 4. Research on Visualizations
 Data Analysis & Business Intelligence Made Easy with Excel Power Tools Excel Data Analysis Basics = E-DAB Notes for Video: E-DAB-05- Visualizations: Table, Charts, Conditional Formatting & Dashboards Outcomes
SPSS. (Statistical Packages for the Social Sciences)
") Inger Persson SPSS (Statistical Packages for the Social Sciences) SHORT INSTRUCTIONS This presentation contains only relatively short instructions on how to perform basic statistical calculations in SPSS.
Inger Persson SPSS (Statistical Packages for the Social Sciences) SHORT INSTRUCTIONS This presentation contains only relatively short instructions on how to perform basic statistical calculations in SPSS.
Excel Main Screen. Fundamental Concepts. General Keyboard Shortcuts Open a workbook Create New Save Preview and Print Close a Workbook
 Excel 2016 Main Screen Fundamental Concepts General Keyboard Shortcuts Open a workbook Create New Save Preview and Print Close a Ctrl + O Ctrl + N Ctrl + S Ctrl + P Ctrl + W Help Run Spell Check Calculate
One does not necessarily have special statistical software to perform statistical analyses.
 Appendix F How to Use a Data Spreadsheet Excel One does not necessarily have special statistical software to perform statistical analyses. Microsoft Office Excel can be used to run statistical procedures.
DataPro Quick Start Guide
 DataPro Quick Start Guide Introduction The DataPro application provides the user with the ability to download and analyze data acquired using the ULTRA-LITE PRO range of Auto Meter products. Please see
Press the Plus + key to zoom in. Press the Minus - key to zoom out. Scroll the mouse wheel away from you to zoom in; towards you to zoom out.
 Navigate Around the Map Interactive maps provide many choices for displaying information, searching for more details, and moving around the map. Most navigation uses the mouse, but at times you may also
LEGENDplex Data Analysis Software Version 8 User Guide
 LEGENDplex Data Analysis Software Version 8 User Guide Introduction Welcome to the user s guide for Version 8 of the LEGENDplex data analysis software for Windows based computers 1. This tutorial will
9 Tables Part I. Session 45: Creating Tables Session 46: Modifying the Layout of Tables Session 47: Formatting the Design of Tables. Unit.
 Unit 9 Tables Part I Session 45: Creating Tables Session 46: Modifying the Layout of Tables Session 47: Formatting the Design of Tables 2 45 Creating Tables Session Objectives Create a table Enter data
MicroStrategy Desktop
 MicroStrategy Desktop Quick Start Guide MicroStrategy Desktop is designed to enable business professionals like you to explore data, simply and without needing direct support from IT. 1 Import data from
How to Use a Statistical Package
 APPENDIX D How to Use a Statistical Package Candace M. Evans, Lisa M. Gilman, Jeffrey Xavier, Joan Saxton Weber Computers and statistical software such as the Statistical Package for the Social Sciences
VIDEO SCREEN EXPLANATION
 INTRODUCTION The Actuarial Laboratory (A.L.) is an interactive, user friendly and powerful software to produce easily and rapidly sophisticated statistical analysis concerning mass risk insurance. The
Applied Systems Client Network SEMINAR HANDOUT. Document Setup in TAM Changing from Office 2003 to 2007, where ARE things now?
 Applied Systems Client Network SEMINAR HANDOUT Document Setup in TAM Changing from Office 2003 to 2007, where ARE things now? Prepared for ASCnet Applied Systems Client Network 801 Douglas Avenue #205
Practical 2: Using Minitab (not assessed, for practice only!)
") Practical 2: Using Minitab (not assessed, for practice only!) Instructions 1. Read through the instructions below for Accessing Minitab. 2. Work through all of the exercises on this handout. If you need
Practical 2: Using Minitab (not assessed, for practice only!) Instructions 1. Read through the instructions below for Accessing Minitab. 2. Work through all of the exercises on this handout. If you need
Tutorials. Lesson 3 Work with Text
 In this lesson you will learn how to: Add a border and shadow to the title. Add a block of freeform text. Customize freeform text. Tutorials Display dates with symbols. Annotate a symbol using symbol text.
Basic Microsoft Excel 2007
 Basic Microsoft Excel 2007 Contents Starting Excel... 2 Excel Window Properties... 2 The Ribbon... 3 Tabs... 3 Contextual Tabs... 3 Dialog Box Launchers... 4 Galleries... 5 Minimizing the Ribbon... 5 The
Frequency tables Create a new Frequency Table
 Frequency tables Create a new Frequency Table Contents FREQUENCY TABLES CREATE A NEW FREQUENCY TABLE... 1 Results Table... 2 Calculate Descriptive Statistics for Frequency Tables... 6 Transfer Results
Day : Date : Objects : Open MS Excel program * Open Excel application. Select : start. Choose: programs. Choose : Microsoft Office.
 Day : Date : Objects : Open MS Excel program * Open Excel application. Select : start Choose: programs Choose : Microsoft Office Select: Excel *The interface of Excel program - Menu bar. - Standard bar.
AEMLog Users Guide. Version 1.01
 AEMLog Users Guide Version 1.01 INTRODUCTION...2 DOCUMENTATION...2 INSTALLING AEMLOG...4 AEMLOG QUICK REFERENCE...5 THE MAIN GRAPH SCREEN...5 MENU COMMANDS...6 File Menu...6 Graph Menu...7 Analysis Menu...8
2016 SPSS Workshop UBC Research Commons
 " 2016 SPSS Workshop #2 @ UBC Research Commons Part 1: Data Management The Select Cases Command Menu: Data Select Cases 1. Option 1- randomly selecting cases Select Random sample of cases, click on Sample,