(Murlidhar Group of Institutions,Bhavnagar Road, Rajkot) by:-assit. Prof. Vijay Vora (SOOADM) MCA-III
|
|
|
- Shon Hancock
- 5 years ago
- Views:
Transcription
1
2 Analysis Modeling
3 What is Analysis Modeling? Analysis modeling uses a combination of text and diagrammatic forms to depict(represent) requirements for data, function, and behavior These text and diagrammatic forms are represent in a way that is relatively easy to understand, and it is also more straightforward to review for correctness, completeness and consistency. In other words, Data modeling is a method used to define and analyze data requirements needed to support and to develop the new system/software. 3
4 The analysis model consists of a wide variety of diagrammatic forms used to bridge an important gap. Purpose: Describe what the customer wants built Establish the foundation for the software Provide a set of validation requirements 4
5 Analysis Model consist three types of Models Data Model ER model Object model Functional model Data flow model Behavioral model State transition model System behavior modeling with sequence diagram 5
6 Data Flow Diagram (Data Flow Approach) (Process Model) (Data Flow Graphs)
7 What is The Data Flow Diagram? A A Data Flow Diagram is a graphically representation of the flow of data. A A Data Flow Diagram (DFD) is a diagrammatic representation of the information flows within a system, that shows: how information enters and leaves the system, what changes the information, where information is stored. So, one can said that,the DFD tracks the data from an original source, carries it through a process, then flows it to a final destination. 7
8 In the DFD, flow is shown as an arrowed line with the arrow-head showing the direction of flow. Each data flow should be uniquely identified by a meaningful descriptive name (caption). Generally, DFD are commonly used during problem analysis. DFD Depict: System inputs Processes outputs 8
9 Purpose of Data Flaw Diagram? [self study] 9
10 Advantages of Data Flaw Diagram A A data flow diagram is an excellent tool for summarizing the information of system DFD organize a detailed information about a system s boundaries, processes, and data entities. It also provide the analyst with a logical map of the system. Documenting the system s boundaries by drawing a context diagram helps the analyst, the user, and the responsible managers to visualize alternative high-level logical system designs. The elements of a data flow diagram lead directly into physical design. 10
11 Disadvantages of Data Flaw Diagram [Self study] 11
12 Symbols of Data Flow Diagram (Elements of Data Flow Diagrams) (Components of Data Flow Diagrams) (Data Flow Diagram Icons)
13 Four primary symbols are used to create a data flow diagram External entities Processes Data stores Data flows 13
14 1. External entities it shows source or destination Sources and destinations define the system s boundaries Where/who Entity identifier Entityname 14
15 A A shape of external entity (source or destination) is represented by a shaded square. They are often beyond the area of influence of the developer. These can represent another system or subsystem. These go on margins/edges of data flow diagram. External entities are named with appropriate name. Thus, the external entities either input information to the system, output information from the system or both. Typically they may represent job titles or other systems that interact with the system to be built. 15

16 2. Processes Processes are work or actions performed on incoming data flows to produce outgoing data flows. Process identifier Process name A shape of Process is represented by a round-cornered rectangle. These show data transformation or change. Data coming into a process must be "worked on" in some way. Thus, all processes must have inputs and outputs. Major functions of processes are computations and making decisions. 16
17 Process Naming convention Processes are named with one carefully chosen verb and an object of the verb. There is no subject. Name is not to include the word "process". Each process should represent one function or action If there is an "and" in the name, then process have more than one function 17
18 3. Data stores Data Stores are repository(storage area) for data that are temporarily or permanently recorded within the system. Data StoreDescription Data Store identifier A A shape of Data Stores is represented by an open- ended, horizontal rectangle. It is an "inventory (record) of data. These are common link between data and process models. Only processes may connect with data stores. 18
19 Data Stores Naming convention Data stores are named with an appropriate name, not to include the word "file. Names should consist of plural nouns describing the collection of data. for e.g. - customers, orders, and products. These may be duplicated. These are detailed in the data dictionary. 19
20 4. Data flows Data flow represents the input or output of data to or from a process ("data in motion"). Data flow A A shape of Data Flow is represented by an arrow in any direction. Data flows only data, not control Data flows must begin and/or end at a process. Data Flow Naming convention Data flows are always named. Name is not to include the word "data". Should be given unique names. Names should be some identifying noun. For example, order, payment, complaint. 20
21 21
22 Steps to develop data flow diagrams (Different Levels of Data Flow Diagrams)
23 Steps to draw Data flow diagram Top-Down approach is use to draw DFD. 1. Make a List of business activity and use it to determine various External entities Data flows Process Data stores 2. Create a Context Diagram this shows external entities and data flows to and from the system, Do not show any detailed processes or data stores. 3. Draw Diagram 0, the next level. Show processes, but keep them general. Show data stores at this level. 4. Create a child diagram for each of the processes in Diagram Check for errors and make sure the labels that assign to each process and data flow are meaningful. 6. Develop a physical data flow diagram from the logical data flow diagram. Distinguish between manual and automates process. Describe actual files and reports by name Add controls to indicate when processes are complete or error occur. 7. Partition the physical data flow diagram by separating or grouping parts of the diagram in order to facilitate programming and implementation. 23
24 Create a Context Diagram (step-2) The highest level (i.e. the 0 level) in a data flow diagram Context diagram is to explain current or proposed system as summary A context diagram documents the system s boundaries by highlighting its sources and destinations Generally, it Contains only one process to represent the entire system Documenting the system s boundaries by drawing a context diagram helps the analyst, the user, and the responsible managers visualize alternative high-level logical system designs. All external entities, as well as Major data flows are shown The diagram does not contain any data stores. 24

25 Figure shows the context level diagram 25
26 Drawing Diagram 0 (step-3) The explosion of the context diagram May include up to nine processes Each process is numbered Major data stores and all external entities are included Data flow diagram 0 shows the system s primary processes, data stores, sources, and destinations linked by data flows. Start with the data flow from an entity on the input side Examine the data flow to or from a data store Analyze a well-defined process Take note of any fuzzy(unclear) areas 26


27 Figure shows the Diagram 0 27
28 Each process start from context level diagram and it may be explode to a next lower level The lower level diagram number is the same as the parent process number Processes that do not create a child diagram are called primitive 28
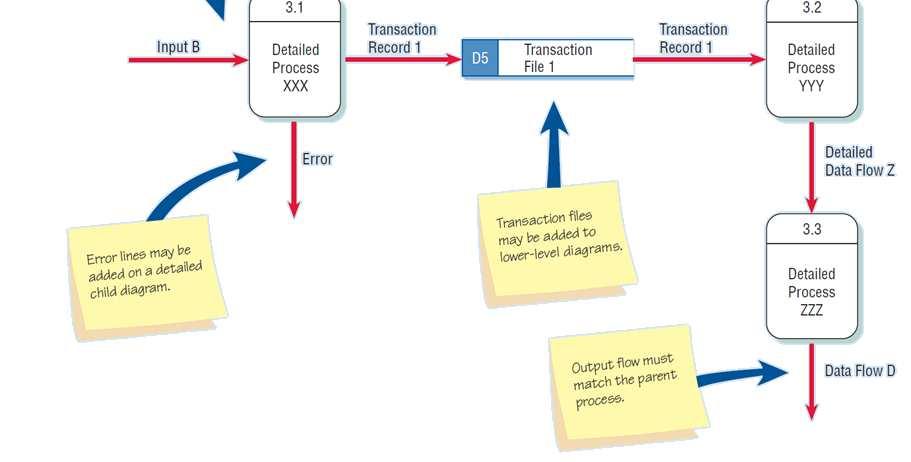
29 Creating Child Diagrams (step-4) Each process on diagram 0 may be exploded to create a child diagram A child diagram cannot produce output or receive input that the parent process does not also produce or receive The child process is given the same number as the parent process Below given figure shows the child Diagram, in which Process 3(in Diagram 0) would explode to next level diagram i.e. Diagram 3 29
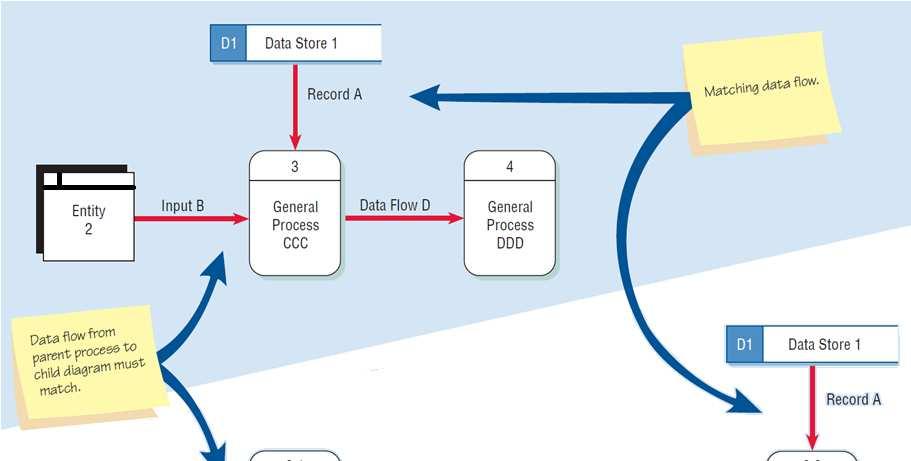
30 30
31 Entities are usually not shown on the child diagrams If the parent process has data flow connecting to a data store, the child diagram may include the data store as well In addition, the lower-level level diagram may contain data stores that are not shown on the parent process. 31
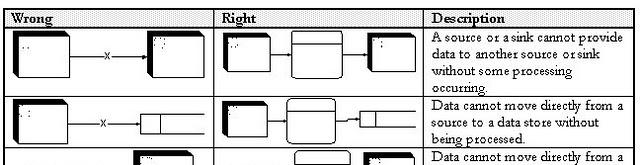
32 Checking the Diagrams for Errors (step-5) Checking errors like Forgetting to include a data flow or pointing an arrow in the wrong direction 32


33 Connecting data stores and external entities directly to each other 33
34 Incorrectly labeling processes or data flow Each object or data flow is properly labeled Data flow described with a verb. Processes should indicate the system name or use the verb-adjective-noun format. Try to not include more than nine processes on a data flow diagram Because having too many processes creates a cluttered diagram that is confusing to read and understand. The next figure shows the payroll example, in that the typical errors can occur in a data flow diagram 34
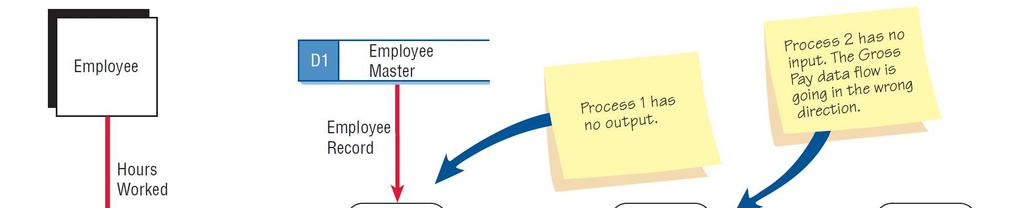
35 35
36 Logical Data Flow Diagrams and Physical Data Flow Diagrams (types of DFD)
37 Logical Data Flow Diagrams Focuses on the business and how the business operates Not concerned with how the system will be constructed Describes the business events that take place and the data required and produced by each event Physical Data Flow Diagrams Shows how the system will be implemented Depicts the system 37
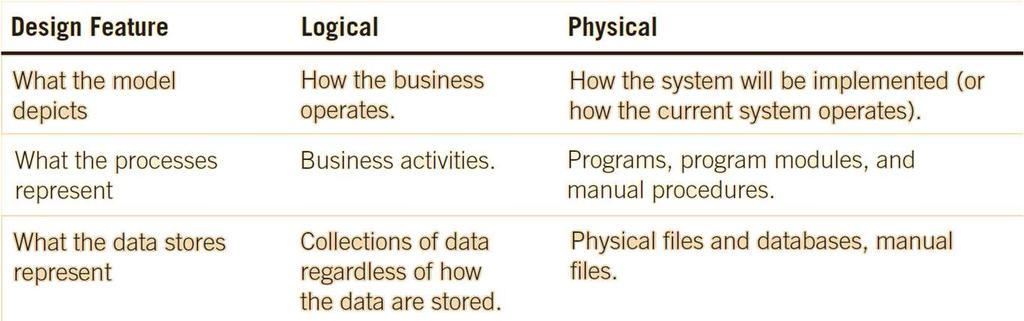
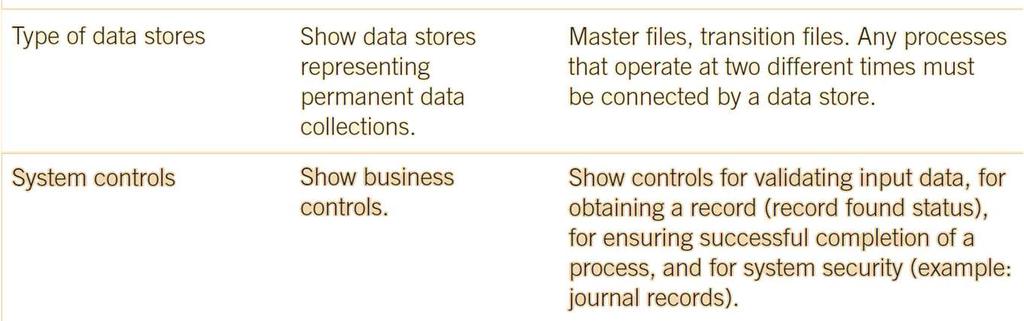
38 38


39 The progression of models from logical to physical 39
40 Advantages of Logical Data Flow Diagrams Advantages of Physical Data Flow Diagrams 40
41 Physical data flow diagrams contain many items not found in logical data flow diagrams 41
42 Self study Event Modeling and Data Flow Diagrams Event Response Tables Use Cases and Data Flow Diagrams Partitioning Data Flow Diagrams Reasons for Partitioning 42
43 Data Dictionaries
44 What is Data Dictionary? Data Dictionary is a Centralized repository of information about data such as meaning, relationships to other data, origin, usage, and format. A A data dictionary allows more precise descriptions of the data to be made Collects and coordinates data terms, and confirms what each term means to different people in the organization 44
45 Need for Understanding the Data Dictionary Provide documentation Eliminate redundancy Validate the data flow diagram Provide a starting point for developing screens and reports Determine the contents of data stored in files To develop the logic for DFD processes 45
46 Data Repository A A data repository is a large collection of project information It includes: Information about the data maintained by the system Procedural logic and use cases Screen and report design Data relationships Project requirements and final system deliverables Project management information 46


47 How data dictionaries relate to data flow diagrams 47
48 Category of Data Dictionary Data flows Data structures Elements Data stores 48
49 Data flows ID - identification number (optional) Unique descriptive name A general description of the data flow The source of the data flow The destination of the data flow Type of data flow The volume per unit time An area for further comments and notations 49
50 An example of a data flow description from World s Trend Catalog Division 50
51 Data structures Data structures are made up of smaller structures and elements An algebraic notation is used to describe data structures»algebraic Notation Equal sign, meaning is composed of Plus sign, meaning "and Braces {} meaning repetitive elements Brackets [] for an either/or situation Parentheses () for an optional element 51


52 Data structure example for adding a customer order at World s Trend Catalog Division 52
53 Another example of Data Structure Student record= student ID + Student name+ Address + Date of birth + Gender + Nationality + Telephone number + (mobile telephone number) + { course record} Course record= course name + Course number+ Grade 53
54 [Self Study] (this points are sub-points of Data Structures)»Structural Records»Use of Structural Records in Different System»Structural Record Example 54
55 »Logical and Physical Data Structures»Logical Show what data the business needs for its day-to-day operations»physical Include additional elements necessary for implementing the system 55
56 Elements Description Element ID The name of the element Aliases A A short description of the element Element is base or derived Element length Type of data Input and output formats Validation criteria Default value An additional comment or remark area 56

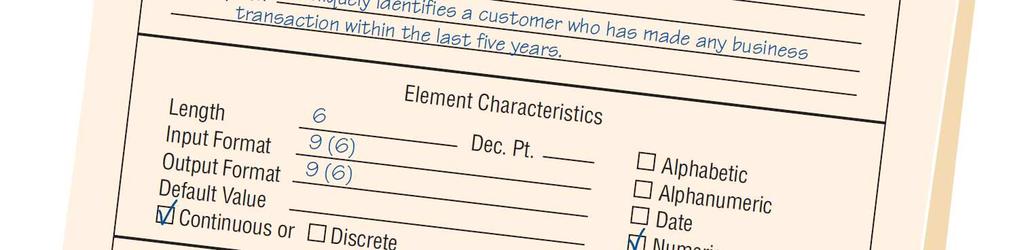


57 Example of an element description form from World s Trend Catalog Division 57
58 Data Stores Description The Data Store ID The Data Store Name An Alias for the table A A short description of the data store File format The maximum and average number of records on the file as well as the growth per year The file or data set name specifies the file name, if known Primary keys Comments 58


59 An example of a data store form for World s Trend Catalog Division 59
60 Creating the Data Dictionary»Data dictionary entries Created after the data flow diagram is completed or Created as the data flow diagram is being developed»created using a top-down approach 60
61 Two data flow diagrams and corresponding data dictionary entries for producing an employee paycheck 61
62 »Analyzing Input and Output A descriptive name for the input or output Whether the data is input or output The format of the data flow Elements indicating the sequence of the data on a report or screen A list of elements 62
63 An example of an input/output analysis form for World s Trend Catalog Division 63
64 »Developing Data Stores Represent data at rest Contain information of a permanent or semipermanent (temporary) nature When data stores are created for only one report or screen, it refer to as an userviews 64
65 Using the Data Dictionary To have maximum power, the data dictionary should be tied into a number of systems programs May be used to Create screens, reports, and forms Generate computer language source code Analyze the system design, detecting flaws and areas that need clarification 65
66 [Self Study] Using Data Dictionaries to Create X M L 66
67 Process Specifications
68 What is Process Specifications? Process Specification is a deep clarification or explanation of primitive processes. Sometimes it called mini-specs, because they are a small portion of the total product specifications Created for primitive processes as well as for some higher level processes on a data flow diagram Process Specifications explain the decision- making logic and formulas that transform process input data into output. 68
69 Purpose/Goal of Process Specifications? Reduce process ambiguity make the analyst to learn details about how the process works. Obtain a precise description of what is accomplished Validate the system design 69
70 When to not create Process Specifications? (Process Specifications are not created ) Processes that represent physical input and/or output Processes that represent simple data validation Processes that use prewritten code 70


71 How Process Specifications relate to the data flow diagram? 71
72 Process Specification Format Information The process number Must match the process ID on the data flow diagram Allows the analyst to work on or review any process, and to locate the data flow diagram containing the process easily The process name The same as displays within the process symbol on the DFD Description of what the process accomplishes (achieve) A A list of input data flow Output data flows Type of process Batch Online Manual Uses prewritten code Include the name of the subprogram or function containing the code Process logic description Logic method reference List any unresolved issues 72
73 example of a completed process specification 73
74 Method of writing process specifications Logic Tools of process specifications Logic/ Structured Decision Analysis 1. Structured English 2. Decision Tables 3. Decision Trees Structured English
75 What is Structured English? Structured English is a method of writing process specifications which is combination of English language and structured programming. This is the only method which provides environment for representing program logic with the natural English language. In short, Structured English is a description of processes in simple English 75
76 The objective of using structured English Expand a DFD so that a user can understand it Develop algorithms corresponding to processes in a DFD Ease writing programs for DFDs 76
77 Writing Structured English Structured English uses 3 basic types of statements to describe processes namely: - 1. Sequential structure. The sequential structured are single declarative statements denoting single step or action in a process. 2. Decision structure. The decision structured allows branching instructions providing YES / NO type decisions. For these decision structures keywords like IF THEN ELSE are used 3. Looping or repetitive structure The repetitive structure allows to specify group of instructions which in to be executed until given conditions are satisfied. Some of the ways of writing repetitive structures are: - DO.. WHILE. REPEAT. UNTIL.etc 77
78 Structured English uses 3 basic types of statements to describe processes namely Use and capitalize accepted keywords such as IF, THEN, ELSE, DO, REPETE etc Indent blocks of statements to show their hierarchy (nesting) clearly Clarify the logical statements 78
79 Examples of logic expressed in a sequential structure, a decision structure, a case structure, and an iteration 79
80 Advantages of Structured English Clarifying the logic and relationships found in human languages An effective communication tool, it can be taught to and understood by users in the organization 80
81 Method of writing process specifications Tools of process specifications 1. Structured English 2. Decision Tables 3. Decision Trees Decision Tables
82 What is Decision Tables Decision table is one of those method which is use for writing process specifications in which shows how a rule or set of rules are applied for repetitive situations. A A table of rows and columns, separated into four quadrants Conditions Condition alternatives Actions to be taken Rules for executing the actions 82


83 The standard format used for presenting a decision table 83

84 Example of decision table Constructing a decision table for deciding which catalog to send to customers who order only from selected catalogs 84

85 Second Example of decision table 85
86 Developing Decision Tables Determine conditions that affect the decision Determine possible actions that can be taken Determine condition alternatives for each condition Calculate the maximum number of columns in the decision table Fill in the condition alternatives Complete table by inserting an X where rules suggest actions Combine rules where it is apparent Rearrange to make more understandable 86
87 Checking for Completeness and Accuracy Four main problems Incompleteness Impossible situations Contradictions Redundancy 87
88 Example shows Contradiction & Redundabcy 88
89 Decision Table Advantages Help the analysis ensure completeness Easy to check for possible errors Impossible situations Contradictions Redundancy 89
90 Method of writing process specifications Tools of process specifications 1. Structured English 2. Decision Tables 3. Decision Trees Decision Trees
91 What is Decision Trees? Decision Tree is a tool of process specification which is used when complex branching occurs in a structured decision process Decision trees are superior to decision tables when sequence of testing conditions is particularly important 91
92 Drawing Decision Trees Identify all conditions and actions and their order and timing (if they are critical) Begin building the tree from left to right, making sure you list all possible alternatives before moving to the right 92
93 Example of decision tree to show the noncash purchase approval actions for a department store 93
94 Decision Tree Advantages The order of checking conditions and executing actions is immediately noticeable Conditions and actions of decision trees are found on the same branches but not on others Compared to decision tables, decision trees are more readily understood by others in the organization 94
95 Which Technique,user have to Select for Structured Decision Analysis or for Process Specification Use structured English when there are many repetitious actions or when communication to end users is important Use decision tables when complex combination of conditions, actions and rules are found, or system require a method that effectively avoids impossible situations, redundancies, and contradictions Use decision trees when the sequence of conditions and actions is critical 95
96 To download material Visit 96
Data Flow Diagrams System Analysis ( (
 7 Data Flow Diagrams System Analysis (1932475( Kendall & Kendall 7-1 Data Flow Diagrams A top down approach to diagramming data movement, it moves from general to specific. Graphically characterize data
Data and Process Modeling
 Chapter 5 Data and Process Modeling 5 CHAPTER Data and Process Modeling Chapter 5 is the second of four chapters in the systems analysis phase of the SDLC. This chapter discusses data and process modeling
17/03/2018. Meltem Özturan
 Meltem Özturan www.mis.boun.edu.tr/ozturan/samd 2 1 Traditional Approach to Requirements Traditional Analysis Model Data flow diagrams Process description Data flow definiton Data store definition (Entity-Relationship
Chapter 6 Structuring System Requirements: Process Modeling 6.1
 Chapter 6 Structuring System Requirements: Process Modeling 6.1 Learning Objectives Explain process modeling Discuss data-flow diagramming mechanics, definitions, and rules Discuss balancing data-flow
1. The narratives, diagrams, charts, and other written materials that explain how a system works are collectively called
 CH 3 MULTIPLE CHOICE 1. The narratives, diagrams, charts, and other written materials that explain how a system works are collectively called a) documentation. b) data flows. c) flowcharts. d) schema.
SOFTWARE ANALYSIS & DESIGN TOOLS
 SOFTWARE ANALYSIS & DESIGN TOOLS http://www.tutorialspoint.com/software_engineering/software_analysis_design_tools.htm Copyright tutorialspoint.com Software analysis and design includes all activities,
CHAPTER 4 Data and Process Modeling (Phase 2: Systems Analysis)
") CHAPTER 4 Data and Process Modeling (Phase 2: Systems Analysis) Jakrapop Maisen DATA FLOW DIAGRAMS A data flow diagram (DFD) shows how data moves through an information system but does not show program
CHAPTER 4 Data and Process Modeling (Phase 2: Systems Analysis) Jakrapop Maisen DATA FLOW DIAGRAMS A data flow diagram (DFD) shows how data moves through an information system but does not show program
Chapter 10. Object-Oriented Analysis and Modeling Using the UML. McGraw-Hill/Irwin
 Chapter 10 Object-Oriented Analysis and Modeling Using the UML McGraw-Hill/Irwin Copyright 2007 by The McGraw-Hill Companies, Inc. All rights reserved. Objectives 10-2 Define object modeling and explain
Analysis and Design for Systems h. 9 th Edition
 Analysis and Design for Systems h 9 th Edition Chapter 5 Data and Process Analysis Chapter Objectives Describe data and process modeling dli concepts and tools, including data flow diagrams, a data dictionary,
Fundamentals of Health Workflow Process Analysis and Redesign
 Fundamentals of Health Workflow Process Analysis and Redesign Unit 10.3d Process Mapping Gane-Sarson Notation Slide 1 Welcome to the Gane-Sarson Notation for Data Flow Diagrams Subunit. This is the third
Lecture Notes. Structured Systems Analysis
 Lecture Notes Structured Systems Analysis Lecture 3 Structured Analysis & Data Flow Diagrams Written by Dr. Fred Grossman Copyright 1999 Fred Grossman All Rights Reserved Structured Systems Analysis Structured
Process Modelling. Data flow Diagrams. Process Modelling Data Flow Diagrams. CSE Information Systems 1
 CSE104 - Information s 1 Process Modelling Data Flow Diagrams Process Modelling Process modelling aims to graphically represent the processes which capture, manipulate, store and distribute data. data
Unit 6 - Software Design and Development LESSON 10 DESIGN TOOLS, INPUTS, OUTPUTS, STORYBOARDS
 Unit 6 - Software Design and Development LESSON 10 DESIGN TOOLS, INPUTS, OUTPUTS, STORYBOARDS Previously Key features of programming languages Software Development Lifecycle Using tools to demonstrate
PROCESS SPECIFICATION
 MODULE 6 PROCESS SPECIFICATIO OBJECTIVE QUESTIOS There are 4 alternative answers to each question. One of them is correct. Pick the correct answer. Do not guess. A key is given at the end of the module
information process modelling DFDs Process description
 Process modelling IMS9300 IS/IM FUNDAMENTALS information process modelling DFDs Process description processes are the action part of businesses process modelling graphically represents the processes which
Slide 1 Welcome to Fundamentals of Health Workflow Process Analysis and Redesign: Process Mapping: Gane-Sarson Notation. This is Lecture d.
 WORKFLOW ANALYSIS Audio Transcript Component 10 Unit 3 Lecture D Fundamentals of Health Workflow Process Analysis & Redesign Interpreting and Creating Process Diagrams Process Mapping Gane-Sarson Notation
INFS 328 Systems Analysis and Design
 INFS 328 Systems Analysis and Design Session 13 Systems Analysis and Construction Tools Lecturer: Prof. Ellis Edwin Badu, Dept. of Information Studies Contact Information: eebadu@ug.edu.gh College of Education
PROBLEM SOLVING AND OFFICE AUTOMATION. A Program consists of a series of instruction that a computer processes to perform the required operation.
 UNIT III PROBLEM SOLVING AND OFFICE AUTOMATION Planning the Computer Program Purpose Algorithm Flow Charts Pseudo code -Application Software Packages- Introduction to Office Packages (not detailed commands
Chapter 9. Process Modeling. McGraw-Hill/Irwin. Copyright 2007 by The McGraw-Hill Companies, Inc. All rights reserved.
 Chapter 9 Process Modeling McGraw-Hill/Irwin Copyright 2007 by The McGraw-Hill Companies, Inc. All rights reserved. Objectives Define systems modeling and differentiate logical and physical models. Define
Data Analysis 1. Chapter 2.1 V3.1. Napier University Dr Gordon Russell
 Data Analysis 1 Chapter 2.1 V3.1 Copyright @ Napier University Dr Gordon Russell Entity Relationship Modelling Overview Database Analysis Life Cycle Components of an Entity Relationship Diagram What is
Overview. What is system analysis and design? Tools and models Methodologies
 Overview What is system analysis and design? Tools and models Methodologies Information Systems What is a system? Why do systems fail? What is systems analysis and design? How do we do systems analysis?
ER DIAGRAM ER) diagram, a graphical representation of entities and their relationships to each other, typically used in computing in regard to the
 diagram, a graphical representation of entities and their relationships to each other, typically used in computing in regard to the") ER DIAGRAM ER) diagram, a graphical representation of entities and their relationships to each other, typically used in computing in regard to the organization of data within databases or information systems.
ER DIAGRAM ER) diagram, a graphical representation of entities and their relationships to each other, typically used in computing in regard to the organization of data within databases or information systems.
MULTIPLE CHOICE. Choose the one alternative that best completes the statement or answers the question.
 Exam Name MULTIPLE CHOICE. Choose the one alternative that best completes the statement or answers the question. 1) A process has a: 1) A) pronoun label B) noun phrase label C) verb phrase label D) adjective
Systems Development and Documentation Techniques. Lecture 2. (Chapter 3)
") Systems Development and Documentation Techniques Lecture 2 (Chapter 3) Introduction This chapter explains the most common systems documentation tools and techniques. 1 Data flow diagrams 2 Document flowcharts
Systems Development and Documentation Techniques Lecture 2 (Chapter 3) Introduction This chapter explains the most common systems documentation tools and techniques. 1 Data flow diagrams 2 Document flowcharts
System Analysis & design
 Assiut University Faculty of Computers and Information System Analysis & design Year 2 Academic Year 2014/ 2015 Term (2) Copyright 2014 Dr. Hossam Ragab 6 data model describes the data that flow through
CSE Information Systems 1
 CSE1204 - Information Systems 1 Detailed Process Definitions; The Data Dictionary Data Dictionary the data dictionary is a database or repository of information about objects identified during systems
System Analysis and Design. Data Flow Diagram. System Analysis and Design
 Data Flow Diagram 1 Data Flow diagram The dataflow diagram is a modeling tool that allows us to picture a system as a network of functional processes, connected to one another by pipelines and holding
System Analysis & design
 Assiut University Faculty of Computers and Information System Analysis & design Year 2 Academic Year 2014/ 2015 Term (2) 5 A PICTURE IS WORTH A 1,000 WORDS A process model is a graphical way of representing
Process Modeling. Wei-Tsong Wang 1 IIM, NCKU
 Process Modeling Based on Chapter 9 of Whitten, Bentley, and Dittman: Systems Analysis and Design for the Global Enterprise (7th Ed). McGraw Hill. 2007 Wei-Tsong Wang 1 IIM, NCKU 2 Models: Logical and
Entity Relationship Modelling
 Entity Relationship Modelling Overview Database Analysis Life Cycle Components of an Entity Relationship Diagram What is a relationship? Entities, attributes, and relationships in a system The degree of
06. Analysis Modeling
 06. Analysis Modeling Division of Computer Science, College of Computing Hanyang University ERICA Campus 1 st Semester 2017 Overview of Analysis Modeling 1 Requirement Analysis 2 Analysis Modeling Approaches
Conceptual Database Design. COSC 304 Introduction to Database Systems. Entity-Relationship Modeling. Entity-Relationship Modeling
 COSC 304 Introduction to Database Systems Entity-Relationship Modeling Dr. Ramon Lawrence University of British Columbia Okanagan ramon.lawrence@ubc.ca Conceptual Database Design Conceptual database design
STRUCTURED SYSTEMS ANALYSIS & DESIGN
 Lecture 5 STRUCTURED SYSTEMS ANALYSIS & DESIGN Objectives Explain SSADM Describe tools of SSADM 2 1 SSADM It is a data (logical) oriented approach to system analysis and design that focuses on nature and
Data Flow Diagrams Examples
 1 of 6 20-Jan-12 1:42 AM Information Systems College of Business Administration University of Missouri - St. Louis Data Flow Diagrams Examples We will study a variety of diagramming tools this semester.
DFD Symbols. Process. Data Store Data Store Data Store
 ? Context Diagram Level 1 Diagram Level 2 Diagram DFD Symbols External Entity Source/Sink User Data Flow Process Process Data Store Data Store Data Store Rule for naming a process: The Joe Test A process
Object-Oriented Systems Analysis and Design Using UML
 10 Object-Oriented Systems Analysis and Design Using UML Systems Analysis and Design, 8e Kendall & Kendall Copyright 2011 Pearson Education, Inc. Publishing as Prentice Hall Learning Objectives Understand
Meltem Özturan
 Meltem Özturan www.mis.boun.edu.tr/ozturan/samd 1 2 Modeling System Requirements Object Oriented Approach to Requirements OOA considers an IS as a set of objects that work together to carry out the function.
Software Engineering Prof.N.L.Sarda IIT Bombay. Lecture-11 Data Modelling- ER diagrams, Mapping to relational model (Part -II)
") Software Engineering Prof.N.L.Sarda IIT Bombay Lecture-11 Data Modelling- ER diagrams, Mapping to relational model (Part -II) We will continue our discussion on process modeling. In the previous lecture
Software Engineering Prof.N.L.Sarda IIT Bombay Lecture-11 Data Modelling- ER diagrams, Mapping to relational model (Part -II) We will continue our discussion on process modeling. In the previous lecture
Common Core State Standards Mathematics (Subset K-5 Counting and Cardinality, Operations and Algebraic Thinking, Number and Operations in Base 10)
") Kindergarten 1 Common Core State Standards Mathematics (Subset K-5 Counting and Cardinality,, Number and Operations in Base 10) Kindergarten Counting and Cardinality Know number names and the count sequence.
Kindergarten 1 Common Core State Standards Mathematics (Subset K-5 Counting and Cardinality,, Number and Operations in Base 10) Kindergarten Counting and Cardinality Know number names and the count sequence.
Requirements Engineering
 Requirements Engineering Semi-Formal Specification: Structural Functional Requirements Structured Analysis Data Flow Diagrams SADT IDEF0 1 Back to the past GO/AO OO SA (DT) DFD SADT IDEF (Back to the future)
Course on Database Design Carlo Batini University of Milano Bicocca
 Course on Database Design Carlo Batini University of Milano Bicocca 1 Carlo Batini, 2015 This work is licensed under the Creative Commons Attribution NonCommercial NoDerivatives 4.0 International License.
Lecture c, Process Mapping: Yourdon Notation for Data Flow Diagrams, covers Yourdon notation for data flow diagrams.
 WORKFLOW ANALYSIS Audio Transcript Component 10 Unit 3 Lecture C Fundamentals of Health Workflow Process Analysis & Redesign Interpreting and Creating Process Diagrams Process Mapping Yourdon Notation
SIF8035. Events and System Requirements
 SIF8035 Lecture 4 DFD and PrM Events and System Requirements Events Occurrences at a specific time and place Trigger all system processing Requirement definition Determine relevant events External events
Solved Question Paper June 2017
 Solved Question Paper June 2017 1.a) What are the benefits of Object Oriented Methodology in real life applications? Briefly explain each element of the state diagram with respect to dynamic modeling.
th Grade Math Curriculum Map
 Standards Quarter 1 Dates Taught (For Teacher Use) Number and Operations in Base Ten Understand the place value system (Major Work) 5.NBT.1 Recognize that in a multi-digit number, a digit in one place
Module 5. Function-Oriented Software Design. Version 2 CSE IIT, Kharagpur
 Module 5 Function-Oriented Software Design Lesson 12 Structured Design Specific Instructional Objectives At the end of this lesson the student will be able to: Identify the aim of structured design. Explain
Requests Charges. Librarian. University affiliated patrons students, faculty, staff. Media Center Staff
 Catherine Rutan INFO 530-901 Dr. Valerie Yonker Circulation of Media Materials from University Media Center: Requests Charges Librarian Circulation Desk Attendant Inquires University ID # (Primary Key)
COSC 304 Introduction to Database Systems. Entity-Relationship Modeling
 COSC 304 Introduction to Database Systems Entity-Relationship Modeling Dr. Ramon Lawrence University of British Columbia Okanagan ramon.lawrence@ubc.ca Conceptual Database Design Conceptual database design
Structured and Object Oriented Analysis and Design
 RAMRAO ADIK INSTITUTE OF TECHNOLOGY, NERUL Department of Computer Engineering Lab Manual Structured and Object Oriented Analysis and Design 2015-2016 List of Experiments Subject: Structured and object
COMP Instructor: Dimitris Papadias WWW page:
 COMP 5311 Instructor: Dimitris Papadias WWW page: http://www.cse.ust.hk/~dimitris/5311/5311.html Textbook Database System Concepts, A. Silberschatz, H. Korth, and S. Sudarshan. Reference Database Management
Software Design. Software design is a blueprint or a plan for a computerbased solution for system
 Software Design Software Design Software design is a blueprint or a plan for a computerbased solution for system Software design deals with transforming the customer requirements, as described by the SRS
Reading material for Unit 1 and Unit 2 for SOOADM (630001)
") Reading material for Unit 1 and Unit 2 for SOOADM (630001) Chapter 1 Information A Key Resource Fuels business and can be the critical factor in determining the success or failure of a business Needs to
Reading material for Unit 1 and Unit 2 for SOOADM (630001) Chapter 1 Information A Key Resource Fuels business and can be the critical factor in determining the success or failure of a business Needs to
Chapter 4: Data Management
 Accounting Information Systems: Essential Concepts and Applications Fourth Edition by Wilkinson, Cerullo, Raval, and Wong-On-Wing Chapter 4: Data Management Slides Authored by Somnath Bhattacharya, Ph.D.
Activity Diagram Written Date : September 02, 2016
 Written Date : September 02, 2016 s describe how activities are coordinated to provide a service which can be at different levels of abstraction. Typically, an event needs to be achieved by some operation,
13/11/2017. Meltem Özturan misprivate.boun.edu.tr/ozturan/mis515
 Meltem Özturan misprivate.boun.edu.tr/ozturan/mis515 2 1 Traditional Approach to Requirements Data Flow Diagram (DFD) A graphical system model that shows all of the main requirements for an information
Full file at Chapter 2: Foundation Concepts
 Chapter 2: Foundation Concepts TRUE/FALSE 1. The input source for the conceptual modeling phase is the business rules culled out from the requirements specification supplied by the user community. T PTS:
Grade K 8 Standards Grade 5
 Grade 5 In grade 5, instructional time should focus on three critical areas: (1) developing fluency with addition and subtraction of fractions, and developing understanding of the multiplication of fractions
Mathematics Grade 5. grade 5 33
 Mathematics Grade 5 In Grade 5, instructional time should focus on three critical areas: (1) developing fluency with addition and subtraction of fractions, and developing understanding of the multiplication
Java How to Program, 9/e. Copyright by Pearson Education, Inc. All Rights Reserved.
 Java How to Program, 9/e Copyright 1992-2012 by Pearson Education, Inc. All Rights Reserved. Copyright 1992-2012 by Pearson Copyright 1992-2012 by Pearson Before writing a program to solve a problem, have
Data. Entities. Accounting Information Systems. Chapter 4: Data Management
 Accounting Information Systems Chapter 4: Data Management Data Data may be defined broadly to include two interrelated components: Data Models that provide structure to data File Orientation Data-base
Modelling as a Communication Tool: Introduction to Process Modelling. Modelling. Simplification in modelling. Representation in modelling
 CSE104 - Information Systems 1 Modelling as a Communication Tool: Introduction to Process Modelling The requirements specification document Must be communicated to key stakeholders Should contain: Functions
MOVING FROM CELL TO CELL
 VCAE: EXCEL Lesson 1 Please send comments to Author: Zahra Siddiqui at zed_ess@hotmail.com Concepts Covered: Cell Address; Cell Pointer; Moving across Cells Constants: Entering, Editing, Formatting Using
Assoc. Prof. Dr. Marenglen Biba. (C) 2010 Pearson Education, Inc. All rights reserved.
 2010 Pearson Education, Inc. All rights reserved.") Assoc. Prof. Dr. Marenglen Biba Before writing a program to solve a problem, have a thorough understanding of the problem and a carefully planned approach to solving it. Understand the types of building
Assoc. Prof. Dr. Marenglen Biba Before writing a program to solve a problem, have a thorough understanding of the problem and a carefully planned approach to solving it. Understand the types of building
Sequence of Grade 5 Modules Aligned with the Standards
 Sequence of Grade 5 Modules Aligned with the Standards Module 1: Place Value and Decimal Fractions Module 2: Multi-Digit Whole Number and Decimal Fraction Operations Module 3: Addition and Subtraction
Chapter 2: Entity-Relationship Model
 Chapter 2: Entity-Relationship Model! Entity Sets! Relationship Sets! Design Issues! Mapping Constraints! Keys! E-R Diagram! Extended E-R Features! Design of an E-R Database Schema! Reduction of an E-R
5th Grade Units (as articulated through Diocese of Tucson ACE Collaborative Curriculum Design 2012) Unit 1: Mathematical Operations with Whole Numbers
 Unit 1: Mathematical Operations with Whole Numbers") 5th Grade Units (as articulated through Diocese of Tucson ACE Collaborative Curriculum Design 2012) Unit 1: Mathematical Operations with Whole Numbers 5.OA.1. Use parentheses, brackets, or braces in numerical
5th Grade Units (as articulated through Diocese of Tucson ACE Collaborative Curriculum Design 2012) Unit 1: Mathematical Operations with Whole Numbers 5.OA.1. Use parentheses, brackets, or braces in numerical
Grade 5. Massachusetts Curriculum Framework for Mathematics 48
 Grade 5 Introduction In grade 5, instructional time should focus on four critical areas: (1) developing fluency with addition and subtraction of fractions, and developing understanding of the multiplication
A l Ain University Of Science and Technology
 A l Ain University Of Science and Technology 4 Handout(4) Database Management Principles and Applications The Entity Relationship (ER) Model http://alainauh.webs.com/ 1 In this chapter, you will learn:
Chapter 3 System Models
 March 16, 2009 Introduction Graphical models aid in requirements and development Introduction Graphical models aid in requirements and development Different perspectives are possible: external: context
Chapter : Analysis Modeling
 Chapter : Analysis Modeling Requirements Analysis Requirements analysis Specifies software s operational characteristics Indicates software's interface with other system elements Establishes constraints
5 th Grade LEUSD Learning Targets in Mathematics
 5 th Grade LEUSD Learning Targets in Mathematics 6/24/2015 The learning targets below are intended to provide a guide for teachers in determining whether students are exhibiting characteristics of being
Database Systems: Design, Implementation, and Management Tenth Edition. Chapter 4 Entity Relationship (ER) Modeling
 Modeling") Database Systems: Design, Implementation, and Management Tenth Edition Chapter 4 Entity Relationship (ER) Modeling 4.1 The Entity Relationship Model (ERM) ER model forms the basis of an ER diagram ERD
Database Systems: Design, Implementation, and Management Tenth Edition Chapter 4 Entity Relationship (ER) Modeling 4.1 The Entity Relationship Model (ERM) ER model forms the basis of an ER diagram ERD
Sequence of Grade 5 Modules Aligned with the Standards
 Sequence of Grade 5 Modules Aligned with the Standards Module 1: Whole Number and Decimal Fraction Place Value to the One-Thousandths Module 2: Multi-Digit Whole Number and Decimal Fraction Operations
Use grouping symbols including parentheses, brackets, or braces in numerical expressions, and evaluate expressions with these symbols
 Operations and Algebraic Thinking AR.Math.Content.5.OA.A.1 AR.Math.Content.5.OA.A.2 Write and interpret numerical expressions Use grouping symbols including parentheses, brackets, or braces in numerical
Objectives. Explain the purpose and objectives of objectoriented. Develop design class diagrams
 Objectives Explain the purpose and objectives of objectoriented design Develop design class diagrams Develop interaction diagrams based on the principles of object responsibility and use case controllers
A Correlation of. to the. Common Core State Standards for Mathematics Bid Category Grade 5
 A Correlation of to the Bid Category 11-010-50 A Correlation of, to the Operations and Algebraic Thinking Write and interpret numerical expressions. [5.OA.A.1]Use parentheses, brackets, or braces in numerical
ABSTRACTION OF DATA FLOW DIAGRAM FOR A C PROGRAM
 International Journal of Operations System and Human Resource Management Vol. 2, Nos. 1-2, January-December 2012, pp. 69 77 International Science Press ABSTRACTION OF DATA FLOW DIAGRAM FOR A C PROGRAM
Fifth Grade Mathematics Goals
 Fifth Grade Mathematics Goals Operations & Algebraic Thinking Standard Mastery Expectations First Trimester Goal Second Trimester Goal Third Trimester Goal 5.OA.1 Use parentheses, brackets, or braces in
DATA MODELS FOR SEMISTRUCTURED DATA
 Chapter 2 DATA MODELS FOR SEMISTRUCTURED DATA Traditionally, real world semantics are captured in a data model, and mapped to the database schema. The real world semantics are modeled as constraints and
Gulfport School District Common Core Pacing Guide Prepared by the Department of Instructional Programs and teachers of the Gulfport School District
 Prepared by the Department of Instructional Programs and teachers of the Mathematics Q Operations and Algebraic Thinking.OA Write and interpret numerical expressions. 1. Use parentheses, brackets, or braces
MODULE 6 PROCESS SPECIFICATION
 MODULE 6 PROCESS SPECIFICATION Learning Units 6.1 Structured English specification 6.2 Decision table based specifications 6.3 Detecting -Incompleteness -Ambiguity -Contradictions -Redundancy in decision
BPMN Getting Started Guide
 Enterprise Studio BPMN Getting Started Guide 2017-09-21 Applies to: Enterprise Studio 3.0.0, Team Server 3.0.0 Table of contents 1 About modeling with BPMN 5 1.1 What is BPMN? 5 1.2 BPMN modeling 5 1.3
We move from a general information system to a Computer Based Information System
 Introduction to Information Systems: In this section of the course we start to think of the computer as just being a component in a system which may contain one or many computers linked together. An Information
Data Process Modeling: Context Diagrams & Data Flow Diagrams (DFDs)
") Introduction Data Process Modeling: Context Diagrams & Data Flow Diagrams (DFDs) MIS 374 When designing/building an information system for an organization, you should consider the following questions regarding
Introduction Data Process Modeling: Context Diagrams & Data Flow Diagrams (DFDs) MIS 374 When designing/building an information system for an organization, you should consider the following questions regarding
Make sense. Reason A & Q
 In Grade 5, instructional time should focus on three critical areas: (1) developing fluency with addition and subtraction of fractions, and developing understanding of the multiplication of fractions and
Database Systems: Design, Implementation, and Management Tenth Edition. Chapter 4 Entity Relationship (ER) Modeling
 Modeling") Database Systems: Design, Implementation, and Management Tenth Edition Chapter 4 Entity Relationship (ER) Modeling Objectives In this chapter, students will learn: The main characteristics of entity relationship
Database Systems: Design, Implementation, and Management Tenth Edition Chapter 4 Entity Relationship (ER) Modeling Objectives In this chapter, students will learn: The main characteristics of entity relationship
5.OA.1 5.OA.2. The Common Core Institute
 Operations and Algebraic Thinking The Common Core Institute Cluster: Write and interpret numerical expressions. 5.OA.1: Use parentheses, brackets, or braces in numerical expressions, and evaluate expressions
Darshan Institute of Engineering & Technology for Diploma Studies
 REQUIREMENTS GATHERING AND ANALYSIS The analyst starts requirement gathering activity by collecting all information that could be useful to develop system. In practice it is very difficult to gather all
Enhanced Entity- Relationship Models (EER)
") Enhanced Entity- Relationship Models (EER) LECTURE 3 Dr. Philipp Leitner philipp.leitner@chalmers.se @xleitix LECTURE 3 Covers Small part of Chapter 3 Chapter 4 Please read this up until next lecture!
Enhanced Entity- Relationship Models (EER) LECTURE 3 Dr. Philipp Leitner philipp.leitner@chalmers.se @xleitix LECTURE 3 Covers Small part of Chapter 3 Chapter 4 Please read this up until next lecture!
Chapter 4. In this chapter, you will learn:
 Chapter Entity Relationship (ER) Modeling Database Systems: Design, Implementation, and Management, Seventh Edition, Rob and Coronel 1 In this chapter, you will learn: The main characteristics of entity
Lab 16: Visio Introduction
 Lab 16: Visio Introduction () CONTENTS 1 Visio- Introduction to DFD Data Flow Diagraming... 2 1.1 In-Lab... 3 1.1.1 In-Lab Materials... 3 1.1.2 In-Lab Instructions... 3 2 Getting started: Let s decompose
FLOWCHARTS A flowchart is a graphical representation of the steps to be followed for solving problem. It consists of a set of symbols.
 FLOWCHARTS A flowchart is a graphical representation of the steps to be followed for solving problem. It consists of a set of symbols. Each symbol represents a specific activity. A typical problem involves
Fifth-grade students performing at the Approaching Expectations level should show a basic understanding of the mathematical concepts and procedures.
 Approaching (0-30) Fifth-grade students performing at the Approaching level should show a basic understanding of the mathematical concepts and procedures. Fifth-graders performing at the Approaching level
Structured Analysis and Design
 1 st Cut - Creating... 14:10 A Actors... 2:11 Additional Notations... 11:17 Alternative Names for the System... 13:15 Analysis - Overview... 1:9 Analysis and Design - Goals... 1:6 Analysis and Design -
DATA Data and information are used in our daily life. Each type of data has its own importance that contribute toward useful information.
 INFORMATION SYSTEM LESSON 41 DATA, INFORMATION AND INFORMATION SYSTEM SMK Sultan Yahya Petra 1 DATA Data and information are used in our daily life. Each type of data has its own importance that contribute
Administrivia. Wednesday: Requirements and Specification. CS169 Lecture 4. We assign teams and you start on Monday. Determining Stakeholders and Needs
 Administrivia Requirements and Specification CS169 Lecture 4 Wednesday: Groups and one-sentence idea(s) due at class One per group If you have a small group, still submit so that you will be kept together.
IMS1002/CSE1205 Lectures 1
 IMS1002/CSE1205 Systems Analysis and Design Lecture 2 & 3 Introduction to Data Modelling Entity Relationship Modelling Data Modelling Focus on the information aspects of the organisation In a database
System Analysis and Design
 System Analysis and Design M Umair www.m-umair.com System Description Techniques Graphical representation of any process is always better and more meaningful than its representation in words. System Analysis
16/06/56. Databases. Databases. Databases The McGraw-Hill Companies, Inc. All rights reserved.
 Distinguish between the physical and logical views of data. Describe how data is organized: characters, fields, records, tables, and databases. Define key fields and how they are used to integrate data
Databases The McGraw-Hill Companies, Inc. All rights reserved.
 Distinguish between the physical and logical views of data. Describe how data is organized: characters, fields, records, tables, and databases. Define key fields and how they are used to integrate data