Process Modeling. Wei-Tsong Wang 1 IIM, NCKU
|
|
|
- Isabella Ward
- 5 years ago
- Views:
Transcription
. McGraw Hill.")
1 Process Modeling Based on Chapter 9 of Whitten, Bentley, and Dittman: Systems Analysis and Design for the Global Enterprise (7th Ed). McGraw Hill Wei-Tsong Wang 1 IIM, NCKU 2
2 Models: Logical and Physical Model a pictorial representation of reality. Just as a picture is worth a thousand words, most models are pictorial representations of reality. Logical model a nontechnical pictorial representation that depicts what a system is or does. Physical model a technical pictorial representation that depicts what a system is or does and how the system is implemented. 3 Why Logical System Models Logical models remove biases that are the result of the way the system is currently implemented, or the way that any one person thinks the system might be implemented. Logical models reduce the risk of missing business requirements because we are too preoccupied with technical results. Logical models allow us to communicate with end-users in nontechnical or less technical languages. 4
 a process model used to depict the flow of data through a system and the work or processing performed by the system.")
3 Process Modeling and DFDs Process modeling a technique used to organize and document a system s processes. Flow of data through processes Logic Policies Procedures Data flow diagram (DFD) a process model used to depict the flow of data through a system and the work or processing performed by the system. Synonyms are bubble chart, transformation graph, and process model. The DFD has also become a popular tool for business process redesign. 5 Simple Data Flow Diagram 6
4 Differences Between DFDs and Flowcharts Processes on DFDs can operate in parallel (at-the-same-time) Processes on flowcharts execute one at a time DFDs show the flow of data through a system Flowcharts show the flow of control (sequence and transfer of control) Processes on a DFD can have dramatically different timing (daily, weekly, on demand) Processes on flowcharts are part of a single program with consistent timing 7 Symbols in DFDs Many set of symbols are used in the industry Generally, there are three commonly used symbols as follows: External Agents Data Stores Processes There is one connection as below: Data Flows 8
5 External Agents External agent an outside person, unit, system, or organization that interacts with a system. Also called an external entity. External agents define the boundary or scope of a system being modeled. As scope changes, external agents can become processes, and vice versa. Almost always one of the following: Office, department, division. An external organization or agency. Another business or another information system. One of system s end-users or managers Named with descriptive, singular noun Gane and Sarson shape DeMarco/Yourdon shape 9 Data Stores Data store stored data intended for later use. Synonyms are file and database. Frequently implemented as a file or database. A data store is data at rest compared to a data flow that is data in motion. Almost always one of the following: Persons (or groups of persons) Places Objects Events (about which data is captured) Concepts (about which data is important) Data stores depicted on a DFD store all instances of data entities (depicted on an ERD) Named with plural noun Gane and Sarson shape 10 DeMarco/Yourdon shape


6 Process Concepts Process work performed by a system in response to incoming data flows or conditions. A synonym is transform. All information systems include processes - usually many of them Processes respond to business events and conditions and transform data into useful information Modeling processes helps us to understand the interactions with the system's environment, other systems, and other processes. Named with a strong action verb followed by object clause describing what the work is performed on/for. Gane and Sarson shape 11 Process Decomposition Decomposition the act of breaking a system into subcomponents. Each level of abstraction reveals more or less detail. 12

7 Decomposition Diagrams Decomposition diagram a tool used to depict the decomposition of a system. Also called hierarchy chart. 13 Logical Processes Logical Processes: work or actions needs to be done no matter how the system is implemented. Three types of logical processes: Function Event Elementary process 14
8 Types of Logical Processes Function a set of related and ongoing activities of a business. A function has no start or end. Event a logical unit of work that must be completed as a whole. Sometimes called a transaction. Triggered by a discrete input and is completed when process has responded with appropriate outputs. Functions consist of processes that respond to events. Elementary process a discrete, detailed activity or task required to complete the response to an event. Also called a primitive process. The lowest level of detail depicted in a process model. 15 Data Flows & Control Flows Data flow data that is input to or output from a process. A data flow is data in motion A data flow may also be used to represent the creation, reading, deletion, or updating of data in a file or database (called a data store). Composite data flow a data flow that consists of other data flows. Control flow a condition or nondata event (e.g. time) that triggers a process. Used sparingly on DFDs. Data flow name Control flow name 16


9 Data Flow Packet Concept Data that should travel together should be shown as a single data flow, no matter how many physical documents might be included. 17 Composite and Elementary Data Flows Composite flow Elementary flows Junction indicates that any given order is an instance of only one of the order types. 18

10 Data Flows to and from Data Stores 19 Rules for Data Flows A data flow should never go unnamed. In logical modeling, data flow names should describe the data flow without describing the implementation All data flows must begin and/or end at a process. 20
11 Data Structures Data attribute the smallest piece of data that has meaning to the users and the business. Data structure a specific arrangement of data attributes that defines an instance of a data flow. The data attributes that comprise a data flow are organized into data structures. Data flows can be described in terms of the following types of data structures: A sequence or group of data attributes that occur one after another (e.g. Address). The selection of one or more attributes from a set of attributes. The repetition of one or more attributes. 21 Data Structure for a Data Flow DATA STRUCTURE ORDER= ORDER NUMBER + ORDER DATE+ [ PERSONAL CUSTOMER NUMBER, CORPORATE ACCOUNT NUMBER]+ SHIPPING ADDRESS=ADDRESS+ (BILLING ADDRESS=ADDRESS)+ 1 {PRODUCT NUMBER+ PRODUCT DESCRIPTION+ QUANTITY ORDERED+ PRODUCT PRICE+ PRODUCT PRICE SOURCE+ EXTENDED PRICE } N+ SUM OF EXTENDED PRICES+ PREPAID AMOUNT+ (CREDIT CARD NUMBER+EXPIRATION DATE) (QUOTE NUMBER) ADDRESS= (POST OFFICE BOX NUMBER)+ STREET ADDRESS+ CITY+ [STATE, MUNICIPALITY]+ (COUNTRY)+ POSTAL CODE ENGLISH ENTERPRETATION An instance of ORDER consists of: ORDER NUMBER and ORDER DATE and Either PERSONAL CUSTOMER NUMBER or CORPORATE ACCOUNT NUMBER and SHIPPING ADDRESS (which is equivalent to ADDRESS) and optionally: BILLING ADDRESS (which is equivalent to ADDRESS) and one or more instances of: PRODUCT NUMBER and PRODUCT DESCRIPTION and QUANTITY ORDERED and PRODUCT PRICE and PRODUCT PRICE SOURCE and EXTENDED PRICE and SUM OF EXTENDED PRICES and PREPAID AMOUNT and optionally: both CREDIT CARD NUMBER and EXPIRATION DATE An instance of ADDRESS consists of: optionally: POST OFFICE BOX NUMBER and STREET ADDRESS and CITY and Either STATE or MUNICIPALITY and optionally: COUNTRY and POSTAL CODE 22
12 Diverging and Converging Data Flows Diverging data flow a data flow that splits into multiple data flows. Indicates data that starts out naturally as one flow, but is routed to different destinations. Also useful to indicate multiple copies of the same output going to different destinations. Converging data flow the merger of multiple data flows into a single packet. Indicates data from multiple sources that can (must) come together as a single packet for subsequent processing. 23 Diverging and Converging Data Flows 24
13 When to Draw Process Models Strategic systems planning Enterprise process models illustrate important business functions. Business process redesign As is process models facilitate critical analysis. To be process models facilitate improvement. Systems analysis (primary focus of this course) Model existing system including its limitations Model target system s logical requirements Model candidate technical solutions Model the target technical solution 25 Modern Structured Analysis 1. Draw context DFD to establish initial project scope. 2. Draw functional decomposition diagram to partition the system into subsystems. 3. Create event-response or use-case list for the system to define events for which the system must have a response. 4. Draw an event DFD (or event handler) for each event. 5. Merge event DFDs into a system diagram (or, for larger systems, subsystem diagrams). 6. Draw detailed, primitive DFDs for the more complex event handlers. 7. Document data flows and processes in data dictionary. 26

 28")
14 Structured Analysis Diagram Progression (1 of 3) 27 Structured Analysis Diagram Progression (2 of 3) 28

15 Structured Analysis Diagram Progression (3 of 3) 29 Context Data Flow Diagram Context data flow diagram - a process model used to document the scope for a system. Also called the environmental model. 1. Think of the system as a "black box." 2. Ask users what business transactions the system must respond to. These are inputs, and the sources are external agents. 3. Ask users what responses must be produced by the system. These are outputs, and the destinations are external agents. 4. Identify any external data stores, if any. 5. Draw a context diagram. 30
16 Events and Use Cases External events are initiated by external agents. They result in an input transaction or data flow. Temporal events are triggered on the basis of time, or something that merely happens. They are indicated by a control flow. State events trigger processes based on a system s change from one state or condition to another. They are indicated by a control flow. Use case an analysis tool for finding and identifying business events and responses. Actor anything that interacts with a system. 31 Event Diagrams Event diagram data flow diagram that depicts the context for a single event. One diagram for each event process. Exception? Depicts Inputs from external agents Outputs to external agents Data stores from which records must be "read." Data flows should be added and named to reflect the data that is read. Data stores in which records must be created, deleted, or updated. Data flows should be named to reflect the update. 32
17 Simple Event Diagram 33 Event Diagram (more complex) 34
18 Temporal Event Diagram 35 System DFD 36
19 System DFD (concluded) 37 Balancing Balancing - a concept that requires that data flow diagrams at different levels of detail reflect consistency and completeness Quality assurance technique Requires that if you explode a process to another DFD to reveal more detail, you must include the same data flows and data stores on the child diagram. 38

20 Process Logic Data Flow Diagrams good for identifying and describing processes Not good at showing logic inside processes Need to specify detailed instructions for elementary processes 39 Data & Process Model Synchronization CRUD Matrix 40
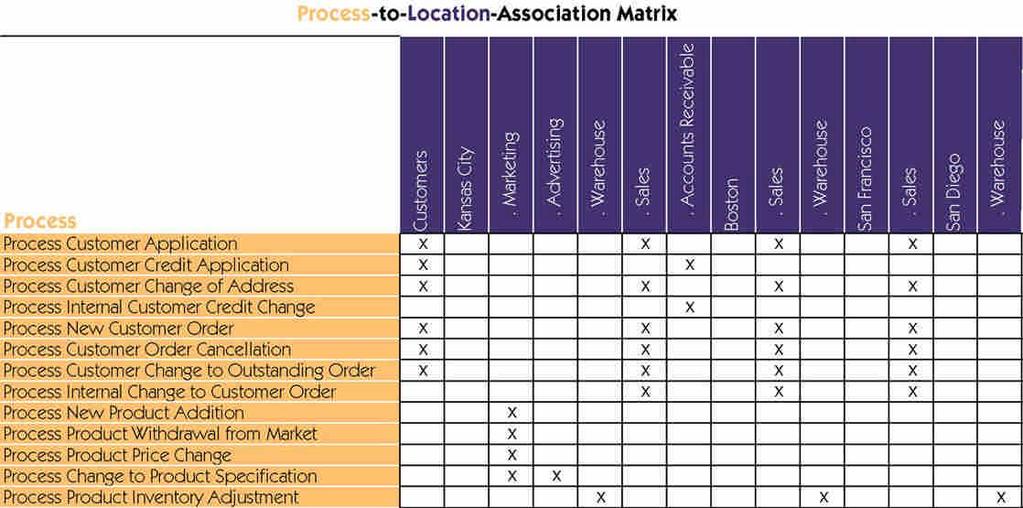
21 Process Distribution 41
Chapter 9. Process Modeling. McGraw-Hill/Irwin. Copyright 2007 by The McGraw-Hill Companies, Inc. All rights reserved.
 Chapter 9 Process Modeling McGraw-Hill/Irwin Copyright 2007 by The McGraw-Hill Companies, Inc. All rights reserved. Objectives Define systems modeling and differentiate logical and physical models. Define
Requests Charges. Librarian. University affiliated patrons students, faculty, staff. Media Center Staff
 Catherine Rutan INFO 530-901 Dr. Valerie Yonker Circulation of Media Materials from University Media Center: Requests Charges Librarian Circulation Desk Attendant Inquires University ID # (Primary Key)
Requirements Engineering
 Requirements Engineering Semi-Formal Specification: Structural Functional Requirements Structured Analysis Data Flow Diagrams SADT IDEF0 1 Back to the past GO/AO OO SA (DT) DFD SADT IDEF (Back to the future)
How do archivists identify and capture records?
 QUESTION How do archivists identify and capture records? AUTOMATED SYSTEMS MEETING THE CHALLENGE Critical Skill Set: Information System Analysis and Design Skills Being able to create conceptual models
Modelling as a Communication Tool: Introduction to Process Modelling. Modelling. Simplification in modelling. Representation in modelling
 CSE104 - Information Systems 1 Modelling as a Communication Tool: Introduction to Process Modelling The requirements specification document Must be communicated to key stakeholders Should contain: Functions
Process Modelling. Data flow Diagrams. Process Modelling Data Flow Diagrams. CSE Information Systems 1
 CSE104 - Information s 1 Process Modelling Data Flow Diagrams Process Modelling Process modelling aims to graphically represent the processes which capture, manipulate, store and distribute data. data
Input Design and Prototyping
 Types of Inputs Input Design and Prototyping Based on Chapter 16 of Whitten, Bentley, and Dittman: Systems Analysis and Design for the Global Enterprise (7th Ed). McGraw Hill. 2007 Inputs can be classified
Object-Oriented Design and Modeling Using the UML
 Design Classes Object-Oriented Design and Modeling Using the UML Based on Chapter 18 of Whitten, Bentley, and Dittman: Systems Analysis and Design for the Global Enterprise (7th Ed). McGraw Hill. 2007
Chapter 6 Structuring System Requirements: Process Modeling 6.1
 Chapter 6 Structuring System Requirements: Process Modeling 6.1 Learning Objectives Explain process modeling Discuss data-flow diagramming mechanics, definitions, and rules Discuss balancing data-flow
Lab 16: Visio Introduction
 Lab 16: Visio Introduction () CONTENTS 1 Visio- Introduction to DFD Data Flow Diagraming... 2 1.1 In-Lab... 3 1.1.1 In-Lab Materials... 3 1.1.2 In-Lab Instructions... 3 2 Getting started: Let s decompose
17/03/2018. Meltem Özturan
 Meltem Özturan www.mis.boun.edu.tr/ozturan/samd 2 1 Traditional Approach to Requirements Traditional Analysis Model Data flow diagrams Process description Data flow definiton Data store definition (Entity-Relationship
13/11/2017. Meltem Özturan misprivate.boun.edu.tr/ozturan/mis515
 Meltem Özturan misprivate.boun.edu.tr/ozturan/mis515 2 1 Traditional Approach to Requirements Data Flow Diagram (DFD) A graphical system model that shows all of the main requirements for an information
Chapter 10. Object-Oriented Analysis and Modeling Using the UML. McGraw-Hill/Irwin
 Chapter 10 Object-Oriented Analysis and Modeling Using the UML McGraw-Hill/Irwin Copyright 2007 by The McGraw-Hill Companies, Inc. All rights reserved. Objectives 10-2 Define object modeling and explain
Modelling: Review. Modelling Information Systems. Models in analysis and design. Process Modelling. Modelling perspectives
 Modelling: Review IMS100 Systems Analysis and Design Topic Review of Process Modelling Why do we do it? Communication and understanding Simplification all models are simplifications of the real world:
SE Assignment III. 1. List and explain primitive symbols used for constructing DFDs. Illustrate the use of these symbols with the help of an example.
 SE Assignment III 1. List and explain primitive symbols used for constructing DFDs. Illustrate the use of these symbols with the help of an example. There are essentially 5 different types of symbols used
Requirements Engineering. Contents. Functional requirements. What is a requirement?
 Contents Ø Introduction 4 Ø Engineering Ø Project Management Ø Software Design Ø Detailed Design and Coding Ø Quality Assurance Engineering Ø What is a Requirement? Ø RE Activities Ø Documentation Ø RE
Lecture Notes. Structured Systems Analysis
 Lecture Notes Structured Systems Analysis Lecture 3 Structured Analysis & Data Flow Diagrams Written by Dr. Fred Grossman Copyright 1999 Fred Grossman All Rights Reserved Structured Systems Analysis Structured
CHAPTER 4 Data and Process Modeling (Phase 2: Systems Analysis)
") CHAPTER 4 Data and Process Modeling (Phase 2: Systems Analysis) Jakrapop Maisen DATA FLOW DIAGRAMS A data flow diagram (DFD) shows how data moves through an information system but does not show program
CHAPTER 4 Data and Process Modeling (Phase 2: Systems Analysis) Jakrapop Maisen DATA FLOW DIAGRAMS A data flow diagram (DFD) shows how data moves through an information system but does not show program
MULTIPLE CHOICE. Choose the one alternative that best completes the statement or answers the question.
 Exam Name MULTIPLE CHOICE. Choose the one alternative that best completes the statement or answers the question. 1) A process has a: 1) A) pronoun label B) noun phrase label C) verb phrase label D) adjective
Data Process Modeling: Context Diagrams & Data Flow Diagrams (DFDs)
") Introduction Data Process Modeling: Context Diagrams & Data Flow Diagrams (DFDs) MIS 374 When designing/building an information system for an organization, you should consider the following questions regarding
Introduction Data Process Modeling: Context Diagrams & Data Flow Diagrams (DFDs) MIS 374 When designing/building an information system for an organization, you should consider the following questions regarding
System Analysis and Design. Data Flow Diagram. System Analysis and Design
 Data Flow Diagram 1 Data Flow diagram The dataflow diagram is a modeling tool that allows us to picture a system as a network of functional processes, connected to one another by pipelines and holding
Lecture c, Process Mapping: Yourdon Notation for Data Flow Diagrams, covers Yourdon notation for data flow diagrams.
 WORKFLOW ANALYSIS Audio Transcript Component 10 Unit 3 Lecture C Fundamentals of Health Workflow Process Analysis & Redesign Interpreting and Creating Process Diagrams Process Mapping Yourdon Notation
information process modelling DFDs Process description
 Process modelling IMS9300 IS/IM FUNDAMENTALS information process modelling DFDs Process description processes are the action part of businesses process modelling graphically represents the processes which
Data Flow Diagrams System Analysis ( (
 7 Data Flow Diagrams System Analysis (1932475( Kendall & Kendall 7-1 Data Flow Diagrams A top down approach to diagramming data movement, it moves from general to specific. Graphically characterize data
Fundamentals of Health Workflow Process Analysis and Redesign
 Fundamentals of Health Workflow Process Analysis and Redesign Process Mapping: Yourdon Notation for Data Flow Diagrams This material Comp10_Unit3c was developed by Duke University, funded by the Department
Slide 1 Welcome to Fundamentals of Health Workflow Process Analysis and Redesign: Process Mapping: Gane-Sarson Notation. This is Lecture d.
 WORKFLOW ANALYSIS Audio Transcript Component 10 Unit 3 Lecture D Fundamentals of Health Workflow Process Analysis & Redesign Interpreting and Creating Process Diagrams Process Mapping Gane-Sarson Notation
We move from a general information system to a Computer Based Information System
 Introduction to Information Systems: In this section of the course we start to think of the computer as just being a component in a system which may contain one or many computers linked together. An Information
Structured Modeling Methods. Lecture 15: Advantages and Disadvantages. University of Toronto Department of Computer Science.
 Lecture 15: Structured Modeling Methods Basics of Structured Analysis Notations used Modeling Process Variants SADT SASS SSADM SRD Advantages and Disadvantages 2001, Steve Easterbrook CSC444 Lec15 1 Definition
System Analysis & design
 Assiut University Faculty of Computers and Information System Analysis & design Year 2 Academic Year 2014/ 2015 Term (2) 5 A PICTURE IS WORTH A 1,000 WORDS A process model is a graphical way of representing
Data and Process Modeling
 Chapter 5 Data and Process Modeling 5 CHAPTER Data and Process Modeling Chapter 5 is the second of four chapters in the systems analysis phase of the SDLC. This chapter discusses data and process modeling
Fundamentals of Health Workflow Process Analysis and Redesign
 Fundamentals of Health Workflow Process Analysis and Redesign Unit 10.3d Process Mapping Gane-Sarson Notation Slide 1 Welcome to the Gane-Sarson Notation for Data Flow Diagrams Subunit. This is the third
(Murlidhar Group of Institutions,Bhavnagar Road, Rajkot) by:-assit. Prof. Vijay Vora (SOOADM) MCA-III
 by:-assit. Prof. Vijay Vora (SOOADM) MCA-III") Analysis Modeling What is Analysis Modeling? Analysis modeling uses a combination of text and diagrammatic forms to depict(represent) requirements for data, function, and behavior These text and diagrammatic
Analysis Modeling What is Analysis Modeling? Analysis modeling uses a combination of text and diagrammatic forms to depict(represent) requirements for data, function, and behavior These text and diagrammatic
Process Modeling. Chapter 7. Class 05: Process Modeling 1
 Process Modeling Chapter 7 Class 05: Process Modeling 1 Process Design Seldom the responsibility of the database designer or DBA However, understanding the basics aids communication with the process designers
Process Modeling. Business Process Example. Process Design
 Process Modeling Chapter 7 Class 05: Process Modeling 1 Process Design Seldom the responsibility of the database designer or DBA However, understanding the basics aids communication with the process designers
MIS2502: Data Analytics Relational Data Modeling - 1. JaeHwuen Jung
 MIS2502: Data Analytics Relational Data Modeling - 1 JaeHwuen Jung jaejung@temple.edu http://community.mis.temple.edu/jaejung Where we are Now we re here Data entry Transactional Database Data extraction
An Introduction to Business Process Modeling using Data Flow Diagrams
 An Introduction to Business Process Modeling using Data Flow Diagrams BSAD 141 Dave Novak BDIS: 2.2 (61-77) Lecture Overview Systems and Business processes Business process models Data Flow Diagrams (DFDs)
Object-Oriented Systems Analysis and Design Using UML
 10 Object-Oriented Systems Analysis and Design Using UML Systems Analysis and Design, 8e Kendall & Kendall Copyright 2011 Pearson Education, Inc. Publishing as Prentice Hall Learning Objectives Understand
CHAPTER 19: Building a Preliminary Behavioral Model
 1 z 7 CHAPTER 19: Building a Preliminary Behavioral Model Things are always at their best in their beginning. Blaise Pascal Lettres Provinciales, 1656-1657, no. 4 IN THIS CHAPTER, YOU WILL LEARN: Why a
Session 2b: structured specifications Purpose and criteria Structured specification components Introduction to dataflow diagrams
 Session 2b: structured specifications Purpose and criteria Structured specification components Introduction to dataflow diagrams COMP 320 / 420, Spring, 2018 Conrad Weisert Criteria for the ESD (from session
STRUCTURED SYSTEMS ANALYSIS & DESIGN
 Lecture 5 STRUCTURED SYSTEMS ANALYSIS & DESIGN Objectives Explain SSADM Describe tools of SSADM 2 1 SSADM It is a data (logical) oriented approach to system analysis and design that focuses on nature and
DFD Symbols. Process. Data Store Data Store Data Store
 ? Context Diagram Level 1 Diagram Level 2 Diagram DFD Symbols External Entity Source/Sink User Data Flow Process Process Data Store Data Store Data Store Rule for naming a process: The Joe Test A process
Analysis and Design for Systems h. 9 th Edition
 Analysis and Design for Systems h 9 th Edition Chapter 5 Data and Process Analysis Chapter Objectives Describe data and process modeling dli concepts and tools, including data flow diagrams, a data dictionary,
Fundamentals of Health Workflow Process Analysis and Redesign
 Fundamentals of Health Workflow Process Analysis and Redesign This material Comp0_Unit3d was developed by Duke University, funded by the Department of Health and Human Services, Office of the National
Structured Analysis and Design
 1 st Cut - Creating... 14:10 A Actors... 2:11 Additional Notations... 11:17 Alternative Names for the System... 13:15 Analysis - Overview... 1:9 Analysis and Design - Goals... 1:6 Analysis and Design -
Darshan Institute of Engineering & Technology for Diploma Studies
 REQUIREMENTS GATHERING AND ANALYSIS The analyst starts requirement gathering activity by collecting all information that could be useful to develop system. In practice it is very difficult to gather all
Functional Modeling with Data Flow Diagrams
 Functional Modeling with Data Flow Diagrams Amasi Elbakush 5771668 Teaching Assistant : Daniel Alami Utrecht University 1 Introduction Data Flow Diagrams (DFDs) are a visual representation of the flow
Overview. What is system analysis and design? Tools and models Methodologies
 Overview What is system analysis and design? Tools and models Methodologies Information Systems What is a system? Why do systems fail? What is systems analysis and design? How do we do systems analysis?
Programming Logic and Design Seventh Edition Chapter 2 Elements of High-Quality Programs
 Programming Logic and Design Chapter 2 Elements of High-Quality Programs Objectives In this chapter, you will learn about: Declaring and using variables and constants Assigning values to variables [assignment
SOFTWARE ANALYSIS & DESIGN TOOLS
 SOFTWARE ANALYSIS & DESIGN TOOLS http://www.tutorialspoint.com/software_engineering/software_analysis_design_tools.htm Copyright tutorialspoint.com Software analysis and design includes all activities,
Software Engineering Prof.N.L.Sarda IIT Bombay. Lecture-11 Data Modelling- ER diagrams, Mapping to relational model (Part -II)
") Software Engineering Prof.N.L.Sarda IIT Bombay Lecture-11 Data Modelling- ER diagrams, Mapping to relational model (Part -II) We will continue our discussion on process modeling. In the previous lecture
Software Engineering Prof.N.L.Sarda IIT Bombay Lecture-11 Data Modelling- ER diagrams, Mapping to relational model (Part -II) We will continue our discussion on process modeling. In the previous lecture
Working with Health IT Systems is available under a Creative Commons Attribution-NonCommercial- ShareAlike 3.0 Unported license.
 Working with Health IT Systems is available under a Creative Commons Attribution-NonCommercial- ShareAlike 3.0 Unported license. Johns Hopkins University. Welcome to the Fundamentals of Health Workflow
Software Design. Software design is a blueprint or a plan for a computerbased solution for system
 Software Design Software Design Software design is a blueprint or a plan for a computerbased solution for system Software design deals with transforming the customer requirements, as described by the SRS
Structured Analysis and Structured Design
 Structured Analysis and Structured Design - Introduction to SASD - Structured Analysis - Structured Design Ver. 1.5 Lecturer: JUNBEOM YOO jbyoo@konkuk.ac.kr http://dslab.konkuk.ac.kr References Modern
Software Design Report
 Software design is a process by which the software requirements are translated into a representation of software components, interfaces, and data necessary for the implementation phase. The SDD shows how
A Beginner s Guide to Programming Logic, Introductory. Chapter 2 Working with Data, Creating Modules, and Designing High-Quality Programs
 A Beginner s Guide to Programming Logic, Introductory Chapter 2 Working with Data, Creating Modules, and Designing High-Quality Programs Objectives In this chapter, you will learn about: Declaring and
SIF8035. Events and System Requirements
 SIF8035 Lecture 4 DFD and PrM Events and System Requirements Events Occurrences at a specific time and place Trigger all system processing Requirement definition Determine relevant events External events
Chapter : Analysis Modeling
 Chapter : Analysis Modeling Requirements Analysis Requirements analysis Specifies software s operational characteristics Indicates software's interface with other system elements Establishes constraints
4. The portion of the monthly bill from a credit card company is an example of a turn-around document.
 Chapter 2 Introduction to Transaction Processing Introduction to Accounting Information Systems, 8e Test Bank, Chapter 2 TRUE/FALSE 1. Processing more transactions at a lower unit cost makes batch processing
Requirements Analysis. SE 555 Software Requirements & Specification
 Requirements Analysis Goals of Requirements Analysis Create requirements containing sufficient detail and of high enough quality to allow realistic project planning as well as successful design and implementation.
C H A P T E R SYSTEM DESIGN
 C H A P T E R SYSTEM DESIGN Chapter Twelve Systems Design Describe the design phase in terms of your information building blocks. Identify and differentiate between several systems design strategies. Describe
SEEKING THE ACTUAL REASONS FOR THE "NEW PARADIGM" IN THE AREA OF IS ANALYSIS 2. GENERAL CHARACTERISTICS OF THE "STRUCTURED APPROACH" IN IS DEVELOPMENT
 SEEKING THE ACTUAL REASONS FOR THE "NEW PARADIGM" IN THE AREA OF IS ANALYSIS Václav Řepa Prague University of Economics, W.Churchill sq. 4, 130 00 Praha 3, Czech Republic E-mail: REPA@VSE.CZ 1. INTRODUCTION
Module 5. Function-Oriented Software Design. Version 2 CSE IIT, Kharagpur
 Module 5 Function-Oriented Software Design Lesson 12 Structured Design Specific Instructional Objectives At the end of this lesson the student will be able to: Identify the aim of structured design. Explain
AllFusion Process Modeler
 AllFusion Process Modeler User Guide r7.2 This documentation and any related computer software help programs (hereinafter referred to as the Documentation ) is for the end user s informational purposes
Data Flow Diagrams Examples
 1 of 6 20-Jan-12 1:42 AM Information Systems College of Business Administration University of Missouri - St. Louis Data Flow Diagrams Examples We will study a variety of diagramming tools this semester.
System Analysis & design
 Assiut University Faculty of Computers and Information System Analysis & design Year 2 Academic Year 2014/ 2015 Term (2) Copyright 2014 Dr. Hossam Ragab 6 data model describes the data that flow through
Structured English Examples
 Logic Modeling Logic and timing are not represented on data flow diagrams or entity-relationship diagrams Processes contain logic - what happens under what conditions Logic is modeled per process Types
CaseComplete Roadmap
 CaseComplete Roadmap Copyright 2004-2014 Serlio Software Development Corporation Contents Get started... 1 Create a project... 1 Set the vision and scope... 1 Brainstorm for primary actors and their goals...
Slide 1 Welcome to Fundamentals of Health Workflow Process Analysis and Redesign: Process Mapping: Entity-Relationship Diagrams. This is Lecture e.
 WORKFLOW ANALYSIS Audio Transcript Component 10 Unit 3 Lecture E Fundamentals of Health Workflow Process Analysis & Redesign Interpreting and Creating Process Diagrams Process Mapping UML notation for
Programming Logic and Design Sixth Edition Chapter 2 Working with Data, Creating Modules, and Designing High-Quality Programs
 Objectives Programming Logic and Design Sixth Edition Chapter 2 Working with Data, Creating Modules, and Designing High-Quality Programs In this chapter, you will learn about: Declaring and using variables
Software Modeling & Analysis. - Introduction to SASD - Structured Analysis. Lecturer: JUNBEOM YOO
 Software Modeling & Analysis - Introduction to SASD - Structured Analysis Lecturer: JUNBEOM YOO jbyoo@konkuk.ac.kr References Modern Structured Analysis, Edward Yourdon, 1989. Introduction to System Analysis
21. Document Component Design
 Page 1 of 17 1. Plan for Today's Lecture Methods for identifying aggregate components 21. Document Component Design Bob Glushko (glushko@sims.berkeley.edu) Document Engineering (IS 243) - 11 April 2005
Chapter 13. Application Architecture and Modeling. McGraw-Hill/Irwin. Copyright 2007 by The McGraw-Hill Companies, Inc. All rights reserved.
 Chapter 13 Application Architecture and Modeling McGraw-Hill/Irwin Copyright 2007 by The McGraw-Hill Companies, Inc. All rights reserved. Objectives 13-2 Define an information system s architecture in
Database Systems. Overview - important points. Lecture 5. Some introductory information ERD diagrams Normalization Other stuff 08/03/2015
 Lecture 5 Database Systems Instructor: M.Imran Khalil Imrankhalil3@gmail.com Resource:Imrankhalil3.wordpress.com University of Sargodha Canal Campus Lahore Overview - important points Some introductory
System Analysis and Design
 System Analysis and Design M Umair www.m-umair.com System Description Techniques Graphical representation of any process is always better and more meaningful than its representation in words. System Analysis
Lecture 5 STRUCTURED ANALYSIS. PB007 So(ware Engineering I Faculty of Informa:cs, Masaryk University Fall Bühnová, Sochor, Ráček
 Lecture 5 STRUCTURED ANALYSIS PB007 So(ware Engineering I Faculty of Informa:cs, Masaryk University Fall 2015 1 Outline ² Yourdon Modern Structured Analysis (YMSA) Context diagram (CD) Data flow diagram
Data. Entities. Accounting Information Systems. Chapter 4: Data Management
 Accounting Information Systems Chapter 4: Data Management Data Data may be defined broadly to include two interrelated components: Data Models that provide structure to data File Orientation Data-base
Meltem Özturan
 Meltem Özturan www.mis.boun.edu.tr/ozturan/samd 1 2 Modeling System Requirements Object Oriented Approach to Requirements OOA considers an IS as a set of objects that work together to carry out the function.
What is Data Flow Diagram (DFD)? How to Draw DFD? Written Date : January 27, 2012
? How to Draw DFD? Written Date : January 27, 2012") Written Date : January 27, 2012 What is a data flow diagram (DFD)? A picture is worth a thousand words. A Data Flow Diagram (DFD) is traditional visual representation of the information flows within a
Written Date : January 27, 2012 What is a data flow diagram (DFD)? A picture is worth a thousand words. A Data Flow Diagram (DFD) is traditional visual representation of the information flows within a
1 Executive Overview The Benefits and Objectives of BPDM
 1 Executive Overview The Benefits and Objectives of BPDM This is an excerpt from the Final Submission BPDM document posted to OMG members on November 13 th 2006. The full version of the specification will
IMS1002/CSE1205 Lectures 1
 IMS1002/CSE1205 Systems Analysis and Design Lecture 2 & 3 Introduction to Data Modelling Entity Relationship Modelling Data Modelling Focus on the information aspects of the organisation In a database
An Automatic Tool for Checking Consistency between Data Flow Diagrams (DFDs)
") An Automatic Tool for Checking Consistency between Data Flow Diagrams (DFDs) Rosziati Ibrahim, Siow Yen Yen Abstract System development life cycle (SDLC) is a process uses during the development of any
An Automatic Tool for Checking Consistency between Data Flow Diagrams (DFDs) Rosziati Ibrahim, Siow Yen Yen Abstract System development life cycle (SDLC) is a process uses during the development of any
Use C ases Cases 7/09
 Use Cases 7/09 Groups of 3 Recorder/Timekeeper Participation checker Devil s Advocate Motivation One way to describe a system is to create a story, y, the interaction between a user and the system This
Applying Systems Thinking to MBSE
 Applying Systems Thinking to MBSE 1 Daniel Hettema, and Steven H. Dam, Ph.D., ESEP, SPEC Innovations, 571-485-7799 daniel.hettema@specinnovations.com October 2013 Overview What makes systems thinking different
CS 451 Software Engineering
 CS 451 Software Engineering Yuanfang Cai Room 104, University Crossings 215.895.0298 yfcai@cs.drexel.edu 1 Elaboration 2 Elaboration: Building the Analysis Model An analysis model provides a description
Chapter 2 Introduction to Transaction Processing
 Chapter 2 Introduction to Transaction Processing TRUE/FALSE 1. Processing more transactions at a lower unit cost makes batch processing more efficient than real-time systems. T 2. The process of acquiring
SE 1: Software Requirements Specification and Analysis
 SE 1: Software Requirements Specification and Analysis Lecture 4: Basic Notations Nancy Day, Davor Svetinović http://www.student.cs.uwaterloo.ca/ cs445/winter2006 uw.cs.cs445 U Waterloo SE1 (Winter 2006)
Enterprise Architect. User Guide Series. UML Models. Author: Sparx Systems. Date: 30/06/2017. Version: 1.0 CREATED WITH
 Enterprise Architect User Guide Series UML Models Author: Sparx Systems Date: 30/06/2017 Version: 1.0 CREATED WITH Table of Contents UML Models UML Diagrams UML Structural Models Class Diagram Composite
Software Service Engineering
 Software Service Engineering Lecture 4: Unified Modeling Language Doctor Guangyu Gao Some contents and notes selected from Fowler, M. UML Distilled, 3rd edition. Addison-Wesley Unified Modeling Language
Chapter 1 SQL and Data
 Chapter 1 SQL and Data What is SQL? Structured Query Language An industry-standard language used to access & manipulate data stored in a relational database E. F. Codd, 1970 s IBM 2 What is Oracle? A relational
What is a Model? Copyright hebley & Associates
 Modeling Overview... as we know, there are known knowns; there are things we know we know. We also know there are known unknowns; that is to say we know there are some things we do not know. But there
1. The narratives, diagrams, charts, and other written materials that explain how a system works are collectively called
 CH 3 MULTIPLE CHOICE 1. The narratives, diagrams, charts, and other written materials that explain how a system works are collectively called a) documentation. b) data flows. c) flowcharts. d) schema.
Chapter 4. Capturing the Requirements. 4th Edition. Shari L. Pfleeger Joanne M. Atlee
 Chapter 4 Capturing the Requirements Shari L. Pfleeger Joanne M. Atlee 4th Edition It is important to have standard notations for modeling, documenting, and communicating decisions Modeling helps us to
Full file at https://fratstock.eu
 TEACHING TIPS Chapter 2 SYSTEMS TECHNIQUES AND DOCUMENTATION I normally introduce flowcharting symbols with simple examples on the board. I first introduce a very simple manual flowchart involving only
Conceptual Database Design. COSC 304 Introduction to Database Systems. Entity-Relationship Modeling. Entity-Relationship Modeling
 COSC 304 Introduction to Database Systems Entity-Relationship Modeling Dr. Ramon Lawrence University of British Columbia Okanagan ramon.lawrence@ubc.ca Conceptual Database Design Conceptual database design
Ans 1-j)True, these diagrams show a set of classes, interfaces and collaborations and their relationships.
True, these diagrams show a set of classes, interfaces and collaborations and their relationships.") Q 1) Attempt all the following questions: (a) Define the term cohesion in the context of object oriented design of systems? (b) Do you need to develop all the views of the system? Justify your answer?
Q 1) Attempt all the following questions: (a) Define the term cohesion in the context of object oriented design of systems? (b) Do you need to develop all the views of the system? Justify your answer?
International School of Informatics and management, Jaipur Billing System Synopsis TEAM GROUP - 04 TEAM MEMBERS -ANIL KUMAR ANJANA -BHAIYA LAL ANJANA
 International School of Informatics and management, Jaipur Billing System Synopsis TEAM GROUP - 04 TEAM MEMBERS -ANIL KUMAR ANJANA -BHAIYA LAL ANJANA -SAURABH JAIN PROJECT GUIDE - Ms JYOTI KHURANA (Lecturer
Learning outcomes. On successful completion of this unit you will: 1. Understand data models and database technologies.
 2015-2016 Phil Smith Learning outcomes On successful completion of this unit you will: 1. Understand data models and database technologies. (Assignment 1) Recap and setting the scene Before we get to Normalisation
Requirements Engineering
 Chapter 3: Requirements Modeling Requirements Engineering Objectives In this chapter, you will learn about: Functional requirements Modeling requirements Overview of basic modeling paradigms Gus Requirements
Unit 6 - Software Design and Development LESSON 10 DESIGN TOOLS, INPUTS, OUTPUTS, STORYBOARDS
 Unit 6 - Software Design and Development LESSON 10 DESIGN TOOLS, INPUTS, OUTPUTS, STORYBOARDS Previously Key features of programming languages Software Development Lifecycle Using tools to demonstrate
Taxonomies and controlled vocabularies best practices for metadata
 Original Article Taxonomies and controlled vocabularies best practices for metadata Heather Hedden is the taxonomy manager at First Wind Energy LLC. Previously, she was a taxonomy consultant with Earley