Lab 16: Visio Introduction
|
|
|
- Bartholomew Gallagher
- 5 years ago
- Views:
Transcription
1 Lab 16: Visio Introduction ()
2 CONTENTS 1 Visio- Introduction to DFD Data Flow Diagraming In-Lab In-Lab Materials In-Lab Instructions Getting started: Let s decompose the project Start Diagraming a context diagram Start Modeling Sample Out-Lab Out-Lab Materials Out-Lab Instructions VISIO- INTRODUCTION TO DFD DATA FLOW DIAGRAMING You've heard it again and again. "A picture is worth a thousand words." But you have to admit: It's true. And it's truer than ever when you've got Visio on your side. A two-dimensional diagram that explains how data is processed and transferred in a system and how a system outputs information. Individuals seeking to draft a data flow diagram must (1) identify external inputs and outputs, (2) determine how the inputs and outputs relate to each other, and (3) explain with graphical notation using only 4 symbols. This powerful program is waiting to help you make picture-perfect diagrams. Maybe you need a flowchart, an organization chart, an office layout. Today you will learn how in business we model how data flows into a business system and how it is processes into information useful for a business to make strategic decisions. It also discovers how data gets stored, extracted, and reported. We use a concept called Data Flow Diagraming (DFD) and we will use the Sarson and Gane model in establishing the basic concepts of DFDs 2 P a g e
3 1.1 IN-LAB Scenario: You will need is to create an ITIL Process map new clients creating a new account for a small bank. You will need to include the following process: 1. Client needs to contact bank account specialist to open a new checking or savings account. 2. Client must provide documents e.g. driver s license and two forms of mailing addresses i.e. gas or electric bill 3. Bank account specialist must log into the banking system to 4. Notices of service agreements must be signed by both client and specialist, the hardcopy documents must be scanned and upload to the Bank Database. 5. Once the process is complete then the client should receive a welcome packet and temporary usernames and passwords for the online account access. You must create a Context Diagram using a DFD model In-Lab Materials 1. Microsoft Visio (any version) 2. Internet In-Lab Instructions Step 1: Understanding the rules of DFD or Data Flow Diagrams Represent both physical and logical information systems. Only four symbols are used. Useful for depicting purely logical information flows. DFDs that detail physical systems differ from system flowcharts which depict details of physical computing equipment. 3 P a g e
. Source/sink: external entity that is origin or destination of data (outside the system).")

4 The symbols we use DFD lingo: Process: work or actions performed on data (inside the system). Data store: data at rest (inside the system). Source/sink: external entity that is origin or destination of data (outside the system). Data flow: arrows depicting movement of data. Context diagram is an overview of an organizational system that shows: o the system boundaries; o external entities that interact with the system; o Major information flows between the entities and the system. Note: only one process symbol, and no data stores shown. 4 P a g e
 DFDs. 1.1.2.1.5 RULES 1. There are two DFD guidelines that apply: a.")
5 How to develop a DFD 1. Level-0 diagram is a data flow diagram that represents a system s major processes, data flows, and data stores at a high level of detail. a. Processes are labeled 1.0, 2.0, etc. These will be decomposed into more primitive (lower-level) DFDs RULES 1. There are two DFD guidelines that apply: a. The inputs to a process are different from the outputs of that process. i. Processes purpose is to transform inputs into outputs. b. Objects on a DFD have unique names. 5 P a g e

6 i. Every process has a unique name How to Decompose a DFD 1. Functional decomposition is an iterative process of breaking a system description down into finer and finer detail. a. Creates a set of charts in which one process on a given chart is explained in greater detail on another chart. b. Continues until no subprocess can logically be broken down any further. 2. Primitive DFD is the lowest level of a DFD. 3. Level-1 diagram results from decomposition of Level-0 diagram. 4. Level-n diagram is a DFD diagram that is the result of a n nested decompositions from a process on a level-0 diagram. For Example a Level-1 DFD 6 P a g e
 DFDs if necessary.")

7 Level-1 DFD shows the sub-processes of one of the processes in the Level-0 DFD. This is a Level-1 DFD for Process 4.0. Processes are labeled 4.1, 4.2, etc. These can be further decomposed in more primitive (lower-level) DFDs if necessary. A Level-n DFD Example Level-n DFD shows the sub-processes of one of the processes in the Level n-1 DFD. This is a Level-2 DFD for Process 4.3. Processes are labeled 4.3.1, 4.3.2, etc. If this is the lowest level of the hierarchy, it is called a primitive DFD. 7 P a g e
8 2 GETTING STARTED: LET S DECOMPOSE THE PROJECT Start by identifying the following Roles for the Context Diagram: Processes Source/Sink Data Store Data Flow Bank System Client, Account Specialist Bank Database - Client contact account specialist -Client provides documents -Client Receives documents to be signed -Account specialist logs into system -Account specialist gives documents to be signed Account Specialist receives signed documents -Files are stored to the Bank Database - Client receives welcome packet 3 START DIAGRAMING A CONTEXT DIAGRAM Open Visio 8 P a g e
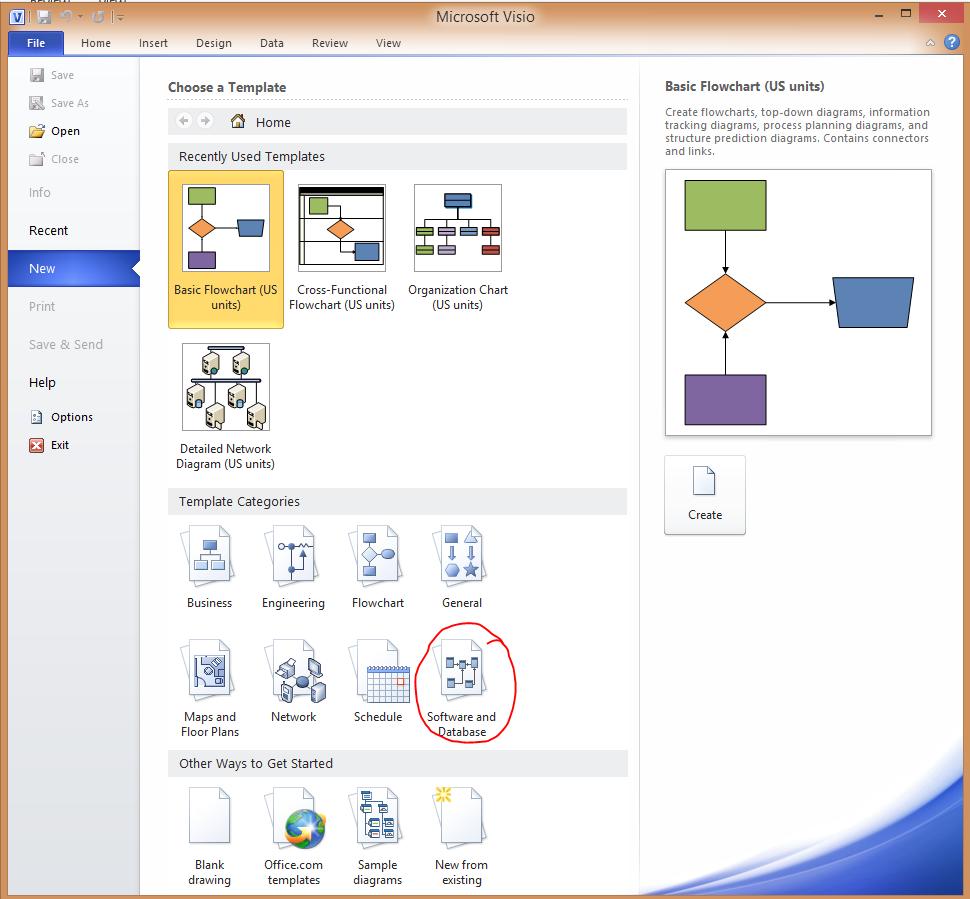
9 9 P a g e


10 Once open you should see the following page 10 P a g e

11 Now change the orientation to landscape: Change it to landscape 11 P a g e


12 Now let s add a theme Then let s add a border and title I used Urban theme 12 P a g e

13 Now to add the title look at the bottom left of your document 13 P a g e

14 Click on the VBacground to edit the title, then click on the Title and start typing the title Creating a New Account Once you click out of it should go back to the templage Now go back to the Top Process Tab and we want to change the tab title by double-clicking on the tab Once all the formatting is complete then we can start modeling 4 START MODELING On the left panel you will see the four shapes we are going to work with * Note that Interface is the same as the source/sink Based on our decomposition analysis we have 1 process, 2 sources, one data store, and 7 data flows. Start by adding 1 process by simply dragging the process into the document. 14 P a g e


15 Repeat the process for the Interface and Data Store. We will work with the data flows once we can see all our actors in the document You can resize each object by adjusting the handlebars. Now we need to label each object by double clicking on each object. 15 P a g e


16 Now let s connect them using a data flow arrow. Drag the data flow into client until you see a red border appear around the client object. 16 P a g e


17 Connect the Client to the Banking System by stretching the arrow end until 0.0 Banking System gets a red border. Double click on the data flow to label it SAMPLE 17 P a g e
 2.")
18 4.4 OUT-LAB Scenario: A cable TV company needs a new system for tech support. So the process is: 1. Operator receives an ed repair request from a customer and inputs it to the CRM System (Customer Relationship Manager System) 2. A repair analyst logs into the CRM System and forwards the issues to the Technician through the CRM System 3. The CRM System s the Technician. The tech then logs into the CRM System and s the Customer via the CRM on dates and times for the repair 4. Once the technician is completed the work then they go to the CRM System and updates the Work order as complete and stores the completed work order into the Complete Work Order DB 4.5 OUT-LAB MATERIALS 1. Microsoft Visio 2. Access to the Internet 18 P a g e
19 4.5.1 Out-Lab Instructions Step 1: Create the decomposition table below to help you. DFD OBJECT DEFINITION SHAPE PROCESSES EXTERNAL ENTITIES/SOURCES/SINKS DATA STORES DATA FOLLOWS Process Notations. A process transforms incoming data flow into outgoing data flow. External Entity Notations. External entities are objects outside the system, with which the system communicates. External entities are sources and destinations of the system's inputs and outputs. Datastore Notations. Datastores are repositories of data in the system. They are sometimes also referred to as files. Dataflow Notations. Dataflows are pipelines through which packets of information flow. Label the arrows with the name of the data that moves through it. Step 2: Using Visio create DFD using the Gane-Sarson Model 2 P a g e
Chapter 6 Structuring System Requirements: Process Modeling 6.1
 Chapter 6 Structuring System Requirements: Process Modeling 6.1 Learning Objectives Explain process modeling Discuss data-flow diagramming mechanics, definitions, and rules Discuss balancing data-flow
Process Modeling. Wei-Tsong Wang 1 IIM, NCKU
 Process Modeling Based on Chapter 9 of Whitten, Bentley, and Dittman: Systems Analysis and Design for the Global Enterprise (7th Ed). McGraw Hill. 2007 Wei-Tsong Wang 1 IIM, NCKU 2 Models: Logical and
System Analysis and Design
 System Analysis and Design M Umair www.m-umair.com System Description Techniques Graphical representation of any process is always better and more meaningful than its representation in words. System Analysis
Chapter 9. Process Modeling. McGraw-Hill/Irwin. Copyright 2007 by The McGraw-Hill Companies, Inc. All rights reserved.
 Chapter 9 Process Modeling McGraw-Hill/Irwin Copyright 2007 by The McGraw-Hill Companies, Inc. All rights reserved. Objectives Define systems modeling and differentiate logical and physical models. Define
information process modelling DFDs Process description
 Process modelling IMS9300 IS/IM FUNDAMENTALS information process modelling DFDs Process description processes are the action part of businesses process modelling graphically represents the processes which
SOFTWARE ANALYSIS & DESIGN TOOLS
 SOFTWARE ANALYSIS & DESIGN TOOLS http://www.tutorialspoint.com/software_engineering/software_analysis_design_tools.htm Copyright tutorialspoint.com Software analysis and design includes all activities,
Unit 6 - Software Design and Development LESSON 10 DESIGN TOOLS, INPUTS, OUTPUTS, STORYBOARDS
 Unit 6 - Software Design and Development LESSON 10 DESIGN TOOLS, INPUTS, OUTPUTS, STORYBOARDS Previously Key features of programming languages Software Development Lifecycle Using tools to demonstrate
Process Modelling. Data flow Diagrams. Process Modelling Data Flow Diagrams. CSE Information Systems 1
 CSE104 - Information s 1 Process Modelling Data Flow Diagrams Process Modelling Process modelling aims to graphically represent the processes which capture, manipulate, store and distribute data. data
Modelling as a Communication Tool: Introduction to Process Modelling. Modelling. Simplification in modelling. Representation in modelling
 CSE104 - Information Systems 1 Modelling as a Communication Tool: Introduction to Process Modelling The requirements specification document Must be communicated to key stakeholders Should contain: Functions
Data Process Modeling: Context Diagrams & Data Flow Diagrams (DFDs)
") Introduction Data Process Modeling: Context Diagrams & Data Flow Diagrams (DFDs) MIS 374 When designing/building an information system for an organization, you should consider the following questions regarding
Introduction Data Process Modeling: Context Diagrams & Data Flow Diagrams (DFDs) MIS 374 When designing/building an information system for an organization, you should consider the following questions regarding
System Analysis and Design. Data Flow Diagram. System Analysis and Design
 Data Flow Diagram 1 Data Flow diagram The dataflow diagram is a modeling tool that allows us to picture a system as a network of functional processes, connected to one another by pipelines and holding
We move from a general information system to a Computer Based Information System
 Introduction to Information Systems: In this section of the course we start to think of the computer as just being a component in a system which may contain one or many computers linked together. An Information
CHAPTER 4 Data and Process Modeling (Phase 2: Systems Analysis)
") CHAPTER 4 Data and Process Modeling (Phase 2: Systems Analysis) Jakrapop Maisen DATA FLOW DIAGRAMS A data flow diagram (DFD) shows how data moves through an information system but does not show program
CHAPTER 4 Data and Process Modeling (Phase 2: Systems Analysis) Jakrapop Maisen DATA FLOW DIAGRAMS A data flow diagram (DFD) shows how data moves through an information system but does not show program
Fundamentals of Health Workflow Process Analysis and Redesign
 Fundamentals of Health Workflow Process Analysis and Redesign Process Mapping: Yourdon Notation for Data Flow Diagrams This material Comp10_Unit3c was developed by Duke University, funded by the Department
13/11/2017. Meltem Özturan misprivate.boun.edu.tr/ozturan/mis515
 Meltem Özturan misprivate.boun.edu.tr/ozturan/mis515 2 1 Traditional Approach to Requirements Data Flow Diagram (DFD) A graphical system model that shows all of the main requirements for an information
Slide 1 Welcome to Fundamentals of Health Workflow Process Analysis and Redesign: Process Mapping: Gane-Sarson Notation. This is Lecture d.
 WORKFLOW ANALYSIS Audio Transcript Component 10 Unit 3 Lecture D Fundamentals of Health Workflow Process Analysis & Redesign Interpreting and Creating Process Diagrams Process Mapping Gane-Sarson Notation
System Analysis & design
 Assiut University Faculty of Computers and Information System Analysis & design Year 2 Academic Year 2014/ 2015 Term (2) 5 A PICTURE IS WORTH A 1,000 WORDS A process model is a graphical way of representing
Modelling: Review. Modelling Information Systems. Models in analysis and design. Process Modelling. Modelling perspectives
 Modelling: Review IMS100 Systems Analysis and Design Topic Review of Process Modelling Why do we do it? Communication and understanding Simplification all models are simplifications of the real world:
Requirements Engineering
 Requirements Engineering Semi-Formal Specification: Structural Functional Requirements Structured Analysis Data Flow Diagrams SADT IDEF0 1 Back to the past GO/AO OO SA (DT) DFD SADT IDEF (Back to the future)
Chapter No 13 Batch Management Information Systems. Management Information Systems. Compiled By: Muzammil Ahmad Khan and Kashif Shaikh
 Chapter 13 Compiled By: Muzammil Ahmad Khan Muhammad Kashif Shaikh HS-107 : Course Objectives: Upon successful completion of this course, the student will be able to: Understand the role of Information
What is Data Flow Diagram (DFD)? How to Draw DFD? Written Date : January 27, 2012
? How to Draw DFD? Written Date : January 27, 2012") Written Date : January 27, 2012 What is a data flow diagram (DFD)? A picture is worth a thousand words. A Data Flow Diagram (DFD) is traditional visual representation of the information flows within a
Written Date : January 27, 2012 What is a data flow diagram (DFD)? A picture is worth a thousand words. A Data Flow Diagram (DFD) is traditional visual representation of the information flows within a
Fundamentals of Health Workflow Process Analysis and Redesign
 Fundamentals of Health Workflow Process Analysis and Redesign Unit 10.3d Process Mapping Gane-Sarson Notation Slide 1 Welcome to the Gane-Sarson Notation for Data Flow Diagrams Subunit. This is the third
4. In the Change Chart Type dialog box, click the type of chart to which you want to change. 5. Click the chart style. 6. Click OK.
 PROCEDURES LESSON 21: BUILDING BASIC CHARTS Creating a Chart 1 Select the range of data you want to chart 2 Click the INSERT tab Charts Group 3 Click the desired chart category button 4 In the gallery,
Darshan Institute of Engineering & Technology for Diploma Studies
 REQUIREMENTS GATHERING AND ANALYSIS The analyst starts requirement gathering activity by collecting all information that could be useful to develop system. In practice it is very difficult to gather all
Process Modeling. Chapter 7. Class 05: Process Modeling 1
 Process Modeling Chapter 7 Class 05: Process Modeling 1 Process Design Seldom the responsibility of the database designer or DBA However, understanding the basics aids communication with the process designers
Process Modeling. Business Process Example. Process Design
 Process Modeling Chapter 7 Class 05: Process Modeling 1 Process Design Seldom the responsibility of the database designer or DBA However, understanding the basics aids communication with the process designers
Requests Charges. Librarian. University affiliated patrons students, faculty, staff. Media Center Staff
 Catherine Rutan INFO 530-901 Dr. Valerie Yonker Circulation of Media Materials from University Media Center: Requests Charges Librarian Circulation Desk Attendant Inquires University ID # (Primary Key)
Session 2b: structured specifications Purpose and criteria Structured specification components Introduction to dataflow diagrams
 Session 2b: structured specifications Purpose and criteria Structured specification components Introduction to dataflow diagrams COMP 320 / 420, Spring, 2018 Conrad Weisert Criteria for the ESD (from session
Lab # 1. Structuring System Requirements: Diagrams
 Lab # 1 Structuring System Requirements: Diagrams Objectives 1. Use Case diagrams 2. Class Objects (CO) diagrams 3. Context Data Flow Diagrams (Context DFDs) 4. Level-0 Data Flow Diagrams (Level-0 DFDs)
Microsoft Visio 2010
 Microsoft Visio 2010 Bryton Burling Table of Contents Opening Microsoft Visio 2010... 2 Getting Started... 3 Creating a Conceptual Web Site Diagram... 3 Analyzing the Shapes Toolbar... 3 Adding a Home
PowerPoint Introduction. Video: Slide Basics. Understanding slides and slide layouts. Slide Basics
 PowerPoint 2013 Slide Basics Introduction PowerPoint presentations are made up of a series of slides. Slides contain the information you will present to your audience. This might include text, pictures,
Microsoft Visio 2010: An Introduction
 Microsoft Visio 2010: An Introduction This document provides an introduction to using Microsoft Visio 2010. Microsoft Visio is software designed to translate complex information from text and tables into
Lecture c, Process Mapping: Yourdon Notation for Data Flow Diagrams, covers Yourdon notation for data flow diagrams.
 WORKFLOW ANALYSIS Audio Transcript Component 10 Unit 3 Lecture C Fundamentals of Health Workflow Process Analysis & Redesign Interpreting and Creating Process Diagrams Process Mapping Yourdon Notation
SE Assignment III. 1. List and explain primitive symbols used for constructing DFDs. Illustrate the use of these symbols with the help of an example.
 SE Assignment III 1. List and explain primitive symbols used for constructing DFDs. Illustrate the use of these symbols with the help of an example. There are essentially 5 different types of symbols used
Analysis and Design for Systems h. 9 th Edition
 Analysis and Design for Systems h 9 th Edition Chapter 5 Data and Process Analysis Chapter Objectives Describe data and process modeling dli concepts and tools, including data flow diagrams, a data dictionary,
MSOffice WORD Microsoft Office 20 13
 MSOffice WORD Microsoft Office 2013 Lesson 2: Format Content Objectives: Create headers and footers Insert and modify a table and chart Insert and manipulate Clip Art, SmartArt, and WordArt Work with a
MULTIPLE CHOICE. Choose the one alternative that best completes the statement or answers the question.
 Exam Name MULTIPLE CHOICE. Choose the one alternative that best completes the statement or answers the question. 1) A process has a: 1) A) pronoun label B) noun phrase label C) verb phrase label D) adjective
PowerPoint Slide Basics. Introduction
 PowerPoint 2016 Slide Basics Introduction Every PowerPoint presentation is composed of a series of slides. To begin creating a slide show, you'll need to know the basics of working with slides. You'll
On to Iteration 3, and Activity Diagrams CSSE 574: Session 6, Part 1
 On to Iteration 3, and Activity Diagrams CSSE 574: Session 6, Part 1 Steve Chenoweth Phone: Office (812) 877-8974 Cell (937) 657-3885 Email: chenowet@rose-hulman.edu On to Iteration 3: NextGen POS Failover
Introduction Google Forms is used to plan events, provide quizzes, survey, or collect needed information quickly.
 Table of Contents Introduction Creating a Form from Drive Question Types Editing the Form Form Layout Reorder Questions Confirmation Page Sharing your Form Add Collaborators Choose a Form Response Destination
Word Introduction. SmartArt graphics. Video: SmartArt Graphics in. Word To insert a SmartArt illustration: SmartArt Graphics
 Word 2010 SmartArt Graphics Introduction SmartArt allows you to visually communicate information rather than simply using text. Illustrations can enhance your document, and SmartArt makes using graphics
DFD Symbols. Process. Data Store Data Store Data Store
 ? Context Diagram Level 1 Diagram Level 2 Diagram DFD Symbols External Entity Source/Sink User Data Flow Process Process Data Store Data Store Data Store Rule for naming a process: The Joe Test A process
Create a Flowchart in PowerPoint
 Create a Flowchart in PowerPoint A flowchart is a diagram of steps, movements or actions involved in a system or activity. Flowcharts use conventional geometric symbols and arrows to define relationships
DISCERN SGAM Visio Template User Guide
 Distributed Intelligence for Cost-Effective and Reliable Distribution Network Operation DISCERN SGAM Visio Template User Guide Author: OFFIS Date: 22.04.2016 www.discern.eu The research leading to these
Working with Health IT Systems is available under a Creative Commons Attribution-NonCommercial- ShareAlike 3.0 Unported license.
 Working with Health IT Systems is available under a Creative Commons Attribution-NonCommercial- ShareAlike 3.0 Unported license. Johns Hopkins University. Welcome to the Fundamentals of Health Workflow
Clip Art and Graphics. Inserting Clip Art. Inserting Other Graphics. Creating Your Own Shapes. Formatting the Shape
 1 of 1 Clip Art and Graphics Inserting Clip Art Click where you want the picture to go (you can change its position later.) From the Insert tab, find the Illustrations Area and click on the Clip Art button
17/03/2018. Meltem Özturan
 Meltem Özturan www.mis.boun.edu.tr/ozturan/samd 2 1 Traditional Approach to Requirements Traditional Analysis Model Data flow diagrams Process description Data flow definiton Data store definition (Entity-Relationship
Business Process Modeling. Version 25/10/2012
 Business Process Modeling Version 25/10/2012 Maurizio Morisio, Marco Torchiano, 2012, 2013 3 BP Aspects Process flow Process modeling UML Activity Diagrams BPMN Information Conceptual modeling UML Class
Microsoft Office PowerPoint 2013 Courses 24 Hours
 Microsoft Office PowerPoint 2013 Courses 24 Hours COURSE OUTLINES FOUNDATION LEVEL COURSE OUTLINE Using PowerPoint 2013 Opening PowerPoint 2013 Opening a Presentation Navigating between Slides Using the
Introduction to Computer Programming/Handout 01 Page 1 of 13
 Introduction to Computer Programming/Handout 01 Page 1 of 13 Table of Contents Table of Contents... 1 Learning Objectives... 2 Program... 2 Programmer... 2 Programming Language... 2 Types of Languages...
Microsoft Office Training Skills 2010
 Microsoft Office Training Skills 2010 Lesson 5 Working with pages, Tables, Shapes and Securing Documents Adding Page color Add color to the background of one or several pages in the document. 1. Click
GIS Virtual Workshop: Creating a Final Map
 To create a map that will be pleasing to an end user, in a static format requires that certain items be added to the map such as a direction arrow, scale, title and legend. Including this information on
(Murlidhar Group of Institutions,Bhavnagar Road, Rajkot) by:-assit. Prof. Vijay Vora (SOOADM) MCA-III
 by:-assit. Prof. Vijay Vora (SOOADM) MCA-III") Analysis Modeling What is Analysis Modeling? Analysis modeling uses a combination of text and diagrammatic forms to depict(represent) requirements for data, function, and behavior These text and diagrammatic
Analysis Modeling What is Analysis Modeling? Analysis modeling uses a combination of text and diagrammatic forms to depict(represent) requirements for data, function, and behavior These text and diagrammatic
CHAPTER 19: MANAGING SERVICE QUEUES
 Chapter 19: Managing Service Queues CHAPTER 19: MANAGING SERVICE QUEUES Objectives Introduction The objectives are: Understand the basics of queues and the flow of cases and activities through queues.
Introduction. SmartArt Graphics. Word 2010 SmartArt Graphics. Video: SmartArt Graphics in Word To Insert a SmartArt Illustration: Page 1
 Word 2010 SmartArt Graphics Introduction Page 1 SmartArt allows you to visually communicate information rather than simply using text. Illustrations can really enhance your document, and SmartArt makes
How to Locate and Start PowerPoint 2007? Click on Start Click on All Programs Click on Microsoft Office Folder
 How to Locate and Start PowerPoint 2007? Click on Start Click on All Programs Click on Microsoft Office Folder Click on Microsoft Office PowerPoint 2007 Menu Bar Office Button How to Save a PowerPoint
1. The narratives, diagrams, charts, and other written materials that explain how a system works are collectively called
 CH 3 MULTIPLE CHOICE 1. The narratives, diagrams, charts, and other written materials that explain how a system works are collectively called a) documentation. b) data flows. c) flowcharts. d) schema.
An Automatic Tool for Checking Consistency between Data Flow Diagrams (DFDs)
") An Automatic Tool for Checking Consistency between Data Flow Diagrams (DFDs) Rosziati Ibrahim, Siow Yen Yen Abstract System development life cycle (SDLC) is a process uses during the development of any
An Automatic Tool for Checking Consistency between Data Flow Diagrams (DFDs) Rosziati Ibrahim, Siow Yen Yen Abstract System development life cycle (SDLC) is a process uses during the development of any
ASSIGNMENT- I Topic: Functional Modeling, System Design, Object Design. Submitted by, Roll Numbers:-49-70
 ASSIGNMENT- I Topic: Functional Modeling, System Design, Object Design Submitted by, Roll Numbers:-49-70 Functional Models The functional model specifies the results of a computation without specifying
Fundamentals of Health Workflow Process Analysis and Redesign
 Fundamentals of Health Workflow Process Analysis and Redesign This material Comp0_Unit3d was developed by Duke University, funded by the Department of Health and Human Services, Office of the National
How do archivists identify and capture records?
 QUESTION How do archivists identify and capture records? AUTOMATED SYSTEMS MEETING THE CHALLENGE Critical Skill Set: Information System Analysis and Design Skills Being able to create conceptual models
Chapter : Analysis Modeling
 Chapter : Analysis Modeling Requirements Analysis Requirements analysis Specifies software s operational characteristics Indicates software's interface with other system elements Establishes constraints
An Introduction to Business Process Modeling using Data Flow Diagrams
 An Introduction to Business Process Modeling using Data Flow Diagrams BSAD 141 Dave Novak BDIS: 2.2 (61-77) Lecture Overview Systems and Business processes Business process models Data Flow Diagrams (DFDs)
CHAPTER 19: Building a Preliminary Behavioral Model
 1 z 7 CHAPTER 19: Building a Preliminary Behavioral Model Things are always at their best in their beginning. Blaise Pascal Lettres Provinciales, 1656-1657, no. 4 IN THIS CHAPTER, YOU WILL LEARN: Why a
Microsoft Excel Chapter 1. Creating a Worksheet and an Embedded Chart
 Microsoft Excel 2010 Chapter 1 Creating a Worksheet and an Embedded Chart Objectives Describe the Excel worksheet Enter text and numbers Use the Sum button to sum a range of cells Copy the contents of
Microsoft Word Dissertation Workshop
 Microsoft Word Dissertation Workshop Using this guide This guide contains descriptive text, instructions and accompanying online content from lynda.com. Read the text and click the lynda.com links to view
PAF Chapter Junior Section Name : Class: 5 Sec: Date: SECTION - A
 ICT CLASS-5 COMPREHENSIVE WORKSHEET Mid Term Session 2015-16 The City School PAF Chapter Junior Section Name : Class: 5 Sec: Date: Q1. Encircle any one correct option. i.) SECTION - A is an electronic
Requirements Analysis. SE 555 Software Requirements & Specification
 Requirements Analysis Goals of Requirements Analysis Create requirements containing sufficient detail and of high enough quality to allow realistic project planning as well as successful design and implementation.
Trident Trust PowerPoint User Guide
 Trident Trust PowerPoint User Guide Intelligent Documents October 2017 1 Overview The PowerPoint template is designed to make it quick and easy to create consistent and professional presentations conforming
Data Flow Diagrams System Analysis ( (
 7 Data Flow Diagrams System Analysis (1932475( Kendall & Kendall 7-1 Data Flow Diagrams A top down approach to diagramming data movement, it moves from general to specific. Graphically characterize data
DYNAMICS 365 BUSINESS PROCESS VISUALIZATION USING VISIO
 MICROSOFT LABS JANUARY 10, 2019 DYNAMICS 365 BUSINESS PROCESS VISUALIZATION USING VISIO A Solution to create a Microsoft VISIO template by consuming the configured entity values from the CRM entity record.
By: Ms. Fatima Shannag Ms. Essra Al-Mousa. Edited by: Khawlah Almutlaq
 By: Ms. Fatima Shannag Ms. Essra Al-Mousa 1 PowerPoint web app PowerPoint Web App is a limited version of PowerPoint, enabling you to display information through slide shows A PowerPoint presentation is
Enterprise Architecture Views and Viewpoints in ArchiMate - Reference
 Enterprise Architecture Views and Viewpoints in ArchiMate - Reference Source: ArchiMate 2.0 Specification, chapter 8, http://pubs.opengroup.org/architecture/archimate2-doc/chap08.html Views and Viewpoints
Visio Core Essentials
 Visio 2013 - Core Essentials Prerequisites Windows Vista, Windows 7, or Windows 8 Overview This first level workshop shows participants how to get the most out of Microsoft Visio 2013. The course includes
Business Process Modeling. Version /10/2017
 Business Process Modeling Version 1.2.1-16/10/2017 Maurizio Morisio, Marco Torchiano, 2012-2017 3 BP Aspects Process flow Process modeling UML Activity Diagrams BPMN Information Conceptual modeling UML
Enterprise Architect basic usage
 1. Creating a New Project Enterprise Architect basic usage When Enterprise Architect starts, it displays a greeting screen. To create a new project first choose Create a New Project... and then choose
D365 Modern Interface
 D365 Modern Email Interface D365 Modern Email Interface is a solution providing inline options in case/ contact form enabling organization and management of emails in the same page in Dynamic 365 CRM.
Microsoft Excel Chapter 2. Formulas, Functions, and Formatting
 Microsoft Excel 2010 Chapter 2 Formulas, Functions, and Formatting Objectives Enter formulas using the keyboard Enter formulas using Point mode Apply the AVERAGE, MAX, and MIN functions Verify a formula
Working with Wikispaces
 Working with Wikispaces Create an Account 1. Go to http://www.wikispaces.com/ 2. Click in the Get Started box on the top right of the page. 3. Enter a username. Your username will be visible to the students.
Objective 3.3: Insert and format SmartArt graphics
 Objective 3.3: Insert and format SmartArt graphics Objective 3.3: Insert and format SmartArt graphics When you want to clearly illustrate a concept such as a process, cycle, hierarchy, or relationship,
PowerPoint Tutorial 2: Adding and Modifying Text and Graphic Objects 2013
 PowerPoint Tutorial 2: Adding and Modifying Text and Graphic Objects Microsoft Office 2013 2013 Objectives Insert a graphic from a file Insert, resize, and reposition clip art Modify the color and shape
Data and Process Modeling
 Chapter 5 Data and Process Modeling 5 CHAPTER Data and Process Modeling Chapter 5 is the second of four chapters in the systems analysis phase of the SDLC. This chapter discusses data and process modeling
Table of Contents. Heading
 Heading Table of Contents Heading... 2 Business Diagramming Tool for Windows... 3 Lesson 1: Creating Simple Organization Chart with ConceptDraw PRO.... 3 Lesson 2: Creating Basic Flow Chart with ConceptDraw
Word 2003: Flowcharts Learning guide
 Word 2003: Flowcharts Learning guide How can I use a flowchart? As you plan a project or consider a new procedure in your department, a good diagram can help you determine whether the project or procedure
CSSE 374: UML Activity Diagrams. Shawn Bohner Office: Moench Room F212 Phone: (812)
") CSSE 374: UML Activity Diagrams Shawn Bohner Office: Moench Room F212 Phone: (812) 877-8685 Email: bohner@rose-hulman.edu Learning Outcomes: Patterns, Tradeoffs Identify criteria for the design of a software
CSSE 374: UML Activity Diagrams Shawn Bohner Office: Moench Room F212 Phone: (812) 877-8685 Email: bohner@rose-hulman.edu Learning Outcomes: Patterns, Tradeoffs Identify criteria for the design of a software
Introduction to Microsoft 2007 Office
 Introduction to Microsoft 2007 Office Introduction Welcome to the new world of Microsoft 2007 Office. As you may have heard, 2007 Office is a major change from previous Office versions. If you are new
Word 2007: Flowcharts Learning guide
 Word 2007: Flowcharts Learning guide How can I use a flowchart? As you plan a project or consider a new procedure in your department, a good diagram can help you determine whether the project or procedure
Lab 19: Excel Formatting, Using Conditional Formatting and Sorting Records
 Lab 19: Excel Formatting, Using Conditional Formatting and Sorting Records () CONTENTS 1 Lab Topic... 2 1.1 In-Lab... 2 1.1.1 In-Lab Materials... 2 1.1.2 In-Lab Instructions... 2 1.2 Out-Lab... 9 1.2.1
Your Total Training Resource. Microsoft Visio. To Schedule / Need Additional Information
 Microsoft Visio Microsoft Visio drawing and diagramming software makes it easy for business professionals to visualize, explore, and communicate complex information. Go from complicated text and tables
Acknowledgements...xvii. Foreword...xix
 Contents Acknowledgements...xvii Foreword...xix Chapter 1 An Introduction to BPM... 1 1.1 Brief History of Business Process Management... 1 1.1.1 The Need for Business Value... 1 1.1.2 The Production Line...
CaseComplete Roadmap
 CaseComplete Roadmap Copyright 2004-2014 Serlio Software Development Corporation Contents Get started... 1 Create a project... 1 Set the vision and scope... 1 Brainstorm for primary actors and their goals...
Getting to Know PowerPoint. Use IT+
 Getting to Know PowerPoint Use IT+ Introduction PowerPoint 2013 is a presentation software that allows you to create dynamic slide presentations. Slideshows can include animation, description, images,
Microsoft Word Handout
 Microsoft Word Handout Navigating Microsoft Word Maneuvering your way through Word is the key to working efficiently on all of your documents. This guide will help you locate the necessary tools and understand
Symbio Web 5. Quick Guide
 Symbio Web 5 Quick Guide Content 01 Overview: Symbio 02 Intro & Navigation 03 Process architecture 04 Process modeling 05 Organization & Repository objects 06 Release workflow 07 Variants management 08
PAGES, NUMBERS, AND KEYNOTE BASICS
 PAGES, NUMBERS, AND KEYNOTE BASICS Pages, Numbers, and Keynote are applications developed by Apple that are comparable to Microsoft Office and Google Docs. Pages, Numbers, and Keynote comes free with your
Atlas 2.0. Atlas Help
 Atlas 2.0 Atlas Help Borland Software Corporation 700 King Farm Blvd, Suite 400 Rockville, MD 20850 Copyright Micro Focus 2015. All rights reserved. Portions Copyright 1998-2009 Borland Software Corporation
PowerPoint 2007 Cheat Sheet
 ellen@ellenfinkelstein.com 515-989-1832 PowerPoint 2007 Cheat Sheet Contents Templates and Themes... 2 Apply a corporate template or theme... 2 Format the slide master... 2 Work with layouts... 3 Edit
Activity Diagram Written Date : September 02, 2016
 Written Date : September 02, 2016 s describe how activities are coordinated to provide a service which can be at different levels of abstraction. Typically, an event needs to be achieved by some operation,
Click the buttons in the interactive below to become familiar with the drawing tool's commands.
 Google Documents Inserting Text Boxes and Shapes Introduction Page 1 Google Documents has a drawing tool designed for inserting text boxes and shapes into your document. Although not necessary for every
Structured Modeling Methods. Lecture 15: Advantages and Disadvantages. University of Toronto Department of Computer Science.
 Lecture 15: Structured Modeling Methods Basics of Structured Analysis Notations used Modeling Process Variants SADT SASS SSADM SRD Advantages and Disadvantages 2001, Steve Easterbrook CSC444 Lec15 1 Definition