Advanced Reporting Options Course #E211.A
|
|
|
- Alfred Lester
- 5 years ago
- Views:
Transcription
1 Advanced Reporting Options Course #E211.A Presented by: Arnold Wheatley Shelby Contract Trainer 2018 Shelby Systems, Inc. Other brand and product names are trademarks or registered trademarks of the respective holders.
2 Objective To present a brief overview of the Power BI tools in Excel This session presents the following topics: What s required Power Query, Power View, Power Map overview Power Pivot and Power BI Desktop How to Enable Power BI Tools The difference between Pivot and PowerPivot How to use Multiple Data Sources Manage Data Models 2

3 What s all this Power stuff? Power Business Intelligence tools are add-ins to Microsoft Excel 2013 and come standard in 2016*. Power Query Power View o Power Chart Power Map Power Pivot *Though standard, these tools have to be enabled, and in the case of Power View, added to the Ribbon. 3
4 What s Required Office Professional 2016 Office 2013 Professional Plus Office 2016 Professional Plus (available via volume licensing only) Excel 2013 standalone Excel 2016 standalone Excel 2010 requires a free download of the PowerPivot add-in NOT included in most subscription products Office 365 Education, University, Home, Personal, Small Business Premium, Business, Business Premium, Enterprise E1 NOT included with these perpetually licensed products Office Home & Student (2013, 16), Home & Business (2013, 16), Mac, Android, Standard 2013, Professional
5 How to Enable Excel 2010 a free download is required Excel 2013 Click on Files > Options Click on Add-Ins Select COM Add-Ins from the Manage dropdown; then click Go Check Microsoft Office PowerPivot for Excel 2013 ; then click OK Do the same for Power Query, Power View and Power Maps Excel 2016 Click on Files > Options Click on Add-Ins Select COM Add-Ins from the Manage dropdown; then click Go Check Microsoft PowerPivot for Excel ; then click OK Do the same for Power View and Power Maps Once enabled, you will have to add Power View to the ribbon. 5
6 Pivot vs PowerPivot PivotTable has been in Excel since 1993 (Excel 5) PivotTable is limited to 1,048,576 rows of data PowerPivot is quicker uses the xvelocity engine PowerPivot virtually removes limits on rows you can analyze (useful for Contributions information) Power Pivot uses the DAX language to create calculated fields Ability to import data from many different sources, including but not limited to SQL Azure Oracle You can even import data by linking to a website or glean Facebook data! Excel Access Csv files Ability to relate data from many different sources and hide the complexity of the underlying database from clients. 6
7 Data Modeling A Data Model allows you to integrate data from multiple tables, effectively building a relational data source inside an Excel workbook. Within Excel, Data Models are used transparently, providing tabular data used in PivotTables and PivotCharts. A Data Model is visualized as a collection of tables in a Field List, and most of the time, you never even know it s there. 7
8 Data Modeling There are two different entrances to Data Modeling: Using Power Query / Get and Transform Using PowerPivot Both give access to the same Data Model, but there are big differences between the tools available for managing Data Models. 8

9 Data Modeling Start Data Modeling from the Data tab Click New Query under the Get & Transform group Click From Database under the Power Query Ribbon Tab Both versions Click Manage under the Power Pivot Ribbon Tab 9

10 Get & Transform Data Modeling 10
11 Get & Transform Data Modeling At this point, you select the following tables / views 1. Cust_v_GL_AccountNumbers 2. GL_Journal 3. GL_JournalDetail 4. GL_Budget 5. The GL_BudgetDetail only reason we need #2 & #4 is they contain relating fields between #1 & #3 plus #1 & #5. We will later hide them from the client s view. Select them and then click Load. Be patient 11

12 Get & Transform Data Modeling 12
13 Power Query / Get and Transform Power Query has numerous graphic tools that help you change (transform) your data; they are too numerous to itemize. As you use them, a Query is built using the M language Queries are listed in the order of their creation 13


14 Power Query / Get and Transform 14
15 Transforming Data You will add a column that looks at the AccountNumber in the view to determine its Account Type. Because the column is formatted as a number, and you want to look at the beginning number, you need to change the column to text. 15

16 Transforming Data Double Click the cust_v_gl_account_num bers query to open the Query Editor. 16
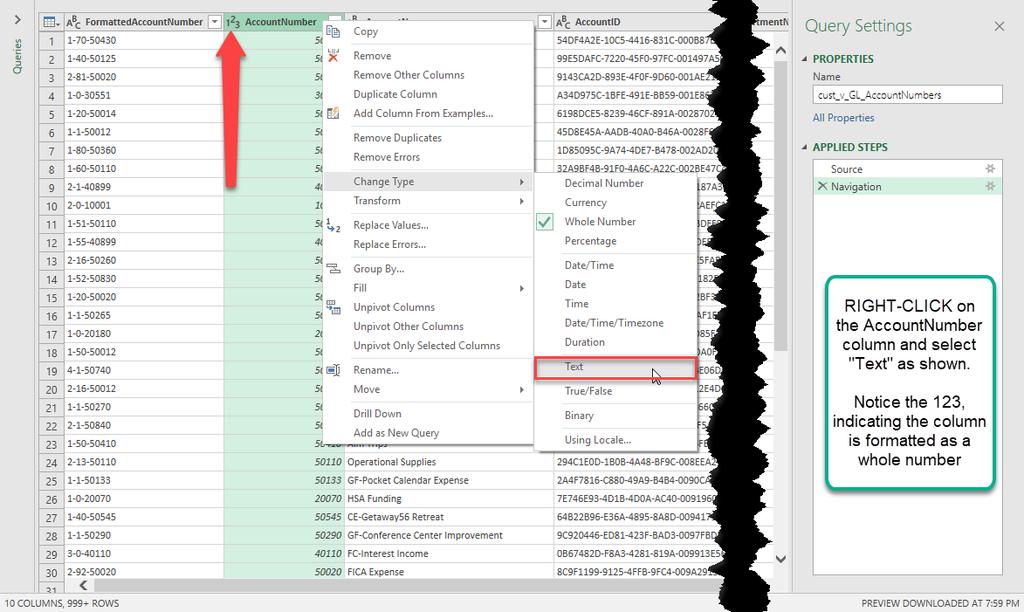
17 Transforming Data 17

18 Transforming Data Adding a column This new column becomes the basis for a Slicer 18

19 PowerPivot Data Models Now you switch to PowerPivot to see some differences between the two interfaces Looking at the Menu categories, one can see there are big differences between a PivotTable and Power Pivot: TableS, RelationshipS. For those familiar with SQL, these are recognizable in their purpose. 19
20 Manage Data Models Import data from a relational database Import data from OData Data Feed Microsoft SQL Server Microsoft SQL Azure MS SQL Server Parallel Data warehouse MS Access Oracle Teradata Sybase Informix IBM DB2 OLEDB / ODBC connections MS Analysis Services MS Reporting Services Report Excel File / Text Files & more! Import data from an external source by selecting from a list of previously used sources 20

21 Checking Relationships To switch out of Data View, just click Diagram View. Hovering over the relationship arrow between tables highlights the fields involved in the relationship. 21

22 Hiding Tables / Fields 22


23 Measures / KPIs 23

24 Create a KPI 24

25 Create a PivotTable 25

26 Add Slicers Slicers are the equivalent of putting these fields in the Filter box of a PivotTable. The difference is ease of use and esthetics. 26

27 Results!! 27
28 Additional stuff Try adding a pivot chart from the Data Model to graphically see trends over years. 28
29 Power BI Desktop Has the same Data Modeling capability as Excel s Power Query Can Import Power Query queries, Power Pivot Model, and Power View worksheets Works with both on-premises data and cloud services Powerful reporting capabilities using the Data Model 29
30 Power BI Desktop Great Visualizations: Bar and column charts Layered and stacked area charts Single number cards Multi-row cards Combination charts Doughnut charts Gauge charts Line charts Maps Filled maps Matrix Pie charts Scatter and bubble charts Slicers Standalone images Tables Tree maps Waterfall charts 30
31 Power BI Desktop Content Packs Allow subscribers to quickly connect to an account and see data through live dashboards and interactive pre-built reports Mobile Friendly with apps for ios Android Windows 31
32 Q&A Class Discussion ideas for reports. 32

33 Arnold Wheatley Shelby Contract Trainer After pastoring churches in Pennsylvania and Delaware, Arnold, an ordained minister, was asked by the Headquarters Office of the PennDel District of the Assemblies of God to establish and direct its IT department. During his 19-year tenure, he was instrumental in transitioning their headquarters from a custom ChMS to Shelby HQ, Arena HQ, and ShelbyNext. Experienced with both church ministries and the unique needs of HQ offices, his desire is to help others configure and use Shelby products more efficiently. Arnold is a Shelby Trainer for all Shelby platforms.
2017 Shelby Systems, Inc. Other brand and product names are trademarks or registered trademarks of the respective holders.
 2017 Shelby Systems, Inc. Other brand and product names are trademarks or registered trademarks of the respective holders. Objective To provide a brief overview of some of the functionality available to
Arena Assignments: Practical Application Course #A219
 Arena Assignments: Practical Application Course #A219 Presented by: Arnold Wheatley Shelby Contract Trainer 2018 Shelby Systems, Inc. Other brand and product names are trademarks or registered trademarks
SQL Server Reporting Services for v.5, Arena or ShelbyNext Financials How to Start!
 SQL Server Reporting Services for v.5, Arena or ShelbyNext Financials How to Start! (Course E17) Presented by: Arnold Wheatley Shelby Contract Trainer 2017 Shelby Systems, Inc. Other brand and product
Arena Administrator: HTML & SQL Course #A244
 Arena Administrator: HTML & SQL Course #A244 Presented by: Arnold Wheatley Shelby Contract Trainer 2018 Shelby Systems, Inc. Other brand and product names are trademarks or registered trademarks of the
Power BI Architecture
 What is Power BI? Power BI is a collection of software services, apps, and connectors that work together to turn unrelated sources of data into coherent, visually immersive, and interactive insights. -
Microsoft Power BI for O365
 Microsoft Power BI for O365 Next hour.. o o o o o o o o Power BI for O365 Data Discovery Data Analysis Data Visualization & Power Maps Natural Language Search (Q&A) Power BI Site Data Management Self Service
MCSA BI Reporting. A Success Guide to Prepare- Analyzing and Visualizing Data with Microsoft Excel. edusum.com
 70-779 MCSA BI Reporting A Success Guide to Prepare- Analyzing and Visualizing Data with Microsoft Excel edusum.com Table of Contents Introduction to 70-779 Exam on Analyzing and Visualizing Data with
10778A: Implementing Data Models and Reports with Microsoft SQL Server 2012
 10778A: Implementing Data Models and Reports with Microsoft SQL Server 2012 Course Overview This course provides students with the knowledge and skills to empower information workers through self-service
Microsoft EXAM Analyzing and Visualizing Data with Microsoft Excel. m/ Product: Demo File
 Page No 1 https://www.dumpsplanet.com m/ Microsoft 70-779 EXAM Analyzing and Visualizing Data with Microsoft Excel Product: Demo File For More Information: https://www.dumpsplanet.com/70-779-dumps Question:
What s new in Excel 2013? Provided by Work Smart
 What s new in Excel 2013? Provided by Work Smart Contents Topics in this guide include: Visualize Share Analyze Touch For more information The first thing you see when you open Excel 2013 is a brand new
Arena Reports Using Report Builder
 Arena Reports Using Report Builder (Course #A127) Presented by: Staci Sampson Contract Trainer 2017 Shelby Systems, Inc. Other brand and product names are trademarks or registered trademarks of the respective
Arena Reports Using Report Builder
 Arena Reports Using Report Builder (Course #A127) Presented by: Ben Lane Senior Staff Trainer 2018 Shelby Systems, Inc. Other brand and product names are trademarks or registered trademarks of the respective
Arena Reports (Course # A117)
") Arena Reports (Course # A117) Presented by: Staci Sampson Shelby Contract Trainer Objective This session covers information on how to add and organize Arena reports. The following topics are presented
Arena Reports (Course # A117) Presented by: Staci Sampson Shelby Contract Trainer Objective This session covers information on how to add and organize Arena reports. The following topics are presented
Welcome! Power BI User Group (PUG) Copenhagen
 Copenhagen") Welcome! Power BI User Group (PUG) Copenhagen Connect to Data in Power BI Desktop Just Thorning Blindbæk Consultant, Trainer and Speaker Connect to Data in Power BI Desktop Basic introduction to data connectivity
Welcome! Power BI User Group (PUG) Copenhagen Connect to Data in Power BI Desktop Just Thorning Blindbæk Consultant, Trainer and Speaker Connect to Data in Power BI Desktop Basic introduction to data connectivity
Excel 2013 PivotTables and PivotCharts
 Excel 2013 PivotTables and PivotCharts PivotTables... 1 PivotTable Wizard... 1 Creating a PivotTable... 2 Groups... 2 Rows Group... 3 Values Group... 3 Columns Group... 4 Filters Group... 5 Field Settings...
Creating Automated Dashboard Excel 2013 Contents
 Creating Automated Dashboard Excel 2013 Contents Summarize Data Using Pivot Table... 2 Constructing Report Summary... 2 Create a PivotTable from worksheet data... 2 Add fields to a PivotTable... 2 Grouping
Course Outline. Microsoft Power BI Interactive Data Visualizations Course : 2 days Instructor Led
 Microsoft Power BI Interactive Data Visualizations Course 752550: 2 days Instructor Led ABOUT THE COURSE Microsoft Power BI transforms your company data into rich visuals that facilitate new ways of thinking
Arena Dashboard Part 1: Querying Tags & Groups
 Arena Dashboard Part 1: Querying Tags & Groups (Course A20) Presented by: Alex Nicoletti, Arena Product & Implementations Manager And Arnold Wheatley, Shelby Contract Trainer 2017 Shelby Systems, Inc.
Visualizing PI System Data with Dashboards and Reports
 Visualizing PI System Data with Dashboards and Reports Presented by Mike Wood Product Manager Experience COLLECT HISTORIZE FIND ANALYZE DELIVER VISUALIZE What s New with Visualization in PI System 2010?
COURSE SYLLABUS COURSE TITLE:
 1 COURSE SYLLABUS COURSE TITLE: FORMAT: CERTIFICATION EXAMS: 55164AC Quick Powerful Graphics with Power View, PowerPivot, Power Query, Power Map, and Power BI Instructor-Led None This course syllabus should
Lab 01 Developing a Power Pivot Data Model in Excel 2013
 Power BI Lab 01 Developing a Power Pivot Data Model in Excel 2013 Jump to the Lab Overview Terms of Use 2014 Microsoft Corporation. All rights reserved. Information in this document, including URL and
Fi-domain names OData service description
 Fi-domain names OData service description Version: 2.1 Page 1(18) 1 Introduction... 3 2 What is OData?... 4 2.1 OData: technical description... 4 3 OData service of fi-domain names... 6 3.1 Rights of use
Updating your Business Intelligence Skills to Microsoft SQL Server 2012 Course 40009A; 3 Days, Instructor-led
 Updating your Business Intelligence Skills to Microsoft SQL Server 2012 Course 40009A; 3 Days, Instructor-led Course Description This three-day instructor-led course provides existing SQL Server Business
Data Visualization via Conditional Formatting
 Data Visualization Data visualization - the process of displaying data (often in large quantities) in a meaningful fashion to provide insights that will support better decisions. Data visualization improves
Advance Excel Performing calculations on data 1. Naming groups of data 2. Creating formulas to calculate values
 Advance Excel 2013 Getting started with Excel 2013 1. Identifying the different Excel 2013 programs 2. Identifying new features of Excel 2013 a. If you are upgrading from Excel 2010 b. If you are upgrading
GO! with Microsoft Excel 2016 Comprehensive
 GO! with Microsoft Excel 2016 Comprehensive First Edition Chapter 7 Creating PivotTables and PivotCharts Learning Objectives Create a PivotTable Report Use Slicers and Search Filters Modify a PivotTable
How Commercial Off-the-Shelf (COTS) Business Intelligence (BI) Tools Can Improve Financial Management Analysis
 Business Intelligence (BI) Tools Can Improve Financial Management Analysis") How Commercial Off-the-Shelf (COTS) Business Intelligence (BI) Tools Can Improve Financial Management Analysis Carolyn L. North, CPA, CGFM, CDFM/A, PMP R. Ross Hosse, CDFM Purpose of Business Intelligence
How Commercial Off-the-Shelf (COTS) Business Intelligence (BI) Tools Can Improve Financial Management Analysis Carolyn L. North, CPA, CGFM, CDFM/A, PMP R. Ross Hosse, CDFM Purpose of Business Intelligence
Microsoft Analyzing and Visualizing Data with Microsoft Excel.
 Microsoft 70-779 Analyzing and Visualizing Data with Microsoft Excel https://killexams.com/pass4sure/exam-detail/70-779 DEMO Find some pages taken from full version Killexams 70-779 questions and answers
Microsoft End to End Business Intelligence Boot Camp
 Microsoft End to End Business Intelligence Boot Camp 55045; 5 Days, Instructor-led Course Description This course is a complete high-level tour of the Microsoft Business Intelligence stack. It introduces
MS-55045: Microsoft End to End Business Intelligence Boot Camp
 MS-55045: Microsoft End to End Business Intelligence Boot Camp Description This five-day instructor-led course is a complete high-level tour of the Microsoft Business Intelligence stack. It introduces
Create a Relationship to build a Pivot Table
 Create a Relationship to build a Pivot Table In Excel 2013 and 2016/365 you can now create a relationship between tables of data. This is a feature that can be used to pull data from the different tables
Arena: Edit Existing Reports
 Arena: Edit Existing Reports (Course A27) Presented by: Ben Lane Senior Staff Trainer 2017 Shelby Systems, Inc. Other brand and product names are trademarks or registered trademarks of the respective holders.
AVANTUS TRAINING PTE LTD
 [MS20779]: Analyzing Data with Excel Length : 3 Days Audience(s) : IT Professionals Level : 300 Technology : Power BI Delivery Method : Instructor-led (Classroom) Course Overview The main purpose of the
ADVANCED EXCEL Course Modules for Advance Excel Training Online (MS Excel 2013 Course):
:") Course Modules for Advance Excel Training Online (MS Excel 2013 Course): ADVANCED EXCEL 2013 1 Getting started with Excel 2013 A Identifying the different Excel 2013 programs B Identifying new features
Course Modules for Advance Excel Training Online (MS Excel 2013 Course): ADVANCED EXCEL 2013 1 Getting started with Excel 2013 A Identifying the different Excel 2013 programs B Identifying new features
WELCOME TO TECH IMMERSION
 WELCOME TO TECH IMMERSION Track: SQL/BI PowerPivot with Excel 2010 Presenter: Jeff Jones Outline o BI EcoSystem o PowerPivot for Excel What, Why, Who? o Using PowerPivot o New Powerful Formulas o Using
Microsoft Excel Pivot Tables & Pivot Table Charts
 Microsoft Excel 2013 Pivot Tables & Pivot Table Charts A pivot table report allows you to analyze and summarize a million rows of data in Excel 2013 without entering a single formula. Pivot Tables let
Microsoft Excel 2013/2016 Pivot Tables
 Microsoft Excel 2013/2016 Pivot Tables Creating PivotTables PivotTables are powerful data analysis tools. They let you summarize data in various ways and instantly change the view you use. A PivotTable
Exchange (Copy, Import, Export) Data Between Excel and Access
 Data Between Excel and Access") Excel usage is widespread and Excel is often the go-to Office application for data entry, analysis, and manipulation. Microsoft Access provides relational database capability in a compact desktop environment.
Excel usage is widespread and Excel is often the go-to Office application for data entry, analysis, and manipulation. Microsoft Access provides relational database capability in a compact desktop environment.
Building Data Models with Microsoft Excel PowerPivot
 Building Data Models with Microsoft Excel PowerPivot Overview This 3-day course extends the power of Excel and takes you inside the PowerPivot add-in for Excel 2013/2016. Based on the book Microsoft Excel
exam.23q Analyzing and Visualizing Data with Microsoft Excel
 70-779.exam.23q Number: 70-779 Passing Score: 0 Time Limit: 120 min 70-779 Analyzing and Visualizing Data with Microsoft Excel Exam A QUESTION 1 Note: This question is part of a series of questions that
SharePoint Community of Practice
 1 The NYS Forum, Inc. SharePoint Community of Practice December 12, 2017 1:00-3:00 pm (12:30 pm Check-In) The NYS Forum 24 Aviation Road, Suite 206, Albany New York SharePoint Community of Practice 2 December
Bay Area BI User Group Mountain View 8 May, Mastering the Excel CUBE Functions
 Bay Area BI User Group Mountain View 8 May, 2014 Mastering the Excel CUBE Functions Presenter Introduction Peter Myers BI Expert Bitwise Solutions BBus, SQL Server MCSE, MCT, SQL Server MVP (since 2007)
Tutorial: Create an Excel Dashboard. Overview. **** Download the Example Dashboard ****
 Tutorial: Create an Excel Dashboard This page walks through building an Excel dashboard with a mobile tool called CommCare. Similar to how Excel helps people build spreadsheets, CommCare enables anyone
Create a Relationship to build a Pivot Table
 Create a Relationship to build a Pivot Table In Excel 2013 and 2016/365 you can now create a relationship between tables of data. This is a feature that can be used to pull data from the different tables
Data Source Connection
 Data Source Connection Microsoft Excel Jump To Enterprise Professional (Cloud) Enterprise Prerequisites Download and install the appropriate Microsoft ODBC driver for your version of Microsoft Excel. This
Microsoft Office Excel 2013
 Microsoft Office Excel 2013 PivotTables and PivotCharts University Information Technology Services Training, Outreach, Learning Technologies and Video Production Copyright 2014 KSU Department of University
Shawn Dorward, MVP. Getting Started with Power Query
 Shawn Dorward, MVP Getting Started with Power Query Meet our Presenter InterDyn Artis specializes in the implementation, service and support of Microsoft Dynamics Enterprise Resource Planning (ERP) and
Highline Excel 2016 Class 23: Introduction to Power BI Desktop to Create Data Model & Visualization
 Highline Excel 2016 Class 23: Introduction to Power BI Desktop to Create Data Model & Visualization Table of Contents Visualization Goal:... 1 Power BI Desktop... 2 Download Power BI Desktop for FREE Don
MCC Lunch & Learn Series Series: One. Quick Tips & Shortcuts To Save You Time. Microsoft Excel 2016
 MCC Lunch & Learn Series Series: One Quick Tips & Shortcuts To Save You Time Microsoft Excel 2016 What s New In Excel 2016 Tell Me Smart Lookup 6 New Chart Types Waterfall Charts 3D Maps Get and Transform
Updating your Business Intelligence Skills to Microsoft SQL Server 2012
 Course 40009A: Updating your Business Intelligence Skills to Microsoft SQL Server 2012 Course Details Course Outline Module 1: Introduction to SQL Server 2012 for Business Intelligence This module provides
Developing SQL Data Models
 Course 20768B: Developing SQL Data Models Page 1 of 5 Developing SQL Data Models Course 20768B: 2 days; Instructor-Led Introduction The focus of this 2-day instructor-led course is on creating managed
55049: PowerPivot, Power View and SharePoint 2013 Business Intelligence Center for Analysts
 Let s Reach For Excellence! TAN DUC INFORMATION TECHNOLOGY SCHOOL JSC Address: 103 Pasteur, Dist.1, HCMC Tel: 08 38245819; 38239761 Email: traincert@tdt-tanduc.com Website: www.tdt-tanduc.com; www.tanducits.com
Developing SQL Data Models
 Developing SQL Data Models 20768B; 3 Days; Instructor-led Course Description The focus of this 3-day instructor-led course is on creating managed enterprise BI solutions. It describes how to implement
Table of Contents: Microsoft Power Tools for Data Analysis #15 Comprehensive Introduction to Power Pivot & DAX. Notes from Video:
 Microsoft Power Tools for Data Analysis #15 Comprehensive Introduction to Power Pivot & DAX Table of Contents: Notes from Video: 1) Standard PivotTable or Data Model PivotTable?... 3 2) Excel Power Pivot
Cityworks Analytics By Azteca Systems Inc.
 Cityworks Analytics 2014 By Azteca Systems Inc. COPYRIGHT INFORMATION Copyright 2014 by Azteca Systems Inc. All rights reserved. Azteca Systems Inc. 11075 S. State St., Suite 24 Sandy, UT, 84070, U.S.A.
Shawn Dorward, MVP. Getting Started with Power Query
 Shawn Dorward, MVP Getting Started with Power Query Shawn Dorward Microsoft MVP, Business Solutions Dynamics GP Practice Lead Shawn.Dorward@InterdynArtis.com Headquartered in Charlotte, NC Founded in 1989
Hands-On Lab. Developing BI Applications. Lab version: Last updated: 2/23/2011
 Hands-On Lab Developing BI Applications Lab version: 1.0.0 Last updated: 2/23/2011 CONTENTS OVERVIEW... 3 EXERCISE 1: USING THE CHART WEB PART... 4 Task 1 Add the Chart Web Part to the page... 4 Task 2
PowerPivot, an Introduction. By: Steve Lewis Principal Pyxis Analytics
 PowerPivot, an Introduction By: Steve Lewis Principal Pyxis Analytics Agenda What is the BISM Model? Components of the BISM Model DAX Overview Walkthroughs What is the BISM Model Business Intelligence
Taking a First Look at Excel s Reporting Tools
 CHAPTER 1 Taking a First Look at Excel s Reporting Tools This chapter provides you with an overview of Excel s reporting features. It shows you the principal types of Excel reports and how you can use
MicroStrategy Desktop Quick Start Guide
 MicroStrategy Desktop Quick Start Guide Version: 10.4 10.4, December 2017 Copyright 2017 by MicroStrategy Incorporated. All rights reserved. Trademark Information The following are either trademarks or
Excel Power User Training Courses. What if all of your people could become Excel power users!
 What if all of your people could become Excel power users! Excel Power User Training Courses The new fast track to becoming an Excel power user Microsoft Excel is an essential tool for most modern businesses,
Advanced Excel Skills
 1 Advanced Excel Skills Course Level Advanced Level Target Population Existing, Experienced Users Course Duration 18 training hours Designed By 2 About Mastery is established to build a unique business
Arena: Modify Check-In Labels (Course #A231)
") Arena: Modify Check-In Labels (Course #A231) Presented by: Ben Lane Senior Staff Trainer 2018 Shelby Systems, Inc. Other brand and product names are trademarks or registered trademarks of the respective
Arena: Modify Check-In Labels (Course #A231) Presented by: Ben Lane Senior Staff Trainer 2018 Shelby Systems, Inc. Other brand and product names are trademarks or registered trademarks of the respective
Developing SQL Data Models(768)
") Developing SQL Data Models(768) Design a multidimensional business intelligence (BI) semantic model Create a multidimensional database by using Microsoft SQL Server Analysis Services (SSAS) Design, develop,
Developing SQL Data Models(768) Design a multidimensional business intelligence (BI) semantic model Create a multidimensional database by using Microsoft SQL Server Analysis Services (SSAS) Design, develop,
Excel Tables and Pivot Tables
 A) Why use a table in the first place a. Easy to filter and sort if you only sort or filter by one item b. Automatically fills formulas down c. Can easily add a totals row d. Easy formatting with preformatted
Reasons to Migrate from ProClarity to Pyramid Analytics
 Reasons to Migrate from ProClarity to Pyramid Analytics ProClarity was a fabulous tool when Analysis Services first came out in 2000. It made navigation of large data much easier for the average end user.
Copyright 2012 Pulse Systems, Inc. Page 1 of 64
 The Pulse IQ data cubes in combination with Excel Pivot Tables provide an excellent resource for compiling and presenting information for the financial and appointment data housed in the PulsePro PRMS
Excel 2007 Pivot Table Sort Column Headings
 Excel 2007 Pivot Table Sort Column Headings Pivot table is not used for sorting and filtering, it is used for summarizing and reporting. labels and col5 to values, as shown in the figure above (col1, col2
Building Self-Service BI Solutions with Power Query. Written By: Devin
 Building Self-Service BI Solutions with Power Query Written By: Devin Knight DKnight@PragmaticWorks.com @Knight_Devin CONTENTS PAGE 3 PAGE 4 PAGE 5 PAGE 6 PAGE 7 PAGE 8 PAGE 9 PAGE 11 PAGE 17 PAGE 20 PAGE
MicroStrategy Academic Program
 MicroStrategy Academic Program Creating a center of excellence for enterprise analytics and mobility. DATA PREPARATION: HOW TO WRANGLE, ENRICH, AND PROFILE DATA APPROXIMATE TIME NEEDED: 1 HOUR TABLE OF
Microsoft Excel 2010 Training. Excel 2010 Basics
 Microsoft Excel 2010 Training Excel 2010 Basics Overview Excel is a spreadsheet, a grid made from columns and rows. It is a software program that can make number manipulation easy and somewhat painless.
SBCUSD IT Training Program. MS Excel lll. VLOOKUPS, PivotTables, Macros, and More
 SBCUSD IT Training Program MS Excel lll VLOOKUPS, PivotTables, Macros, and More Revised 10/25/2018 TABLE OF CONTENTS VLOOKUP...2 VLOOLUP...2 SUMIF...3 SUMIF...3 PivotTable...4 Create PivotTable...4 Build
EVALUATION COPY. Unauthorized Reproduction or Distribution Prohibited SHAREPONT 2013 BUSINESS INTELLIGENCE
 SHAREPONT 2013 BUSINESS INTELLIGENCE SharePoint 2013 Business Intelligence (SBI2013 version 1.1.0) Copyright Information Copyright 2016 Webucator. All rights reserved. The Author Bruce Gordon Bruce Gordon
About the Tutorial. Audience. Prerequisites. Disclaimer & Copyright DAX
 About the Tutorial DAX (Data Analysis Expressions) is a formula language that helps you create new information from the data that already exists in your Data Model. DAX formulas enable you to perform data
Sample Data. Sample Data APPENDIX A. Downloading the Sample Data. Images. Sample Databases
 APPENDIX A Sample Data Sample Data If you wish to follow the examples used in this book and I hope you will you will need some sample data to work with. All the files referenced in this book are available
Tutorial 5: Working with Excel Tables, PivotTables, and PivotCharts. Microsoft Excel 2013 Enhanced
 Tutorial 5: Working with Excel Tables, PivotTables, and PivotCharts Microsoft Excel 2013 Enhanced Objectives Explore a structured range of data Freeze rows and columns Plan and create an Excel table Rename
Seamless Dynamic Web (and Smart Device!) Reporting with SAS D.J. Penix, Pinnacle Solutions, Indianapolis, IN
 Reporting with SAS D.J. Penix, Pinnacle Solutions, Indianapolis, IN") Paper RIV05 Seamless Dynamic Web (and Smart Device!) Reporting with SAS D.J. Penix, Pinnacle Solutions, Indianapolis, IN ABSTRACT The SAS Business Intelligence platform provides a wide variety of reporting
Paper RIV05 Seamless Dynamic Web (and Smart Device!) Reporting with SAS D.J. Penix, Pinnacle Solutions, Indianapolis, IN ABSTRACT The SAS Business Intelligence platform provides a wide variety of reporting
BASIC EXCEL SYLLABUS Section 1: Getting Started Section 2: Working with Worksheet Section 3: Administration Section 4: Data Handling & Manipulation
 BASIC EXCEL SYLLABUS Section 1: Getting Started Unit 1.1 - Excel Introduction Unit 1.2 - The Excel Interface Unit 1.3 - Basic Navigation and Entering Data Unit 1.4 - Shortcut Keys Section 2: Working with
COURSE 10977A: UPDATING YOUR SQL SERVER SKILLS TO MICROSOFT SQL SERVER 2014
 ABOUT THIS COURSE This five-day instructor-led course teaches students how to use the enhancements and new features that have been added to SQL Server and the Microsoft data platform since the release
Implementing Data Models and Reports with Microsoft SQL Server 2012
 Implementing Data Models and Reports with Microsoft SQL Server 2012 Module 1: Introduction to Business Intelligence and Data Modeling Introduction to Business Intelligence The Microsoft Business Intelligence
Datazen. Bent On-premise mobile BI. November 28, #sqlsatparma #sqlsat462
 Datazen On-premise mobile BI Bent Pedersen @Bent_n_pedersen www.biblog.eu Sponsors Organizers getlatestversion.it Who am i Senior Business Analytics Consultant at Kapacity 9 years with SQL Server Speaker
Instruction How To Use Excel 2007 Pivot Table Example Data Source
 Instruction How To Use Excel 2007 Pivot Table Example Data Source Excel pivot tables allow you to group the spreadsheet or external data source by any of your data fields. The screen snap below shows a
1. Data Analysis Yields Numbers & Visualizations. 2. Why Visualize Data? 3. What do Visualizations do? 4. Research on Visualizations
 Data Analysis & Business Intelligence Made Easy with Excel Power Tools Excel Data Analysis Basics = E-DAB Notes for Video: E-DAB-05- Visualizations: Table, Charts, Conditional Formatting & Dashboards Outcomes
DEVELOPING SQL DATA MODELS
 20768 - DEVELOPING SQL DATA MODELS CONTEÚDO PROGRAMÁTICO Module 1: Introduction to Business Intelligence and Data Modeling This module introduces key BI concepts and the Microsoft BI product suite. Introduction
Přehled novinek v SQL Server 2016
 Přehled novinek v SQL Server 2016 Martin Rys, BI Competency Leader martin.rys@adastragrp.com https://www.linkedin.com/in/martinrys 20.4.2016 1 BI Competency development 2 Trends, modern data warehousing
*Gartner Magic Quadrant for Business Intelligence and Analytics Platforms, by Rita L. Sallam, Cindi Howson, Carlie J. Idoine, Thomas W.
 *Gartner Magic Quadrant for Business Intelligence and Analytics Platforms, by Rita L. Sallam, Cindi Howson, Carlie J. Idoine, Thomas W. Oestreich, James Laurence Richardson, and Joao Tapadinhas February
Excel Expert 2016: Interpreting Data for Insights Exam
 Microsoft Office Specialist Excel Expert 2016: Interpreting Data for Insights Exam 77-728 Expert-level candidates for the Microsoft Excel 2016 exam have an advanced understanding of the Excel environment,
"Charting the Course... MOC B Updating Your SQL Server Skills to Microsoft SQL Server 2014 Course Summary
 Course Summary Description This five-day instructor-led course teaches students how to use the enhancements and new features that have been added to SQL Server and the Microsoft data platform since the
PASS4TEST. IT Certification Guaranteed, The Easy Way! We offer free update service for one year
 PASS4TEST \ We offer free update service for one year Exam : 70-467 Title : Designing Business Intelligence Solutions with Microsoft SQL Server 2012 Vendor : Microsoft Version : DEMO Get Latest & Valid
Implementing Data Models and Reports with SQL Server 2014
 Course 20466D: Implementing Data Models and Reports with SQL Server 2014 Page 1 of 6 Implementing Data Models and Reports with SQL Server 2014 Course 20466D: 4 days; Instructor-Led Introduction The focus
Big Data Analytics. Yossi Elkayam Sr. BI Architect Microsoft Services
 Big Data Analytics Yossi Elkayam Sr. BI Architect Microsoft Services yelkayam@microsoft.com Session Objectives And Takeaways 1. Lets talk about Big Data! 2. Enable you to find opportunities for Big Data
Microsoft Power Tools for Data Analysis #13 Power Pivot Into #1: Relationships Rather Than VLOOKUP Notes from Video:
 Microsoft Power Tools for Data Analysis #13 Power Pivot Into #1: Relationships Rather Than VLOOKUP Notes from Video: Table of Contents: 1. What is Power Pivot (Basic Answer)?... 2 1) Power Pivot comes
Dashboard in an Hour. by Power BI Team, Microsoft. Version: Copyright 2015 Microsoft 1 P a g e
 Dashboard in an Hour by Power BI Team, Microsoft Version: 07.15.2017 Copyright 2015 Microsoft 1 P a g e Contents Problem Statement... 3 Document Structure... 3 Prerequisites... 4 Power BI Desktop - Get
File Name: Data File Pivot Tables 3 Hrs.xlsx
 File Name: Data File Pivot Tables 3 Hrs.xlsx Lab 1: Create Simple Pivot Table to Explore the Basics 1. Select the tab labeled Raw Data Start and explore the data. 2. Position the cursor in Cell A2. 3.
New Perspectives on Microsoft Excel Module 5: Working with Excel Tables, PivotTables, and PivotCharts
 New Perspectives on Microsoft Excel 2016 Module 5: Working with Excel Tables, PivotTables, and PivotCharts Objectives, Part 1 Explore a structured range of data Freeze rows and columns Plan and create
Excel Advanced
 Excel 2016 - Advanced LINDA MUCHOW Alexandria Technical & Community College 320-762-4539 lindac@alextech.edu Table of Contents Macros... 2 Adding the Developer Tab in Excel 2016... 2 Excel Macro Recorder...
ShelbyNext Membership: Transition Prep & Implementation
 ShelbyNext Membership: Transition Prep & Implementation Pre-ISC Lecture (Course #M103) Presented by: Jeannetta Douglas Shelby Contract Trainer 2018 Shelby Systems, Inc. Other brand and product names are
MicroStrategy Desktop
 MicroStrategy Desktop Quick Start Guide MicroStrategy Desktop is designed to enable business professionals like you to explore data, simply and without needing direct support from IT. 1 Import data from
Pivot Tables and Pivot Charts Activities
 PMI Online Education Pivot Tables and Pivot Charts Activities Microcomputer Applications Updated 12.16.2011 Table of Contents Objective 1: Create and Modify PivotTable Reports... 3 Organizing Data to Display
Enterprise Vault 12.4 OData Reporting for Auditing
 Enterprise Vault 12.4 OData Reporting for Auditing This whitepaper describes the Enterprise Vault 12.4 OData reporting features for auditing. This document applies to the following version(s) of Enterprise