Shawn Dorward, MVP. Getting Started with Power Query
|
|
|
- Jemimah Henderson
- 6 years ago
- Views:
Transcription

1 Shawn Dorward, MVP Getting Started with Power Query
 and Customer Relationship Management (CRM) solutions.")


2 Meet our Presenter InterDyn Artis specializes in the implementation, service and support of Microsoft Dynamics Enterprise Resource Planning (ERP) and Customer Relationship Management (CRM) solutions. Headquartered in Charlotte, NC Founded in 1989 Microsoft MVP, Business Solutions GPUG All-Star Excel Geek ERP Evangelist 20+ Years with Dynamics GP Shawn Dorward Microsoft MVP, Business Solutions Dynamics GP Practice Lead LinkedIn: Microsoft Gold Certified Partner Personal Blog: Company Blog:


3 Our Agenda Introduction Overview Examples Put it to work!

4 Introduction What is Power Query? Who can use Power Query? How can I use Power Query?

5 What is Power Query? Power Query is a data extraction and transformation engine. Prepares Data for Data Model Retrieve/Get Combine Scrub/Clean/Transform
6 How can I use Power Query? Do you use a data source for analytics/bi? Do you combine multiple data sources Lots in, simple out Do you use macros to fix data files? Do you use VBA to fix data files? Pull from single or multiple data sources, change the data, prepare for data modeling all at once!

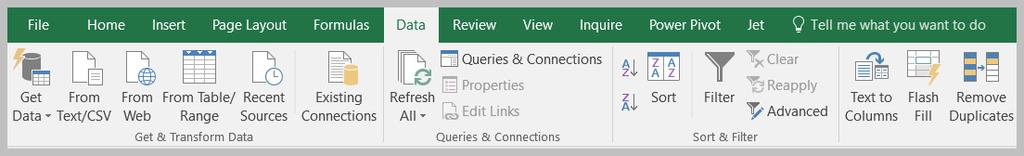
7 Overview How to get to it? What can it do to my data? Power Query =Get & Transform
8 Introduction Excel 2016 Included Natively <2016, Install Add In Power Query = Get & Transform Query Editor is part of Power Query
9 How to add it? (If you don t have it) Supported Operating System Windows 10, Windows 7, Windows 8, Windows Server 2008 R2, Windows Server 2012 Windows Server 2008 R2 Windows Server 2012 Windows 7 Windows 8 Windows The following Office versions are supported: Microsoft Office 2010 Professional Plus with Software Assurance Microsoft Office 2013: Power Query Premium: All Power Query features available for: Professional Plus, Office 365 ProPlus or Excel 2013 Standalone Power Query Public: Available for all other Office 2013 Desktop SKUs. Includes all Power Query features, except the following ones: Corporate Power BI Data Catalog, Azure-based data sources, Active Directory, HDFS, SharePoint Lists, Oracle, DB2, MySQL, PostgreSQL, Sybase, Teradata, Exchange, Dynamics CRM, SAP BusinessObjects, Salesforce.
10 Do you work with data that has been exported from a system of record? This could be a general ledger, accounting, ERP, CRM, Salesforce.com, or any reporting system that contains data. If so, you probably spend a lot of time transforming or re-shaping your data to create additional reports, pivot tables, or charts.
11 Excel AND Power BI
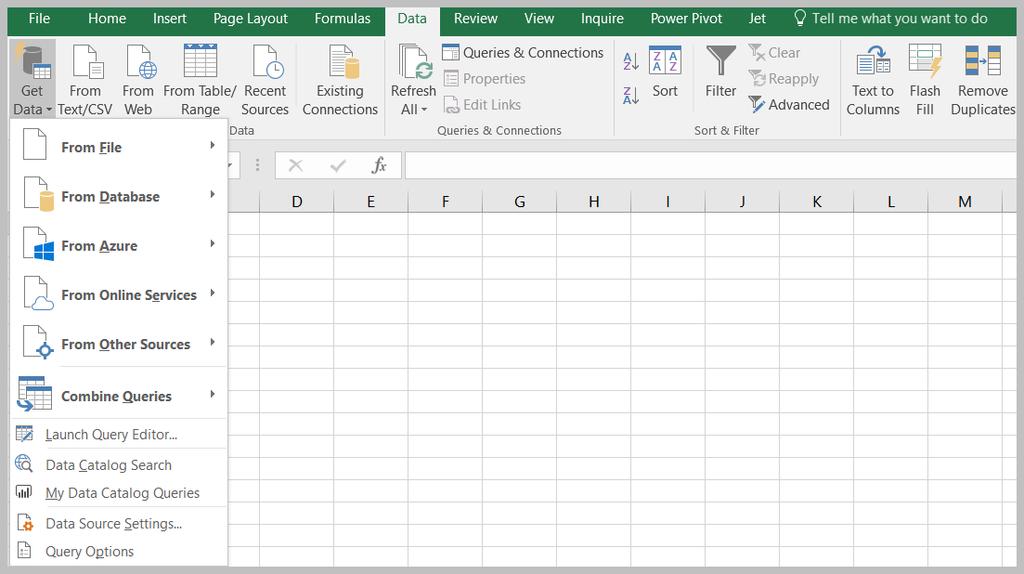
12 Connection Types
13

14 From Files

15 Databases
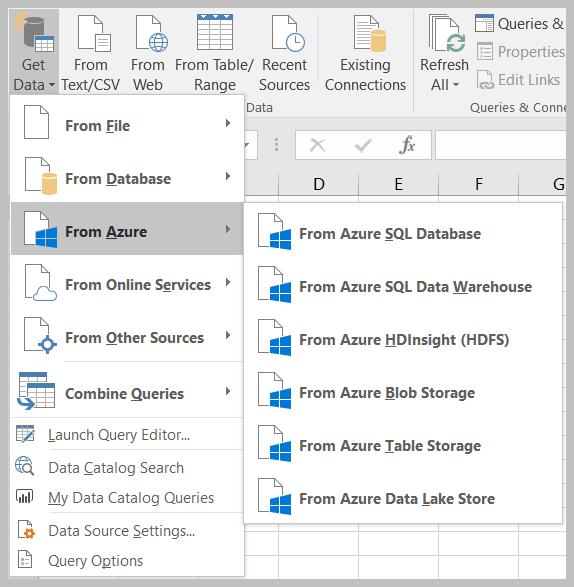
16 Azure

17 Online Services

18 Other Sources

19 Data changes = Saved Steps Replace repetitive work with saved steps Automatically use updated files and process previously saved steps

20 Examples of Data Changes Remove columns, rows, blanks Convert data types text, numbers, dates Split or merge columns Sort & filter columns Add calculated columns Aggregate or summarize data Find & replace text Unpivot data to use for pivot tables

21 Append (Combine) Tables with Power Query Append Tables/Files Stack Vertically Think One file per month?

22 Merge Data VLookup Replacement Let s say you have this data table of sales records, and you are using a VLOOKUP to bring in information about the product based on the name of the product sold. Your product group information is located in another table on a different sheet or workbook. Using VLOOKUP formulas is great, but it can often mean adding thousands of formulas to your workbook. Which increases the file size and calculation time. Power Query makes it very fast and easy to merge two tables together with just a few clicks. It basically uses SQL joins, so you can even do more advanced merges like inner, outer, left, right, full, and anti joins.

 Unpivot the selected columns to normalize the data.")
23 Unpivot Data Power Query s Unpivot Button Fortunately, Power Query has an Unpivot Button that makes it really fast and easy to unpivot in Excel. Unpivot Columns Button on the Power Query Editor Ribbon It s basically a 3-step process: Load your data into Power Query (create a query) Unpivot the selected columns to normalize the data. Output the results to a new worksheet in Excel. The Unpivot Columns button is located on the Transform tab of the Power Query Editor window.

24

25
26 Let s give it a shot! We have three files generated monthly Automatically Combine them Clean Data Up Build Reports
27 Import into Power Query (Get & Transform) Browse Locate Folder
28 Enter Query Editor
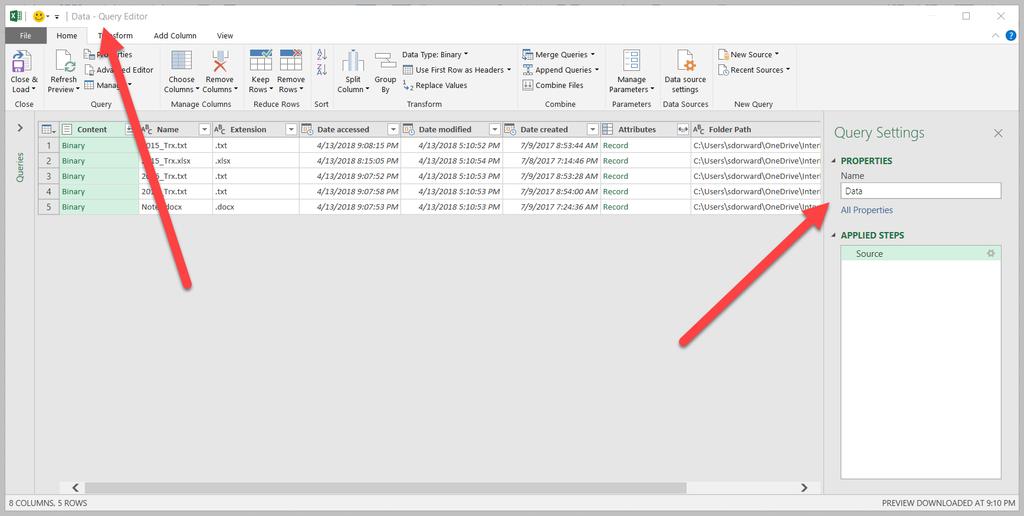
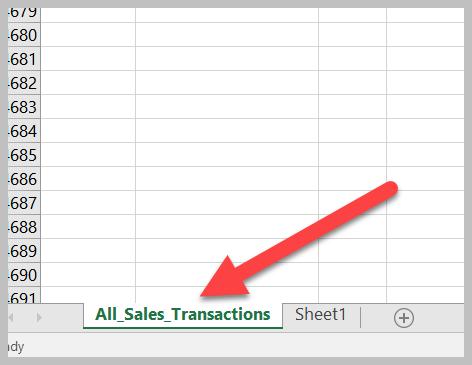
29 Rename Query All_Sales_Tables

30 Filter out files Use Extension type Case sensitive, be careful! Convert to consistent case

31 Make a Mistake? You can edit steps

32 OR Transform

33 View Formulas

34 List of Steps!

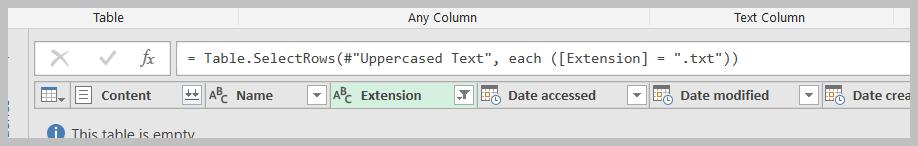
35 Just TXT Files

36 Combine Files
37 Take Note

38 For fun Look at the steps created

39 Did Source Move?


40 Time to use the data in a table

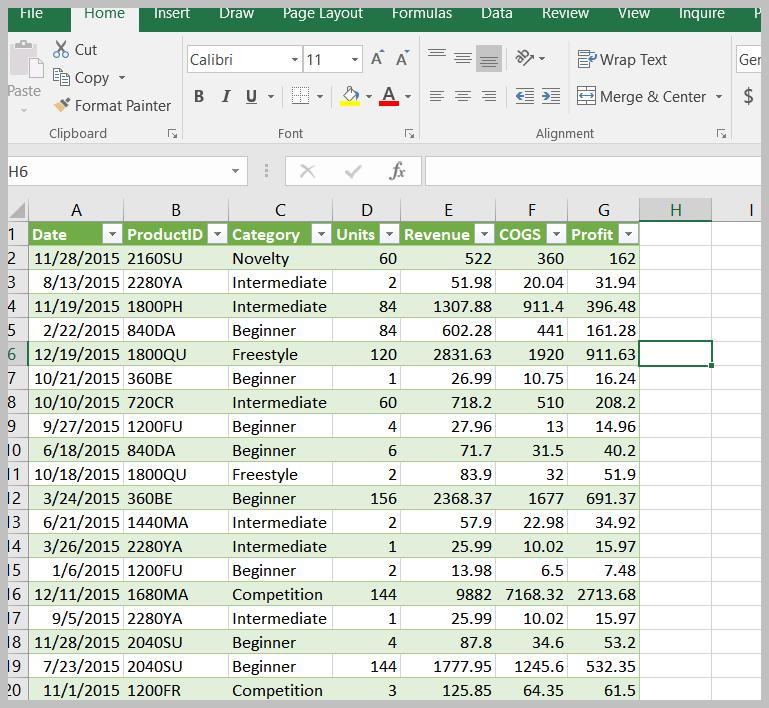
41 Tons of Data!

42 Transform Data

43 Reopen Query Editor

44 Split that data!
45 Intuitive Guess

46 BAM! Two Columns & New Step!


47 Rename & Reload
48 Let s Replace Product ID with Prod Name? Vlookup? NO WAY JOSE! Let s merge!!! Add new dataset to workbook.

49 Load data into Query Editor


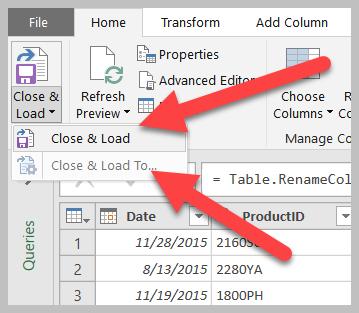
50 Close and Load to When loading data in Power Query to use in OTHER queries, only create the connection.

51 Let s Merge the two Right Click, Edit Query
52 MERGE BABY MERGE

53 Format New Data

54 Rename, Then Close and Load Remove Product ID (NO N/A)

55 Build Pivot Tables

56 Add New Data, Magic Time!!!

57 REFRESH!!!


58 Gain insight on how to get the most out of your Microsoft Dynamics software investment. Thursday, April 26, 2018 The Ritz Carlton, Charlotte Questions? 20 concurrent sessions with insight on how to become more efficient within your solution 30 sponsors with added functionality to improve current processes 200 attendees to connect, network and share best practices with Use Vision10 to save 10%
59 Meet our Presenter InterDyn Artis specializes in the implementation, service and support of Microsoft Dynamics Enterprise Resource Planning (ERP) and Customer Relationship Management (CRM) solutions. Headquartered in Charlotte, NC Founded in 1989 Microsoft MVP, Business Solutions GPUG All-Star Excel Geek ERP Evangelist 20+ Years with Dynamics GP Shawn Dorward Microsoft MVP, Business Solutions Dynamics GP Practice Lead LinkedIn: Microsoft Gold Certified Partner Personal Blog: Company Blog:
Shawn Dorward, MVP. Getting Started with Power Query
 Shawn Dorward, MVP Getting Started with Power Query Shawn Dorward Microsoft MVP, Business Solutions Dynamics GP Practice Lead Shawn.Dorward@InterdynArtis.com Headquartered in Charlotte, NC Founded in 1989
Outlook Life Hacks Shawn Dorward
 Outlook Life Hacks Shawn Dorward Shawn Dorward Microsoft MVP, Business Solutions Dynamics GP Practice Lead Shawn.Dorward@InterdynArtis.com Headquartered in Charlotte, NC Founded in 1989 Long Time Dynamics
Excel. Self Service BI: Power Query ABSTRACT: By Eric Russo
 Self Service BI: Excel Power Query ABSTRACT: By Eric Russo Microsoft Power BI is a self service solution for your data needs using Excel. It incorporates different tools for data discovery, analysis and
Power Query for Parsing Data
 Excel Power Query Power Query for Parsing Data Data Models Screen 1In Excel 2010 and 2013 need to install the Power Query; however, in 2016 is automatically part of the Data Tab ribbon and the commands
Welcome! Power BI User Group (PUG) Copenhagen
 Copenhagen") Welcome! Power BI User Group (PUG) Copenhagen Connect to Data in Power BI Desktop Just Thorning Blindbæk Consultant, Trainer and Speaker Connect to Data in Power BI Desktop Basic introduction to data connectivity
Welcome! Power BI User Group (PUG) Copenhagen Connect to Data in Power BI Desktop Just Thorning Blindbæk Consultant, Trainer and Speaker Connect to Data in Power BI Desktop Basic introduction to data connectivity
Index A, B, C. Rank() function, steps, 199 Cloud services, 2 Comma-separated value (CSV), 27
 function, steps, 199 Cloud services, 2 Comma-separated value (CSV), 27") Index A, B, C Calculations, Power Query distinct customers code implementations, 205 duplicate date and customer, 204 group by dialog configuration, 204 objective, 202 output, 205 Query Editor toolbar,
Index A, B, C Calculations, Power Query distinct customers code implementations, 205 duplicate date and customer, 204 group by dialog configuration, 204 objective, 202 output, 205 Query Editor toolbar,
Office 2016 Excel Basics 25 Video/Class Project #37 Excel Basics 25: Power Query (Get & Transform Data) to Convert Bad Data into Proper Data Set
 to Convert Bad Data into Proper Data Set") Office 2016 Excel Basics 25 Video/Class Project #37 Excel Basics 25: Power Query (Get & Transform Data) to Convert Bad Data into Proper Data Set Goal in video # 25: Learn about how to use the Get & Transform
Office 2016 Excel Basics 25 Video/Class Project #37 Excel Basics 25: Power Query (Get & Transform Data) to Convert Bad Data into Proper Data Set Goal in video # 25: Learn about how to use the Get & Transform
Microsoft Power Tools for Data Analysis #7 Power Query 6 Types of Merges/ Joins 9 Examples Notes from Video:
 Table of Contents: Microsoft Power Tools for Data Analysis #7 Power Query 6 Types of Merges/ Joins 9 Examples Notes from Video: 1. Power Query Has Six Types of Merges / Joins... 2 2. What is a Merge /
PSTL Free Tools That Can Save Your Life!
 PSTL Free Tools That Can Save Your Life! Shawn Dorward, InterDyn Artis @GPUG www.gpug.com info@gpug.com Meet our Presenter InterDyn Artis specializes in the implementation, service and support of Microsoft
Building Self-Service BI Solutions with Power Query. Written By: Devin
 Building Self-Service BI Solutions with Power Query Written By: Devin Knight DKnight@PragmaticWorks.com @Knight_Devin CONTENTS PAGE 3 PAGE 4 PAGE 5 PAGE 6 PAGE 7 PAGE 8 PAGE 9 PAGE 11 PAGE 17 PAGE 20 PAGE
Workbooks (File) and Worksheet Handling
 and Worksheet Handling") Workbooks (File) and Worksheet Handling Excel Limitation Excel shortcut use and benefits Excel setting and custom list creation Excel Template and File location system Advanced Paste Special Calculation
Workbooks (File) and Worksheet Handling Excel Limitation Excel shortcut use and benefits Excel setting and custom list creation Excel Template and File location system Advanced Paste Special Calculation
Microsoft Power BI for O365
 Microsoft Power BI for O365 Next hour.. o o o o o o o o Power BI for O365 Data Discovery Data Analysis Data Visualization & Power Maps Natural Language Search (Q&A) Power BI Site Data Management Self Service
Advance Excel Performing calculations on data 1. Naming groups of data 2. Creating formulas to calculate values
 Advance Excel 2013 Getting started with Excel 2013 1. Identifying the different Excel 2013 programs 2. Identifying new features of Excel 2013 a. If you are upgrading from Excel 2010 b. If you are upgrading
ADVANCED EXCEL Course Modules for Advance Excel Training Online (MS Excel 2013 Course):
:") Course Modules for Advance Excel Training Online (MS Excel 2013 Course): ADVANCED EXCEL 2013 1 Getting started with Excel 2013 A Identifying the different Excel 2013 programs B Identifying new features
Course Modules for Advance Excel Training Online (MS Excel 2013 Course): ADVANCED EXCEL 2013 1 Getting started with Excel 2013 A Identifying the different Excel 2013 programs B Identifying new features
Microsoft Analyzing and Visualizing Data with Microsoft Excel.
 Microsoft 70-779 Analyzing and Visualizing Data with Microsoft Excel https://killexams.com/pass4sure/exam-detail/70-779 DEMO Find some pages taken from full version Killexams 70-779 questions and answers
Excel 2007 Pivot Table Include New Items Manual Filter
 Excel 2007 Pivot Table Include New Items Manual Filter Sample Excel VBA programming to change pivot table report filters. Instead of manually changing the report filters in a pivot table, you can use Excel
TABLE OF CONTENTS PAGE
 Alchemex for SAP Business One Getting Started Guide Sept 2010 TABLE OF CONTENTS PAGE Getting Started Guide Introduction... 1 What is Alchemex for SAP Business One?... 1 System Requirements... 2 Recommended
Highline Excel 2016 Class 23: Introduction to Power BI Desktop to Create Data Model & Visualization
 Highline Excel 2016 Class 23: Introduction to Power BI Desktop to Create Data Model & Visualization Table of Contents Visualization Goal:... 1 Power BI Desktop... 2 Download Power BI Desktop for FREE Don
Excel Power User Training Courses. What if all of your people could become Excel power users!
 What if all of your people could become Excel power users! Excel Power User Training Courses The new fast track to becoming an Excel power user Microsoft Excel is an essential tool for most modern businesses,
32 Using Local Data Sources in Web Intelligence Documents
 32 Using Local Data Sources in Web Intelligence Documents We have used universes as data sources for queries created in Web Intelligence and in Web Intelligence Rich Client. 32.1 Local Data Sources in
Microsoft Power Tools for Data Analysis #10 Power BI M Code: Helper Table to Calculate MAT By Month & Product. Notes from Video:
 Microsoft Power Tools for Data Analysis #10 Power BI M Code: Helper Table to Calculate MAT By Month & Product Table of Contents: Notes from Video: 1. Intermediate Fact Table / Helper Table:... 1 2. Goal
Advanced Excel Charts : Tables : Pivots
 Advanced Excel Charts : Tables : Pivots Protecting Your Tables/Cells Protecting your cells/tables is a good idea if multiple people have access to your computer or if you want others to be able to look
Light Speed with Excel
 Work @ Light Speed with Excel 2018 Excel University, Inc. All Rights Reserved. http://beacon.by/magazine/v4/94012/pdf?type=print 1/64 Table of Contents Cover Table of Contents PivotTable from Many CSV
TABLE OF CONTENTS. Getting Started Guide
 Alchemex7 Getting Started Guide January 2011 TABLE OF CONTENTS Getting Started Guide Introduction... 3 What are the benefits of using Alchemex?... 3 System Requirements... 4 Database Connectivity Supported...
TABLE OF CONTENTS PAGE
 Alchemex 7 for Sage 50 Getting Started Guide Oct 2010 1 TABLE OF CONTENTS PAGE Getting Started Guide Introduction... 5 What is Alchemex 7 for Sage 50?... 5 System Requirements... 6 Recommended System Requirements...
How To Export Database Diagram Sql Server 2008 To Excel
 How To Export Database Diagram Sql Server 2008 To Excel Programming in Excel and MS Access VBA, Crystal Reports, C#, ASP. This article describes using the Database Model Diagram template in Visio 2010.
SAS (Statistical Analysis Software/System)
") SAS (Statistical Analysis Software/System) Clinical SAS:- Class Room: Training Fee & Duration : 23K & 3 Months Online: Training Fee & Duration : 25K & 3 Months Learning SAS: Getting Started with SAS Basic
SAS (Statistical Analysis Software/System) Clinical SAS:- Class Room: Training Fee & Duration : 23K & 3 Months Online: Training Fee & Duration : 25K & 3 Months Learning SAS: Getting Started with SAS Basic
To Receive CPE Credit
 Excel Refreshable Reports in Dynamics GP Charles Allen Senior Managing Consultant BKD Technologies callen@bkd.com June 22, 2017 To Receive CPE Credit Participate in entire webinar Answer attendance checks
2. In Video #6, we used Power Query to append multiple Text Files into a single Proper Data Set:
 Data Analysis & Business Intelligence Made Easy with Excel Power Tools Excel Data Analysis Basics = E-DAB Notes for Video: E-DAB 07: Excel Data Analysis & BI Basics: Data Modeling: Excel Formulas, Power
Sample Data. Sample Data APPENDIX A. Downloading the Sample Data. Images. Sample Databases
 APPENDIX A Sample Data Sample Data If you wish to follow the examples used in this book and I hope you will you will need some sample data to work with. All the files referenced in this book are available
Instruction How To Use Excel 2007 Pivot Table Example Data Source
 Instruction How To Use Excel 2007 Pivot Table Example Data Source Excel pivot tables allow you to group the spreadsheet or external data source by any of your data fields. The screen snap below shows a
Lumira 2.0 Discovery. What I Like Best about Lumira Discovery:
 Lumira 2.0 Discovery During some downtime recently, I decided to play around with the new Lumira 2.0. I had not used Lumira 1.0 in about eight months. I was excited to see what improvements were made to
Power BI Architecture
 What is Power BI? Power BI is a collection of software services, apps, and connectors that work together to turn unrelated sources of data into coherent, visually immersive, and interactive insights. -
QLIKVIEW ARCHITECTURAL OVERVIEW
 QLIKVIEW ARCHITECTURAL OVERVIEW A QlikView Technology White Paper Published: October, 2010 qlikview.com Table of Contents Making Sense of the QlikView Platform 3 Most BI Software Is Built on Old Technology
Reza Rad. Power Query and M Beyond Limits
 Reza Rad Power Query and M Beyond Limits Thanks to our Event Sponsors PASS Summit 2018 Registration Offer Continue the learning. Save $150 USD Register for PASS Summit and as a participant in SQLSaturday
Ms Excel Vba Continue Loop Through Range Of
 Ms Excel Vba Continue Loop Through Range Of Rows Learn how to make your VBA code dynamic by coding in a way that allows your 5 Different Ways to Find The Last Row or Last Column Using VBA In Microsoft
Creating Queries to tie Job Cost and GL by Job
 Creating Queries to tie Job Cost and GL by Job This session will cover the creation of a multi-table query to create a report that may be used to quickly review Job Cost and General Ledger posting to verify
Jet Data Manager 2014 Product Enhancements
 Jet Data Manager 2014 Product Enhancements Table of Contents Overview of New Features... 3 New Standard Features in Jet Data Manager 2014... 3 Additional Features Available for Jet Data Manager 2014...
Getting Started Guide. Sage MAS Intelligence 500
 Getting Started Guide Sage MAS Intelligence 500 Table of Contents Getting Started Guide... 1 Login Properties... 1 Standard Reports Available... 2 Financial Report... 2 Financial Trend Analysis... 3 Dashboard
Power Query For Power Bi Excel Jansbooksz
 POWER QUERY FOR POWER BI EXCEL JANSBOOKSZ PDF - Are you looking for power query for power bi excel jansbooksz Books? Now, you will be happy that at this time power query for power bi excel jansbooksz PDF
SAS (Statistical Analysis Software/System)
") SAS (Statistical Analysis Software/System) SAS Analytics:- Class Room: Training Fee & Duration : 23K & 3 Months Online: Training Fee & Duration : 25K & 3 Months Learning SAS: Getting Started with SAS Basic
SAS (Statistical Analysis Software/System) SAS Analytics:- Class Room: Training Fee & Duration : 23K & 3 Months Online: Training Fee & Duration : 25K & 3 Months Learning SAS: Getting Started with SAS Basic
Power BI 1 - Create a dashboard on powerbi.com... 1 Power BI 2 - Model Data with the Power BI Desktop... 1
 Our course outlines are 1 and 2 hour sessions (all courses 1 hour unless stated) that are designed to be delivered presentation style with an instructor guiding attendees through scenario based examples
Advanced Reporting Options Course #E211.A
 Advanced Reporting Options Course #E211.A Presented by: Arnold Wheatley Shelby Contract Trainer 2018 Shelby Systems, Inc. Other brand and product names are trademarks or registered trademarks of the respective
Azure Data Factory VS. SSIS. Reza Rad, Consultant, RADACAD
 Azure Data Factory VS. SSIS Reza Rad, Consultant, RADACAD 2 Please silence cell phones Explore Everything PASS Has to Offer FREE ONLINE WEBINAR EVENTS FREE 1-DAY LOCAL TRAINING EVENTS VOLUNTEERING OPPORTUNITIES
Sage 500 ERP Business Intelligence
 Sage 500 ERP Business Intelligence Getting Started Guide Sage 500 Intelligence (7.4) Getting Started Guide The software described in this document is protected by copyright, And may not be copied on any
Exchange (Copy, Import, Export) Data Between Excel and Access
 Data Between Excel and Access") Excel usage is widespread and Excel is often the go-to Office application for data entry, analysis, and manipulation. Microsoft Access provides relational database capability in a compact desktop environment.
Excel usage is widespread and Excel is often the go-to Office application for data entry, analysis, and manipulation. Microsoft Access provides relational database capability in a compact desktop environment.
Database Table Editor for Excel. by Brent Larsen
 Database Table Editor for Excel by Brent Larsen Executive Summary This project is a database table editor that is geared toward those who use databases heavily, and in particular those who frequently insert,
Excel. Dashboard Creation. Microsoft # KIRSCHNER ROAD KELOWNA, BC V1Y4N TOLL FREE:
 Microsoft Excel Dashboard Creation #280 1855 KIRSCHNER ROAD KELOWNA, BC V1Y4N7 250-861-8324 TOLL FREE: 1-877-954-8433 INFO@POWERCONCEPTS.CA WWW.POWERCONECPTS.CA Dashboard Creation Contents Process Overview...
What s new in Excel 2013? Provided by Work Smart
 What s new in Excel 2013? Provided by Work Smart Contents Topics in this guide include: Visualize Share Analyze Touch For more information The first thing you see when you open Excel 2013 is a brand new
Installation and Getting Started Guide Alchemex for MYOB Account Right
 Installation and Getting Started Guide Alchemex for MYOB Account Right Table of Contents Introduction... 1 What is Alchemex for MYOB Account Right?... 1 What are the benefits of using Alchemex for MYOB
COURSE CONTENT Excel with VBA Training
 COURSE CONTENT Excel with VBA Training MS Excel - Advance 1. Excel Quick Overview Use of Excel, its boundaries & features 2. Data Formatting & Custom setting Number, Text, Date, Currency, Custom settings.
Copyright 2018 by KNIME Press
 2 Copyright 2018 by KNIME Press All rights reserved. This publication is protected by copyright, and permission must be obtained from the publisher prior to any prohibited reproduction, storage in a retrieval
Excel 2007 Pivot Table Sort Column Headings
 Excel 2007 Pivot Table Sort Column Headings Pivot table is not used for sorting and filtering, it is used for summarizing and reporting. labels and col5 to values, as shown in the figure above (col1, col2
Getting Started Guide
 Getting Started Guide Sage MAS Intelligence 90/200 Table of Contents Getting Started Guide... 1 Login Properties... 1 Standard Reports Available... 2 Financial Report... 2 Financial Trend Analysis... 3
4 Introduction to Web Intelligence
 4 Introduction to Web Intelligence Web Intelligence enables you to create documents for reporting, data analysis, and sharing with other users using the BI Launch Pad environment. Querying The required
Office Applications II Lesson Objectives
 Office Applications II Lesson Unit 1: MICROSOFT EXCEL SPREADSHEETS BASICS What is a Spreadsheet and What Are Its Uses? Define spreadsheets Define the Microsoft Excel application List business, consumer,
Course Outline. Microsoft Power BI Interactive Data Visualizations Course : 2 days Instructor Led
 Microsoft Power BI Interactive Data Visualizations Course 752550: 2 days Instructor Led ABOUT THE COURSE Microsoft Power BI transforms your company data into rich visuals that facilitate new ways of thinking
TUTORIAL FOR IMPORTING OTTAWA FIRE HYDRANT PARKING VIOLATION DATA INTO MYSQL
 TUTORIAL FOR IMPORTING OTTAWA FIRE HYDRANT PARKING VIOLATION DATA INTO MYSQL We have spent the first part of the course learning Excel: importing files, cleaning, sorting, filtering, pivot tables and exporting
BASIC EXCEL SYLLABUS Section 1: Getting Started Section 2: Working with Worksheet Section 3: Administration Section 4: Data Handling & Manipulation
 BASIC EXCEL SYLLABUS Section 1: Getting Started Unit 1.1 - Excel Introduction Unit 1.2 - The Excel Interface Unit 1.3 - Basic Navigation and Entering Data Unit 1.4 - Shortcut Keys Section 2: Working with
Microsoft Office and Office 365 Training Course Outlines
 Course Outlines The courses lists are all 1 or 2 hour sessions designed to be delivered by an instructor to small groups. Each course is designed to improve efficiency and productivity by focussing on
Table of Contents. 1. Cover Page 2. Quote 3. Calculated Fields 4. Show Values As 5. Multiple Data Values 6. Enroll Today!
 Table of Contents 1. Cover Page 2. Quote 3. Calculated Fields 4. Show Values As 5. Multiple Data Values 6. Enroll Today! "It is Kind Of fun to do the IMPOSSIBLE" Walt Disney Calculated Fields The purpose
MS Office 2016 Excel Pivot Tables - notes
 Introduction Why You Should Use a Pivot Table: Organize your data by aggregating the rows into interesting and useful views. Calculate and sum data quickly. Great for finding typos. Create a Pivot Table
Sage Intelligence: Report Writing Methodology Agenda
 Sage Intelligence: Report Writing Methodology Agenda Report Structure Report Writing Methodology Report Writing Best Practices The purpose of this webinar is to provide the best possible guidelines on
The Microsoft Excel Course is divided into 4 levels
 MS Excel is a very powerful tools used by most of the data analyst in the industry. In this course you will learn how to Master Excel and make it perform any kind of data analysis and Visualization. You
Table of Contents: Microsoft Power Tools for Data Analysis #15 Comprehensive Introduction to Power Pivot & DAX. Notes from Video:
 Microsoft Power Tools for Data Analysis #15 Comprehensive Introduction to Power Pivot & DAX Table of Contents: Notes from Video: 1) Standard PivotTable or Data Model PivotTable?... 3 2) Excel Power Pivot
Market Insight Excelsior 2 Module Training Manual v2.0
 Market Insight Excelsior 2 Module Training Manual v2.0 Excelsior 2 Module Manual Version: 2.0 Software Release: Data Set: 2016 Q4 Training (US) Excel Version: Office 365 D&B Market Insight is powered by
Ivy s Business Analytics Foundation Certification Details (Module I + II+ III + IV + V)
") Ivy s Business Analytics Foundation Certification Details (Module I + II+ III + IV + V) Based on Industry Cases, Live Exercises, & Industry Executed Projects Module (I) Analytics Essentials 81 hrs 1. Statistics
Ivy s Business Analytics Foundation Certification Details (Module I + II+ III + IV + V) Based on Industry Cases, Live Exercises, & Industry Executed Projects Module (I) Analytics Essentials 81 hrs 1. Statistics
MODULE VI: MORE FUNCTIONS
 MODULE VI: MORE FUNCTIONS Copyright 2012, National Seminars Training More Functions Using the VLOOKUP and HLOOKUP Functions Lookup functions look up values in a table and return a result based on those
How Commercial Off-the-Shelf (COTS) Business Intelligence (BI) Tools Can Improve Financial Management Analysis
 Business Intelligence (BI) Tools Can Improve Financial Management Analysis") How Commercial Off-the-Shelf (COTS) Business Intelligence (BI) Tools Can Improve Financial Management Analysis Carolyn L. North, CPA, CGFM, CDFM/A, PMP R. Ross Hosse, CDFM Purpose of Business Intelligence
How Commercial Off-the-Shelf (COTS) Business Intelligence (BI) Tools Can Improve Financial Management Analysis Carolyn L. North, CPA, CGFM, CDFM/A, PMP R. Ross Hosse, CDFM Purpose of Business Intelligence
Switching to Sheets from Microsoft Excel Learning Center gsuite.google.com/learning-center
 Switching to Sheets from Microsoft Excel 2010 Learning Center gsuite.google.com/learning-center Welcome to Sheets Now that you've switched from Microsoft Excel to G Suite, learn how to use Google Sheets
Spotfire Advanced Data Services. Lunch & Learn Tuesday, 21 November 2017
 Spotfire Advanced Data Services Lunch & Learn Tuesday, 21 November 2017 CONFIDENTIALITY The following information is confidential information of TIBCO Software Inc. Use, duplication, transmission, or republication
Englische Access 2016-Trainingsskripte für IT Seminare und EDV Schulungen als Word-Dokument zum Ausdrucken und fürs Intranet
 Englische Access 2016-Trainingsskripte für IT Seminare und EDV Schulungen als Word-Dokument zum Ausdrucken und fürs Intranet 9 Data analyses To analyze data, a tabular preparation of the data or a chart
Intelligence. Peachtree Business Intelligence Report Writing Best Practices
 Intelligence Peachtree Business Intelligence Report Writing Best Practices 1. GETTING STARTED... 3 1.1. PRE-REQUISITES... 3 2. CONNECTOR TOOL... 4 2.1. CONTAINERS:... 4 2.2. JOINS:... 4 2.3. EXPRESSIONS:...
Jim Brogden, Heather Sinkwitz, Dallas Marks, Gabriel Orthous. SAP BusinessObjects Web Intelligence. The Comprehensive Guide. S Galileo Press.
 Jim Brogden, Heather Sinkwitz, Dallas Marks, Gabriel Orthous SAP BusinessObjects Web Intelligence The Comprehensive Guide S Galileo Press Bonn Acknowledgments 21 Foreword 23 1.1 Features of Web Intelligence
Basic tasks in Excel 2013
 Basic tasks in Excel 2013 Excel is an incredibly powerful tool for getting meaning out of vast amounts of data. But it also works really well for simple calculations and tracking almost any kind of information.
Advanced MS Excel for Professionals. Become an Excel Monster at your Workplace
 Advanced MS Excel for Professionals Become an Excel Monster at your Workplace Advanced MS Excel for Professionals Course Overview As a professional in your field, you already know the benefits of using
VERSION EIGHT PRODUCT PROFILE. Be a better auditor. You have the knowledge. We have the tools.
 VERSION EIGHT PRODUCT PROFILE Be a better auditor. You have the knowledge. We have the tools. Improve your audit results and extend your capabilities with IDEA's powerful functionality. With IDEA, you
Streamlined Reporting with
 Streamlined Reporting with Presentation by: Ryan Black, M.B.A. Business and Fiscal Officer Office of the Provost Wright State University, Dayton, Ohio Microsoft Excel offers one of the most powerful software
Sage 50 U.S. Edition Intelligence Reporting Getting Started Guide
 Sage Intelligence Reporting Sage 50 U.S. Edition Intelligence Reporting Getting Started Guide Table of Contents Introduction... 2 System requirements... 3 How it works... 4 Getting started guide... 5 Running
To Receive CPE Credit
 Using Microsoft Access with Dynamics GP August 28, 2014 Charles Allen Senior Managing Consultant BKD Technologies callen@bkd.com To Receive CPE Credit Participate in entire webinar Answer polls when they
Access ComprehGnsiwG. Shelley Gaskin, Carolyn McLellan, and. Nancy Graviett. with Microsoft
 with Microsoft Access 2010 ComprehGnsiwG Shelley Gaskin, Carolyn McLellan, and Nancy Graviett Prentice Hall Boston Columbus Indianapolis New York San Francisco Upper Saddle River Imsterdam Cape Town Dubai
Techno Expert Solutions An institute for specialized studies!
 MIS & Reporting "Management information system, or MIS, broadly refers to a computer-based system that provides managers with the tools to organize, evaluate and efficiently manage departments within an
Performance Tuning for the BI Professional. Jonathan Stewart
 Performance Tuning for the BI Professional Jonathan Stewart Jonathan Stewart Business Intelligence Consultant SQLLocks, LLC. @sqllocks jonathan.stewart@sqllocks.net Agenda Shared Solutions SSIS SSRS
Become strong in Excel (2.0) - 5 Tips To Rock A Spreadsheet!
 - 5 Tips To Rock A Spreadsheet!") Become strong in Excel (2.0) - 5 Tips To Rock A Spreadsheet! Hi folks! Before beginning the article, I just wanted to thank Brian Allan for starting an interesting discussion on what Strong at Excel means
Become strong in Excel (2.0) - 5 Tips To Rock A Spreadsheet! Hi folks! Before beginning the article, I just wanted to thank Brian Allan for starting an interesting discussion on what Strong at Excel means
Index. C calculated fields, vs. calculated items, 56 correcting results in, 67 creating, 61 count of unique items, 66
 Index symbols % Difference From custom calculation, 49, 65 % of Column custom calculation, 53 % Of custom calculation, 48 % of Row custom calculation, 52 % of Total custom calculation, 54 < less than symbol,
Licensing Guide for Partners
 Microsoft PowerApps & Microsoft Flow Licensing Guide for Partners November 2016 The Microsoft PowerApps & Flow Licensing Guide November 2016 Contents Introduction to Microsoft PowerApps & Microsoft Flow...
Hands-On Lab. Developing BI Applications. Lab version: Last updated: 2/23/2011
 Hands-On Lab Developing BI Applications Lab version: 1.0.0 Last updated: 2/23/2011 CONTENTS OVERVIEW... 3 EXERCISE 1: USING THE CHART WEB PART... 4 Task 1 Add the Chart Web Part to the page... 4 Task 2
Microsoft Power Tools for Data Analysis #5 Power Query: Append All Tables in Current Workbook Notes from Video:
 Microsoft Power Tools for Data Analysis #5 Power Query: Append All Tables in Current Workbook Notes from Video: Table of Contents: 1. Goal of Video... 3 2. Each Excel Table on New Sheet... 3 3. What does
Table of Contents. Table of Contents
 Powered by 1 Table of Contents Table of Contents Dashboard for Windows... 4 Dashboard Designer... 5 Creating Dashboards... 5 Printing and Exporting... 5 Dashboard Items... 5 UI Elements... 5 Providing
Mobile MOUSe EXCEL 2013 ONLINE COURSE OUTLINE
 Mobile MOUSe EXCEL 2013 ONLINE COURSE OUTLINE COURSE TITLE Excel 2013 Course DURATION 14 Hours of Interactive Training COURSE OVERVIEW If you are looking to start a career in business or finance, having
<excelunusual.com> Creating, Sizing, Translating and Rotating 2D Shapes in Excel by George Lungu. < 1
 Creating, Sizing, Translating and Rotating 2D Shapes in Excel 2007 - by George Lungu Most of the models on this blog are designed for Excel 2003 or earlier versions. Sometimes however Excel 2007 or 200
exam.23q Analyzing and Visualizing Data with Microsoft Excel
 70-779.exam.23q Number: 70-779 Passing Score: 0 Time Limit: 120 min 70-779 Analyzing and Visualizing Data with Microsoft Excel Exam A QUESTION 1 Note: This question is part of a series of questions that
B I Z I N S I G H T Release Notes. BizInsight 7.3 December 23, 2016
 B I Z I N S I G H T 7. 3 Release Notes BizInsight 7.3 December 23, 2016 Copyright Notice makes no representations or warranties with respect to the contents of this document and specifically disclaims
Toad Data Point - Professional Edition. The Toad Data Point Professional edition includes the following new features and enhancements.
 Toad Data Point 4.2 New in This Release Thursday, April 13, 2017 Contents Toad Data Point Professional Edition Toad Data Point - Base and Professional Editions Toad Data Point - Professional Edition The
Beyond the Basics with nvision and Query for PeopleSoft 9.2
 Beyond the Basics with nvision and Query for PeopleSoft 9.2 Session ID: 101180 Prepared by: Millie Babicz Managing Director SpearMC Consulting @SpearMC Welcome and Please: Silence Audible Devices Note
Excel Vba Manually Update Links On Open Workbook Don
 Excel Vba Manually Update Links On Open Workbook Don I have a workbook within which there are links to number of other workbooks. b) updating links to workbooks that are already open seems to cause errors.
Connect to CCPL
 Connect to Tech @ CCPL Charleston County Public Library October November December 2015 Technology Training Catalog TECH NEWS Want to receive this publication by email each month? Sign up for our monthly
Microsoft Dynamics GP SmartList Export Solutions by Amber J. Bell of Training Dynamo, LLC
 Title Microsoft Dynamics GP SmartList Export Solutions by Amber J. Bell of Training Dynamo, LLC Overview This is one of my favorite hidden gems in Microsoft Dynamics GP. The good news: it will work with
Quick Start Guide. Copyright 2016 Rapid Insight Inc. All Rights Reserved
 Quick Start Guide Copyright 2016 Rapid Insight Inc. All Rights Reserved 2 Rapid Insight Veera - Quick Start Guide QUICK REFERENCE Workspace Tab MAIN MENU Toolbar menu options change when the Workspace
FEATURES BENEFITS SUPPORTED PLATFORMS. Reduce costs associated with testing data projects. Expedite time to market
 E TL VALIDATOR DATA SHEET FEATURES BENEFITS SUPPORTED PLATFORMS ETL Testing Automation Data Quality Testing Flat File Testing Big Data Testing Data Integration Testing Wizard Based Test Creation No Custom