Highline Excel 2016 Class 23: Introduction to Power BI Desktop to Create Data Model & Visualization
|
|
|
- Abner Dickerson
- 6 years ago
- Views:
Transcription
1 Highline Excel 2016 Class 23: Introduction to Power BI Desktop to Create Data Model & Visualization Table of Contents Visualization Goal:... 1 Power BI Desktop... 2 Download Power BI Desktop for FREE Don t need to buy Excel Power Pivot Steps to Data Modeling with Power BI Desktop:... 2 Data Model Step 1: Import Data into Power BI Desktop... 2 Data Model Step 2: Create Relationships between Dimension & Fact Tables... 4 Data Model Step 3: Create DAX formulas: Calculated Columns & Measures... 5 Step 4: Hide Tables and Fields that are not used in Reports and Visualizations... 6 Step 6: Create Reports and Visualizations... 7 Visualization Goal: Page 1 of 9
 Not need to have Excel or Power Pivot and when you create a new file it has the extension pbix.")
2 Power BI Desktop 1) Free Data Analysis / Business Intelligence Program from Microsoft that works similarly to Excel Power Pivot 2) If you know Excel Power Pivot, the learning curve is easy. 3) Not need to have Excel or Power Pivot and when you create a new file it has the extension pbix. 4) Importing tables is just like Power Query 5) Creating Relationships is similar to Power Pivot 6) DAX Formulas are the same as Power Pivot. 7) Power BI Desktop is a great tool for visualizing data. Download Power BI Desktop for FREE Don t need to buy Excel Power Pivot. Steps to Data Modeling with Power BI Desktop: 1) Import Data into Power BI Desktop. 2) Create Relationships between Dimension & Fact Tables. 3) Create DAX formulas: Calculated Columns & Measures. 4) Hide Tables and Fields that are not used in Reports and Visualizations. 5) Create Reports and Visualizations. 6) Refresh Data Model when source data changes. 7) Edit Data Model as necessary. Data Model Step 1: Import Data into Power BI Desktop 1) Download Power BI Desktop 2) Open Power BI Desktop 3) Save As and name your file. We called our file Video22-Busn218-Start.pbix 4) In the Power BI Desktop Home Ribbon Tab, in the External Data group, click on the Get Data drop-down, then click on More. 5) Then click on Folder. Then click on Connect. Page 2 of 9

. When you are done with Query, Click the Close and Apply Button.")
3 6) After you click on Content, just as we did with Power Query, point the Get Data feature to the folder name Video23-Import5ExcelFiles. Inside there are the same five Excel files we used in the last video. 7) The Query Editor looks almost exactly the same as Power Query: 8) Complete the steps to get the 5 Excel files into a single Proper Data Set (Same steps as last video). When you are done with Query, Click the Close and Apply Button. 9) When the query loads the window looks like this: Click to see Table Click to see Relationships Table. Click expands to show fields Page 3 of 9


4 10) To import Excel tables (dproduct, dcalendar, dcountry), go to Power BI Desktop Home Ribbon Tab, in the External Data group, click on the Get Data drop-down, then click on Excel. Navigate to the file Busn218-Video23.xlsm. In the Navigator window, check the checkboxes for the three dimension tables. Then click the Load button. Check tables Click Load Data Model Step 2: Create Relationships between Dimension & Fact Tables 1) After you import Excel Tables, click on the relationship button to see that two relationships were automatically detected and created. Click the Relationship button 2) For the relationship between the two Date Columns, drag Date to Date: Page 4 of 9
 Data Model Step 3: Create DAX formulas: Calculated Columns &")
. Remember to Sort Month Field by Month Number.")
 From the Modeling Tab, click New Measure and then create Measures for Total Revenue, Total COGS and Total")
5 3) Click to see the dcalendar Table. Click to see Tables Click to see Date Table 4) Data Model Step 3: Create DAX formulas: Calculated Columns & Measures 1) From the Modeling Tab, click the New Column button and create Month Number, Month and Year Calculated Columns (same as last video). Remember to Sort Month Field by Month Number. 2) Go to the ftransaction table. Make sure it is selected. 3) From the Modeling Tab, click New Measure and then create Measures for Total Revenue, Total COGS and Total Gross Profit (same as last video). The assignment operator is an equal sign for both the Calculated Columns and Measures. 4) Total Revenue formula: Page 5 of 9
 Gross")


6 5) Total COGS formula: 6) Gross Profit formula: 7) The Table now looks like this: Step 4: Hide Tables and Fields that are not used in Reports and Visualizations Page 6 of 9
 Click on Report View.")
 In the")


7 Step 6: Create Reports and Visualizations 1) Click on Report View. Tables & Fields Visualizations Report View Button Drag Field Here 2) In the Visualization area, click Matrix: 3) Drag Fields to Row, Column and Value areas, like: 4) Matrix is really a Cross Tabulated Report (just like a PivotTable): Page 7 of 9

")

 In")
 Drag areas,")
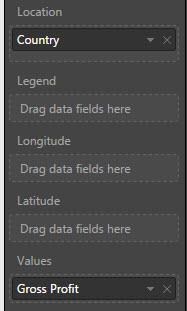
8 5) In the Visualization area, click Clustered Bar: 6) Chart: 7) Drag Fields to Row, Column and Value areas, like: 8) In the Visualization area, click Map: 9) Map: 10) Drag Fields to Row, Column and Value areas, like: Page 8 of 9
: Page 9 of")
9 11) Finished Visualization: 12) Click an element (like United States): Page 9 of 9
Highline Excel 2016 Class 22: How To Build Data Model & DAX Formulas in Power Pivot
 Highline Excel 2016 Class 22: How To Build Data Model & DAX Formulas in Power Pivot Table of Contents Which Versions of Excel Contain PowerPivot?... 2 Power Pivot is a COM add-in that you must enable...
Table of Contents: Microsoft Power Tools for Data Analysis #15 Comprehensive Introduction to Power Pivot & DAX. Notes from Video:
 Microsoft Power Tools for Data Analysis #15 Comprehensive Introduction to Power Pivot & DAX Table of Contents: Notes from Video: 1) Standard PivotTable or Data Model PivotTable?... 3 2) Excel Power Pivot
Power BI Desktop Lab
 Power BI Desktop Lab Fil Schwartz fschwartz@manersolutions.com (517) 323-7500 POWER BI DESKTOP LAB This is a hands on lab for users that have little or no experience with Power BI. We will go through a
Microsoft EXAM Analyzing and Visualizing Data with Microsoft Excel. m/ Product: Demo File
 Page No 1 https://www.dumpsplanet.com m/ Microsoft 70-779 EXAM Analyzing and Visualizing Data with Microsoft Excel Product: Demo File For More Information: https://www.dumpsplanet.com/70-779-dumps Question:
Sort, Filter, Pivot Table
 Sort, Filter, Pivot Table Sort A common database task is to rearrange the information based on a header/field or headers/fields. This is called Sorting or Filtering. Sorting rearranges all of the information
WAAT-PivotTables Accounting Seminar
 WAAT-PivotTables-08-26-2016-Accounting Seminar Table of Contents What does a PivotTable do?... 2 How to create PivotTable:... 2 Add conditions to the PivotTable:... 2 Grouping Daily Dates into Years, Quarters,
Pivot Tables in Excel Contents. Updated 5/19/2016
 Pivot Tables in Excel 2010 Updated 5/19/2016 Contents Setup a Pivot Table in Excel 2010... 2 General Field List Features... 4 Summing and Counting Together... 6 Grouping Date Data... 7 Grouping Non-Date
Advance Excel Performing calculations on data 1. Naming groups of data 2. Creating formulas to calculate values
 Advance Excel 2013 Getting started with Excel 2013 1. Identifying the different Excel 2013 programs 2. Identifying new features of Excel 2013 a. If you are upgrading from Excel 2010 b. If you are upgrading
ADVANCED EXCEL Course Modules for Advance Excel Training Online (MS Excel 2013 Course):
:") Course Modules for Advance Excel Training Online (MS Excel 2013 Course): ADVANCED EXCEL 2013 1 Getting started with Excel 2013 A Identifying the different Excel 2013 programs B Identifying new features
Course Modules for Advance Excel Training Online (MS Excel 2013 Course): ADVANCED EXCEL 2013 1 Getting started with Excel 2013 A Identifying the different Excel 2013 programs B Identifying new features
Create a Relationship to build a Pivot Table
 Create a Relationship to build a Pivot Table In Excel 2013 and 2016/365 you can now create a relationship between tables of data. This is a feature that can be used to pull data from the different tables
Create a Relationship to build a Pivot Table
 Create a Relationship to build a Pivot Table In Excel 2013 and 2016/365 you can now create a relationship between tables of data. This is a feature that can be used to pull data from the different tables
Creating Automated Dashboard Excel 2013 Contents
 Creating Automated Dashboard Excel 2013 Contents Summarize Data Using Pivot Table... 2 Constructing Report Summary... 2 Create a PivotTable from worksheet data... 2 Add fields to a PivotTable... 2 Grouping
COURSE SYLLABUS COURSE TITLE:
 1 COURSE SYLLABUS COURSE TITLE: FORMAT: CERTIFICATION EXAMS: 55164AC Quick Powerful Graphics with Power View, PowerPivot, Power Query, Power Map, and Power BI Instructor-Led None This course syllabus should
1. What is a PivotTable? What is a Cross Tab Report?
 Data Analysis & Business Intelligence Made Easy with Excel Power Tools Excel Data Analysis Basics = E-DAB Notes for Video: E-DAB-04: Summary Reports with Standard PivotTables & Slicers Objectives of Video:
Lab 01 Developing a Power Pivot Data Model in Excel 2013
 Power BI Lab 01 Developing a Power Pivot Data Model in Excel 2013 Jump to the Lab Overview Terms of Use 2014 Microsoft Corporation. All rights reserved. Information in this document, including URL and
Using the Palladium Business Intelligence Functionality
 Using the Palladium Business Intelligence Functionality This document will assist in using Palladium s Business Intelligence Module. The function of the module is to allow you a view into your data with
Working With Tables In Excel 2007
 Working With Tables In Excel 2007 Introduction With the release of Excel 2007, Microsoft has introduced a new concept of working with tables of data. This new functionality is (not surprisingly) called
Basic tasks in Excel 2013
 Basic tasks in Excel 2013 Excel is an incredibly powerful tool for getting meaning out of vast amounts of data. But it also works really well for simple calculations and tracking almost any kind of information.
Microsoft Excel 2013/2016 Pivot Tables
 Microsoft Excel 2013/2016 Pivot Tables Creating PivotTables PivotTables are powerful data analysis tools. They let you summarize data in various ways and instantly change the view you use. A PivotTable
1. What is Excel? Page 2 of 17
 Data Analysis & Business Intelligence Made Easy with Excel Power Tools Excel Data Analysis Basics = E-DAB Notes for Video: E-DAB-02: Data, Proper Data Sets, Excel Tables, Sort, Filter, Logical Tests Objectives
Table of Contents: Microsoft Power Tools for Data Analysis #11 Connecting to an SQL Server Database in Excel or Power BI Desktop.
 Microsoft Power Tools for Data Analysis #11 Connecting to an SQL Server Database in Excel or Power BI Desktop Table of Contents: Notes from Video: 1. SQL Database:... 2 4) Query Folding... 3 5) Knowing
Office 2016 Excel Basics 25 Video/Class Project #37 Excel Basics 25: Power Query (Get & Transform Data) to Convert Bad Data into Proper Data Set
 to Convert Bad Data into Proper Data Set") Office 2016 Excel Basics 25 Video/Class Project #37 Excel Basics 25: Power Query (Get & Transform Data) to Convert Bad Data into Proper Data Set Goal in video # 25: Learn about how to use the Get & Transform
Office 2016 Excel Basics 25 Video/Class Project #37 Excel Basics 25: Power Query (Get & Transform Data) to Convert Bad Data into Proper Data Set Goal in video # 25: Learn about how to use the Get & Transform
ADVANCED INQUIRIES IN ALBEDO: PART 2 EXCEL DATA PROCESSING INSTRUCTIONS
 ADVANCED INQUIRIES IN ALBEDO: PART 2 EXCEL DATA PROCESSING INSTRUCTIONS Once you have downloaded a MODIS subset, there are a few steps you must take before you begin analyzing the data. Directions for
Hands-On Lab. Developing BI Applications. Lab version: Last updated: 2/23/2011
 Hands-On Lab Developing BI Applications Lab version: 1.0.0 Last updated: 2/23/2011 CONTENTS OVERVIEW... 3 EXERCISE 1: USING THE CHART WEB PART... 4 Task 1 Add the Chart Web Part to the page... 4 Task 2
Explore commands on the ribbon Each ribbon tab has groups, and each group has a set of related commands.
 Quick Start Guide Microsoft Excel 2013 looks different from previous versions, so we created this guide to help you minimize the learning curve. Add commands to the Quick Access Toolbar Keep favorite commands
Microsoft Excel 2010 Step-by-Step Exercises PivotTables and PivotCharts: Exercise 1
 Microsoft Excel 2010 Step-by-Step Exercises PivotTables and PivotCharts: Exercise 1 In this exercise you will learn how to: Create a new PivotTable Add fields to a PivotTable Format and rename PivotTable
New Perspectives on Microsoft Excel Module 5: Working with Excel Tables, PivotTables, and PivotCharts
 New Perspectives on Microsoft Excel 2016 Module 5: Working with Excel Tables, PivotTables, and PivotCharts Objectives, Part 1 Explore a structured range of data Freeze rows and columns Plan and create
Topics Covered in Video:
 Highline College - Busn 216: Computer Applications for Business (Fun and Power with Computers) Office 2016 Video #40: Access 2016: Office 2016 Video #40: Access 2016: Building Queries in Access (15 Examples)
Microsoft Analyzing and Visualizing Data with Microsoft Excel.
 Microsoft 70-779 Analyzing and Visualizing Data with Microsoft Excel https://killexams.com/pass4sure/exam-detail/70-779 DEMO Find some pages taken from full version Killexams 70-779 questions and answers
Service Line Export and Pivot Table Report (Windows Excel 2010)
") Service Line Export and Pivot Table Report (Windows Excel 2010) In this tutorial, we will take the Service Lines of the Active Students only and only the most recent record to take a snapshot look at approximate
Service Line Export and Pivot Table Report (Windows Excel 2010) In this tutorial, we will take the Service Lines of the Active Students only and only the most recent record to take a snapshot look at approximate
Microsoft Excel Pivot Tables & Pivot Table Charts
 Microsoft Excel 2007 Pivot Tables & Pivot Table Charts A pivot table report allows you to analyze and summarize a million rows of data in Excel 2007 without entering a single formula. Pivot Tables let
Tutorial 5: Working with Excel Tables, PivotTables, and PivotCharts. Microsoft Excel 2013 Enhanced
 Tutorial 5: Working with Excel Tables, PivotTables, and PivotCharts Microsoft Excel 2013 Enhanced Objectives Explore a structured range of data Freeze rows and columns Plan and create an Excel table Rename
How to Create Excel Dashboard used in Solutions Conference By Matt Mason
 How to Create Excel Dashboard used in Solutions Conference 2017 By Matt Mason The following is a step by step procedure to create the Dashboard presented by Matt Mason in the Excel Tips and Tricks session
Microsoft Office Excel 2013
 Microsoft Office Excel 2013 PivotTables and PivotCharts University Information Technology Services Training, Outreach, Learning Technologies and Video Production Copyright 2014 KSU Department of University
Using Numbers, Formulas, and Functions
 UNIT FOUR: Using Numbers, Formulas, and Functions T o p i c s : Using the Sort function Create a one-input data table Hide columns Resize columns Calculate with formulas Explore functions I. Using the
2) Excel Basics 5: Power of PivotTables to Create Reports with Various Calculations & Layouts. Page 1 of 21
 Excel Basics 5: Power of PivotTables to Create Reports with Various Calculations & Layouts. Page 1 of 21") Office 2016 Excel Basics 20 Video/Class Project #32 Excel Basics 20: PivotTable Power: 14 Amazing PivotTable Reporting Tricks from Slicers to Show Values As! Goal in video # 20: Learn about how to create
Office 2016 Excel Basics 20 Video/Class Project #32 Excel Basics 20: PivotTable Power: 14 Amazing PivotTable Reporting Tricks from Slicers to Show Values As! Goal in video # 20: Learn about how to create
Microsoft Excel Pivot Tables & Pivot Table Charts
 Microsoft Excel 2013 Pivot Tables & Pivot Table Charts A pivot table report allows you to analyze and summarize a million rows of data in Excel 2013 without entering a single formula. Pivot Tables let
This job aid details the process for reviewing GL Balances with the Account Inspector.
 OVERVIEW This job aid details the process for reviewing GL Balances with the Account Inspector. NAVIGATING TO THE ACCOUNT INSPECTOR Use the following process to navigate to the Account Inspector (Inquire
MicroStrategy Desktop
 MicroStrategy Desktop Quick Start Guide MicroStrategy Desktop is designed to enable business professionals like you to explore data, simply and without needing direct support from IT. 1 Import data from
PivotTables & Charts for Health
 PivotTables & Charts for Health Data Inputs PivotTables Pivot Charts Global Strategic Information UCSF Global Health Sciences Version Malaria 1.0 1 Table of Contents 1.1. Introduction... 3 1.1.1. Software
Module 4: Creating Content Lesson 5: Creating Visualizations Try Now!
 Module 4: Creating Content Lesson 5: Creating Visualizations Try Now! In this Try Now! exercise, you will be creating a visualization in your Sales domain, based on the data you uploaded from your Microsoft
Objective: Class Activities
 Objective: A Pivot Table is way to present information in a report format. The idea is that you can click drop down lists and change the data that is being displayed. Students will learn how to group data
BASIC EXCEL SYLLABUS Section 1: Getting Started Section 2: Working with Worksheet Section 3: Administration Section 4: Data Handling & Manipulation
 BASIC EXCEL SYLLABUS Section 1: Getting Started Unit 1.1 - Excel Introduction Unit 1.2 - The Excel Interface Unit 1.3 - Basic Navigation and Entering Data Unit 1.4 - Shortcut Keys Section 2: Working with
Shawn Dorward, MVP. Getting Started with Power Query
 Shawn Dorward, MVP Getting Started with Power Query Meet our Presenter InterDyn Artis specializes in the implementation, service and support of Microsoft Dynamics Enterprise Resource Planning (ERP) and
MS Office 2016 Excel Pivot Tables - notes
 Introduction Why You Should Use a Pivot Table: Organize your data by aggregating the rows into interesting and useful views. Calculate and sum data quickly. Great for finding typos. Create a Pivot Table
Lesson 1: Exploring Excel Return to the Excel 2007 web page
 Lesson 1: Exploring Excel 2007 Return to the Excel 2007 web page Presenting Excel 2007 Excel can be used for a wide variety of tasks: Creating and maintaining detailed budgets Tracking extensive customer
Excel 2007/2010. Don t be afraid of PivotTables. Prepared by: Tina Purtee Information Technology (818)
") Information Technology MS Office 2007/10 Users Guide Excel 2007/2010 Don t be afraid of PivotTables Prepared by: Tina Purtee Information Technology (818) 677-2090 tpurtee@csun.edu [ DON T BE AFRAID OF
Information Technology MS Office 2007/10 Users Guide Excel 2007/2010 Don t be afraid of PivotTables Prepared by: Tina Purtee Information Technology (818) 677-2090 tpurtee@csun.edu [ DON T BE AFRAID OF
Shawn Dorward, MVP. Getting Started with Power Query
 Shawn Dorward, MVP Getting Started with Power Query Shawn Dorward Microsoft MVP, Business Solutions Dynamics GP Practice Lead Shawn.Dorward@InterdynArtis.com Headquartered in Charlotte, NC Founded in 1989
AVANTUS TRAINING PTE LTD
 [MS20779]: Analyzing Data with Excel Length : 3 Days Audience(s) : IT Professionals Level : 300 Technology : Power BI Delivery Method : Instructor-led (Classroom) Course Overview The main purpose of the
LEIAG-Excel Workshop
 Random Sample Excel has a simple formula we can utilize to obtain a random sample (cases, citations, city, etc.) At the Sheriff s Department, we are able to run a case management report that generates
55049: PowerPivot, Power View and SharePoint 2013 Business Intelligence Center for Analysts
 Let s Reach For Excellence! TAN DUC INFORMATION TECHNOLOGY SCHOOL JSC Address: 103 Pasteur, Dist.1, HCMC Tel: 08 38245819; 38239761 Email: traincert@tdt-tanduc.com Website: www.tdt-tanduc.com; www.tanducits.com
2013 ADVANCED MANUAL
 2013 ADVANCED MANUAL C B C H O U S E 2 4 C A N N I N G S T R E E T E D I N B U R G H E H 3 8 E G 0 1 3 1 2 7 2 2 7 9 0 W W W. I T R A I N S C O T L A N D. C O. U K I N F O @ I T R A I N S C O T L A N D.
Sample Data. Sample Data APPENDIX A. Downloading the Sample Data. Images. Sample Databases
 APPENDIX A Sample Data Sample Data If you wish to follow the examples used in this book and I hope you will you will need some sample data to work with. All the files referenced in this book are available
Course Outline. Microsoft Power BI Interactive Data Visualizations Course : 2 days Instructor Led
 Microsoft Power BI Interactive Data Visualizations Course 752550: 2 days Instructor Led ABOUT THE COURSE Microsoft Power BI transforms your company data into rich visuals that facilitate new ways of thinking
Getting Started with Excel Templates in CRM
 Getting Started with Excel Templates in CRM Adam Vero Freelance CRM Consultant and Trainer Adam Vero Freelance CRM Consultant and Trainer Business Solutions MVP Working with CRM ~8 years Teaching Excel
MCSA BI Reporting. A Success Guide to Prepare- Analyzing and Visualizing Data with Microsoft Excel. edusum.com
 70-779 MCSA BI Reporting A Success Guide to Prepare- Analyzing and Visualizing Data with Microsoft Excel edusum.com Table of Contents Introduction to 70-779 Exam on Analyzing and Visualizing Data with
Pivots and Queries Intro
 Workshop: Pivots and Queries Intro An overview of the Pivot, Query and Alert functions in Multiview as a refresher for the experienced or new user, we will go over how to format an inquiry screen, create
ICL02: Security Analytics: Discover More in your Endpoint Protection Dashboard Hands-On Lab
 ICL02: Security Analytics: Discover More in your Endpoint Protection Dashboard Hands-On Lab Description In this lab you will learn how to install and create custom reports and dashboards using IT Analytics
Microsoft Power Tools for Data Analysis #7 Power Query 6 Types of Merges/ Joins 9 Examples Notes from Video:
 Table of Contents: Microsoft Power Tools for Data Analysis #7 Power Query 6 Types of Merges/ Joins 9 Examples Notes from Video: 1. Power Query Has Six Types of Merges / Joins... 2 2. What is a Merge /
SBCUSD IT Training Program. MS Excel lll. VLOOKUPS, PivotTables, Macros, and More
 SBCUSD IT Training Program MS Excel lll VLOOKUPS, PivotTables, Macros, and More Revised 10/25/2018 TABLE OF CONTENTS VLOOKUP...2 VLOOLUP...2 SUMIF...3 SUMIF...3 PivotTable...4 Create PivotTable...4 Build
Tips & Tricks: MS Excel
 Tips & Tricks: MS Excel 080501.2319 Table of Contents Navigation and References... 3 Layout... 3 Working with Numbers... 5 Power Features... 7 From ACS to Excel and Back... 8 Teacher Notes: Test examples
Advanced Excel Charts : Tables : Pivots
 Advanced Excel Charts : Tables : Pivots Protecting Your Tables/Cells Protecting your cells/tables is a good idea if multiple people have access to your computer or if you want others to be able to look
Getting Started Guide. Sage MAS Intelligence 500
 Getting Started Guide Sage MAS Intelligence 500 Table of Contents Getting Started Guide... 1 Login Properties... 1 Standard Reports Available... 2 Financial Report... 2 Financial Trend Analysis... 3 Dashboard
Excel Tables & PivotTables
 Excel Tables & PivotTables A PivotTable is a tool that is used to summarize and reorganize data from an Excel spreadsheet. PivotTables are very useful where there is a lot of data that to analyze. PivotTables
Excel. Dashboard Creation. Microsoft # KIRSCHNER ROAD KELOWNA, BC V1Y4N TOLL FREE:
 Microsoft Excel Dashboard Creation #280 1855 KIRSCHNER ROAD KELOWNA, BC V1Y4N7 250-861-8324 TOLL FREE: 1-877-954-8433 INFO@POWERCONCEPTS.CA WWW.POWERCONECPTS.CA Dashboard Creation Contents Process Overview...
PIVOT TABLES IN MICROSOFT EXCEL 2016
 PIVOT TABLES IN MICROSOFT EXCEL 2016 A pivot table is a powerful tool that allows you to take a long list of data and transform it into a more compact and readable table. In the process, the tool allows
Drill Down. 1. Import the file sample-sales-data.xls into Microsoft Power BI, and then create a Quantity by Year stacked column chart.
 Drill Down 1. Import the file sample-sales-data.xls into Microsoft Power BI, and then create a Quantity by Year stacked column chart. 2. When you add a date field to a visual in the Axis field bucket,
Lesson 1: Exploring Excel Return to the FastCourse Excel 2007 Level 1 book page
 Lesson 1: Exploring Excel 2007 Return to the FastCourse Excel 2007 Level 1 book page Lesson Objectives After studying this lesson, you will be able to: Explain ways Excel can help your productivity Launch
Pivot Tables and Pivot Charts Activities
 PMI Online Education Pivot Tables and Pivot Charts Activities Microcomputer Applications Updated 12.16.2011 Table of Contents Objective 1: Create and Modify PivotTable Reports... 3 Organizing Data to Display
Customer Support Guide Creating a custom Headcount Dashboard
 Customer Support Guide Creating a custom Headcount Dashboard Contents Purpose... 2 Rationale... 2 Step by Step Instruction... 3 Related Documentation... 11 Package Version Date HCM 16.01 02/02/2017 HCM
Subscriber Folders. What Are Subscriber Folders?
 Subscriber Folders What Are Subscriber Folders? JETNET Evolution provides the ability for subscribers to create Folders containing Aircraft, History (Transactions), Companies, Contacts, Events, Operating
ABOUT PIVOTTABLES TABLE OF CONTENTS
 University of Southern California Academic Information Services Excel 2007 - PivotTables ABOUT PIVOTTABLES PivotTables provide an excellent means of analyzing data stored in database format by rearranging
About the Tutorial. Audience. Prerequisites. Disclaimer & Copyright DAX
 About the Tutorial DAX (Data Analysis Expressions) is a formula language that helps you create new information from the data that already exists in your Data Model. DAX formulas enable you to perform data
Pivot Table Project. Objectives. By the end of this lesson, you will be able to:
 Pivot Table Project Objectives By the end of this lesson, you will be able to: Set up a Worksheet Enter Labels and Values Use Sum and IF functions Format and align cells Change column width Use AutoFill
Light Speed with Excel
 Work @ Light Speed with Excel 2018 Excel University, Inc. All Rights Reserved. http://beacon.by/magazine/v4/94012/pdf?type=print 1/64 Table of Contents Cover Table of Contents PivotTable from Many CSV
A Brief Introduction to the ProClarity Enrollment Reports
 ACCESS TO THE REPORTS First Step: Open the recommended browser, Internet Explorer, go to the Compatibility View Settings on the Tools menu & select the Display all websites in Compatibility View checkbox.
User Guide. DataInsight-Web
 User Guide DataInsight-Web Table of Contents DataInsight-Web... i Table of Contents... i Overview... 2 Documentation and Support... 2 Finding Data... 3 Keyword Search... 3 Basic Search... 3 Advanced Search...
Microsoft Power Tools for Data Analysis #10 Power BI M Code: Helper Table to Calculate MAT By Month & Product. Notes from Video:
 Microsoft Power Tools for Data Analysis #10 Power BI M Code: Helper Table to Calculate MAT By Month & Product Table of Contents: Notes from Video: 1. Intermediate Fact Table / Helper Table:... 1 2. Goal
MICROSOFT Excel 2010 Advanced Self-Study
 MICROSOFT Excel 2010 Advanced Self-Study COPYRIGHT This manual is copyrighted: S&G Training Limited. This manual may not be copied, photocopied or reproduced in whole or in part without the written permission
Navigating a View. 1. The Tableau logo is a link to the Tableau Server home page.
 Navigating a View 1 2 3 4 5 1. The Tableau logo is a link to the Tableau Server home page. 2. The Workbook/View name. The star to the left of the name is a link to toggle on the Workbook/View as a favorite.
Index. #All special item, 65 #Data special item, 64 #Header special item, 65 #ThisRow special item, 65 #Totals special item, 65
 Index # #All special item, 65 #Data special item, 64 #Header special item, 65 #ThisRow special item, 65 #Totals special item, 65 A absolute and relative cell references, 118 accept/reject changes to a
Creating Simple Report from Excel
 Creating Simple Report from Excel 1.1 Connect to Excel workbook 1. Select Get Data Excel in the Home ribbon tab, 2. In the Open File dialog box, select the 2015 Sales.xlsx file. Then in the Navigator pane,
2. In Video #6, we used Power Query to append multiple Text Files into a single Proper Data Set:
 Data Analysis & Business Intelligence Made Easy with Excel Power Tools Excel Data Analysis Basics = E-DAB Notes for Video: E-DAB 07: Excel Data Analysis & BI Basics: Data Modeling: Excel Formulas, Power
Creating an Excel Pivot Table Manually
 It is easy to use Recommended PivotTables option for creating pivot tables. But you might prefer to create a pivot table manually. Prior to Excel 2013, manually creating a pivot table was your only option.
Reporting - Dashboards
 Workshop: Reporting Dashboards Driving the ViewPoint Business Intelligence Module, Dashboards transforms your Pivots and Analytics Reports for quick access on-demand graphic visualization tools. Powered
PowerPlanner manual. Contents. Powe r Planner All rights reserved
 PowerPlanner manual Copyright Powe r Planner All rights reserved Contents Installation... 3 Setup and prerequisites... 3 Licensing and activation... 3 Restoring examples manually... 4 Building PowerPivot
Data Should Not be a Four Letter Word Microsoft Excel QUICK TOUR
 Toolbar Tour AutoSum + more functions Chart Wizard Currency, Percent, Comma Style Increase-Decrease Decimal Name Box Chart Wizard QUICK TOUR Name Box AutoSum Numeric Style Chart Wizard Formula Bar Active
Sharepoint-Committee and Task Force Sites-For Saddleback College
 Site Design The Committee site has been designed with the Microsoft Office Document Workspace Template. It is the customized model for a committee or task force. Other sites available will be Team sites.
Microsoft Power Tools for Data Analysis #13 Power Pivot Into #1: Relationships Rather Than VLOOKUP Notes from Video:
 Microsoft Power Tools for Data Analysis #13 Power Pivot Into #1: Relationships Rather Than VLOOKUP Notes from Video: Table of Contents: 1. What is Power Pivot (Basic Answer)?... 2 1) Power Pivot comes
Table of Contents Data Validation... 2 Data Validation Dialog Box... 3 INDIRECT function... 3 Cumulative List of Keyboards Throughout Class:...
 Highline Excel 2016 Class 10: Data Validation Table of Contents Data Validation... 2 Data Validation Dialog Box... 3 INDIRECT function... 3 Cumulative List of Keyboards Throughout Class:... 4 Page 1 of
Pivot Tables, Lookup Tables and Scenarios
 Introduction Format and manipulate data using pivot tables. Using a grading sheet as and example you will be shown how to set up and use lookup tables and scenarios. Contents Introduction Contents Pivot
PivotTables. Mastering Microsoft Excel
 Mastering Microsoft Excel PivotTables SkillPath a division of the Graceland College Center for Professional Development and Lifelong Learning, Inc. All rights reserved, including the right to reproduce
Advanced Excel Reporting
 SedonaOffice Users Conference San Francisco, CA January 21 24, 2018 Advanced Excel Reporting Presented by: Matt Howe This Page Intentionally Left Blank Page 2 of 20 Table of Contents Overview... 4 Making
Day 1 Agenda. Brio 101 Training. Course Presentation and Reference Material
 Data Warehouse www.rpi.edu/datawarehouse Brio 101 Training Course Presentation and Reference Material Day 1 Agenda Training Overview Data Warehouse and Business Intelligence Basics The Brio Environment
Creating a Pivot Table
 Contents Introduction... 1 Creating a Pivot Table... 1 A One-Dimensional Table... 2 A Two-Dimensional Table... 4 A Three-Dimensional Table... 5 Hiding and Showing Summary Values... 5 Adding New Data and
Rev. C 11/09/2010 Downers Grove Public Library Page 1 of 41
 Table of Contents Objectives... 3 Introduction... 3 Excel Ribbon Components... 3 Office Button... 4 Quick Access Toolbar... 5 Excel Worksheet Components... 8 Navigating Through a Worksheet... 8 Making
Microsoft Access 2010
 Microsoft Access 2010 Chapter 2 Querying a Database Objectives Create queries using Design view Include fields in the design grid Use text and numeric data in criteria Save a query and use the saved query
Advanced Reporting Options Course #E211.A
 Advanced Reporting Options Course #E211.A Presented by: Arnold Wheatley Shelby Contract Trainer 2018 Shelby Systems, Inc. Other brand and product names are trademarks or registered trademarks of the respective
COMM 391 Winter 2014 Term 1. Tutorial 1: Microsoft Excel - Creating Pivot Table
 COMM 391 Winter 2014 Term 1 Tutorial 1: Microsoft Excel - Creating Pivot Table The purpose of this tutorial is to enable you to create Pivot Table to analyze worksheet data in Microsoft Excel. You should
User Manual instantolap
 User Manual instantolap Version 2.7.0 15.12.2010 Page 2 / 213 instantolap User Manual 2.7.0 instantolap User Manual 2.7.0 Page 3 / 213 Copyright Copyright (C) 2002-2010 Thomas Behrends Softwareentwicklung