Interactive Visualization of the Stock Market Graph
|
|
|
- April Jefferson
- 5 years ago
- Views:
Transcription
1 Interactive Visualization of the Stock Market Graph Presented by Camilo Rostoker Department of Computer Science University of British Columbia
2 Overview 1. Introduction 2. The Market Graph 3. Motivation 4. Visualization Goals 5. Solutions & Methods 6. Future Work 7. Conclusion 8. Demo
3 Stock Market Data Huge amounts of accessible data on a daily basis Consists of a variety of fields such as price, volume, change Stock price interactions form a complex system Want to understand these interactions of the subsystems
4 Constructing the Market Graph 1. From a dataset, compute the correlation matrix 2. Convert correlation matrix to a graph, where Vertices represent stocks Edges represents a relationships between two stocks correlation(stock1,stock2) > THRESHOLD
5 What Are We Visualizing? Find clusters/groups of stocks that exhibit certain trading patterns Maximum Cliques Highly positively/negatively correlated subsets of stocks Independent Sets Completely diversified stocks Quasi-Cliques/Independent Sets Generalizations allow for near matches Clusters? Cliques/IS interchangeably
6 Existing Approaches to Visualizing Graph Structures 1. Determine target structures (i.e. clusters) a priori and use a standard layout algorithm to show the results 2. Use a layout algorithm optimized to visually differentiate target structures 3. Our approach: combine the two Find target structures first, but include additional nodes and edges for context Then use force-directed layout algorithm to effectively visualize the results

7 Example: Vizster
8 Motivation: Usage Scenarios Portfolio management (static) Real-time market analysis (dynamic) Exploratory analysis of trading data to gain new insights, spot patterns/trends, etc (static)
9 Motivation: Visualizing Results from a Real-time Data-mining Pipeline FILE WEB DB Data Collector Data Filter Compute Distance Matrix Graph Clustering Graph Update Server Viz Client Viz Client
10 Visualization Goals 1. Visualize different graph structures representing various patterns and trends (quasi-)cliques and (quasi-)independent sets positively and negatively correlations 2. Represent inter-cluster relationships 3. Dynamic graph capabilities 4. Interaction for efficient data exploration 5. Information integration
11 Force-Directed Graph Layout Model Create summaries of the graph using the clusters and their induced subgraphs Force model: spring-embedded layout Spring lengths and tensions parameterized to optimize layout Highly related clusters should be close Independent clusters and minimally related clusters should be further apart
12 F.D. Model Parameterizations Edge Length Cluster-Cluster edges (CC) # intra-cluster edges (shows connectedness of clusters) Cluster-Member edges (CM) Quasi-cliques # intra-cluster edges ( clique contribution ) Cliques: cluster sizes (more space to larger clusters) Tension CM edges use constant tight tension CC edge tension proportional to # of inter-cluster links
 Independent sets Transparency-encoding for cluster summary Individual members edge length encodes clique")
13 Differentiating cluster types Correlation Metrics: positive, negative, independent Color encoded Cluster types: (quasi-) Cliques and (quasi-) Independent sets Transparency-encoding for cluster summary Individual members edge length encodes clique contribution
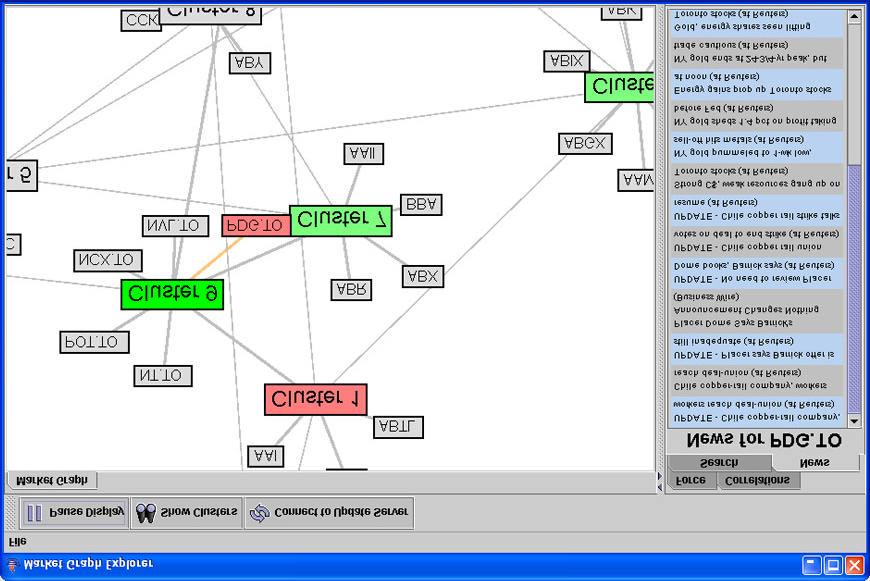
14 Interaction & Information Integration Interaction Features Geometric pan/zoom Display/hide cluster outlines Symbol search for quick navigation Overview display for global context Node context menus provide stock quotes and news: Stock news from various sources integrated via RSS feeds Online quote details and Google search for provided by opening an external web browser
15 Dynamic graph capabilities Receive remote graph updates via socket connection to a graph update server Nodes/edges can be added, removed or replaced Event-based architecture allows for automatic processing of new updates Force-model allows for efficient incremental layouts when new nodes/edges placed intelligently
16 Future Work & Improvements Handle overlapping clusters Encode other variables i.e. node size could encode trade volume Ability to view underlying edge weights Ability to optionally view complete underlying graph especially the intra-cluster edges
17 Future Work & Improvements (2) Interactively adding/removing nodes and edges Semantic zoom Focus+Context Other clustering methods besides partitioning via (quasi-)cliques and independent sets
18 Conclusion Implemented basic Visualization tool for exploring the market graph Visualizes different cluster types and their attributes User interaction for pan/zoom, on-demand details (quotes, news, web search) Dynamic graph capability to support a real-time data processing pipeline
19 References 1. Jeffrey Heer and Danah Boyd. Vizster: Visualizing online social networks. InfoVis 2005 IEEE Symposium on Information Visualization, Jeffrey Heer, Stuart K. Card, and James A. Landay. prefuse: a toolkit for interactive information visualization. In CHI 05: Proceedings of the SIGCHI conference on Human factors in computing systems, pages , New York, NY, USA, ACM Press. 3. Frank van Ham and Jarke J. van Wijk. Interactive visualization of small world graphs. In Proceedings of the IEEE Symposium on Information Visualization, pages , Washington, DC, USA, IEEE Computer Society. 4. Vladimir Boginski, Sergiy Butenko, and Panos M. Pardalos. Mining market data: A network approach.
20 DEMO
21 THE END!
22
23 Construct a Similarity Matrix Currently, our similarity measure is where:
Data Mining and. in Dynamic Networks
 Data Mining and Knowledge Discovery in Dynamic Networks Panos M. Pardalos Center for Applied Optimization Dept. of Industrial & Systems Engineering Affiliated Faculty of: Computer & Information Science
DualNet: A Coordinated View Approach to Network Visualization
 DualNet: A Coordinated View Approach to Network Visualization Galileo Namata, Brian Staats, Ben Shneiderman Department of Computer Science, University of Maryland College Park, Maryland 20770, U.S staatsb@mail.umd.edu,
Geometric Techniques. Part 1. Example: Scatter Plot. Basic Idea: Scatterplots. Basic Idea. House data: Price and Number of bedrooms
 Part 1 Geometric Techniques Scatterplots, Parallel Coordinates,... Geometric Techniques Basic Idea Visualization of Geometric Transformations and Projections of the Data Scatterplots [Cleveland 1993] Parallel
Large Scale Information Visualization. Jing Yang Fall Tree and Graph Visualization (2)
") Large Scale Information Visualization Jing Yang Fall 2008 1 Tree and Graph Visualization (2) 2 1 Network Visualization by Semantic Substrates Ben Shneiderman and Aleks Aris Infovis 06 3 NetLens: Iterative
Large Scale Information Visualization Jing Yang Fall 2008 1 Tree and Graph Visualization (2) 2 1 Network Visualization by Semantic Substrates Ben Shneiderman and Aleks Aris Infovis 06 3 NetLens: Iterative
Visualization Systems & Toolkits
 Visualization Systems & Toolkits 8803DV CS/MGT April 10, 2017 Systems/tools that help people create visualizations or use visualizations to help people explore and analyze data. Toolkits are components/libraries/packages
A Source Code History Navigator
 A Source Code History Navigator Alexander Bradley (awjb@cs.ubc.ca) CPSC 533C Project Proposal University of British Columbia October 30, 2009 1 Problem Description This project will address a problem drawn
Scalable Pixel-based Visual Interfaces: Challenges and Solutions
 Scalable Pixel-based Visual Interfaces: Challenges and Solutions Mike Sips, Jörn Schneidewind, Daniel A. Keim 1, Heidrun Schumann 2 1 {sips,schneide,keim}@dbvis.inf.uni-konstanz.de, University of Konstanz
Large Scale Information Visualization. Jing Yang Fall Graph Visualization
 Large Scale Information Visualization Jing Yang Fall 2007 1 Graph Visualization 2 1 When? Ask the question: Is there an inherent relation among the data elements to be visualized? If yes -> data: nodes
Courtesy of Prof. Shixia University
 Courtesy of Prof. Shixia Liu @Tsinghua University Outline Introduction Classification of Techniques Table Scatter Plot Matrices Projections Parallel Coordinates Summary Motivation Real world data contain
Visualization and text mining of patent and non-patent data
 of patent and non-patent data Anton Heijs Information Solutions Delft, The Netherlands http://www.treparel.com/ ICIC conference, Nice, France, 2008 Outline Introduction Applications on patent and non-patent
Computing Largest Correcting Codes and Their Estimates Using Optimization on Specially Constructed Graphs p.1/30
 Computing Largest Correcting Codes and Their Estimates Using Optimization on Specially Constructed Graphs Sergiy Butenko Department of Industrial Engineering Texas A&M University College Station, TX 77843
Potential issues: * Difficulty in coding and/or finding the. * Should I provide more source code? * Others
 Assignment III Potential issues: * Division of the work within the team? * Difficulty in coding and/or finding the network data? * Should I provide more source code? * Others 1 InfoVis Software Toolkit
Information Visualization. Jing Yang Spring Graph Visualization
 Information Visualization Jing Yang Spring 2007 1 Graph Visualization 2 1 When? Ask the question: Is there an inherent relation among the data elements to be visualized? If yes -> data: nodes relations:
Week 4: Facet. Tamara Munzner Department of Computer Science University of British Columbia
 Week 4: Facet Tamara Munzner Department of Computer Science University of British Columbia JRNL 520M, Special Topics in Contemporary Journalism: Visualization for Journalists Week 4: 6 October 2015 http://www.cs.ubc.ca/~tmm/courses/journ15
Multidimensional Interactive Visualization
 Multidimensional Interactive Visualization Cecilia R. Aragon I247 UC Berkeley Spring 2010 Acknowledgments Thanks to Marti Hearst, Tamara Munzner for the slides Spring 2010 I 247 2 Today Finish panning
A Search Set Model of Path Tracing in Graphs: Supplementary Materials
 A Search Set Model of Path Tracing in Graphs: Supplementary Materials Jessica Q. Dawson, Tamara Munzner and Joanna McGrenere This supplementary material contains two sections. In the first section, we
Visualizing LiveJournal Social Networks Through. Clustering
 Visualizing LiveJournal Social Networks Through Clustering Final Project Report for CS 294-5 (Statistical Natural Language Processing) and IS 247 (Information Visualization and Presentation) Kirsten Chevalier
Narrowing It Down: Information Retrieval, Supporting Effective Visual Browsing, Semantic Networks
 Clarence Chan: clarence@cs.ubc.ca #63765051 CPSC 533 Proposal Memoplex++: An augmentation for Memoplex Browser Introduction Perusal of text documents and articles is a central process of research in many
GLO-STIX! Graph-Level Operations for Specifying Techniques and Interactive exploration
 GLO-STIX! Graph-Level Operations for Specifying Techniques and Interactive exploration Chad Stolper Minsuk Kahng Zhiyuan Jerry Lin Florian Foerster Aakash Goel John Stasko Polo Chau http://thetrendguys.com/wp-content/uploads/2014/02/lego-bricks.jpg
A Constrained Spreading Activation Approach to Collaborative Filtering
 A Constrained Spreading Activation Approach to Collaborative Filtering Josephine Griffith 1, Colm O Riordan 1, and Humphrey Sorensen 2 1 Dept. of Information Technology, National University of Ireland,
Finding Anomalies in Time-Series using Visual Correlation for Interactive Root Cause Analysis
 Finding Anomalies in Time-Series using Visual Correlation for Interactive Root Cause Analysis Florian Stoffel University of Konstanz Florian.Stoffel@unikonstanz.de Fabian Fischer University of Konstanz
Trees & Graphs. Nathalie Henry Riche, Microsoft Research
 Trees & Graphs Nathalie Henry Riche, Microsoft Research About Nathalie Henry Riche nath@microsoft.com Researcher @ Microsoft Research since 2009 Today: - Overview of techniques to visualize trees & graphs
Data Visualization Principles: Interaction, Filtering, Aggregation CSC444
 Data Visualization Principles: Interaction, Filtering, Aggregation CSC444 Announcements Assignment 5 is due tonight Assignment 6 is posted Read this one early Let s go over a solution for Assignment 4
Overview. Social Networks Vis. Measures in SNA. What are social networks?
 Overview Social Networks Vis Supriya Garg Presentation for CSE591 3 rd May, 2007 What are social networks? Key concepts in social networks Growth of social networks visualization Techniques used in social
Learning video saliency from human gaze using candidate selection
 Learning video saliency from human gaze using candidate selection Rudoy, Goldman, Shechtman, Zelnik-Manor CVPR 2013 Paper presentation by Ashish Bora Outline What is saliency? Image vs video Candidates
Information Visualization & Visual Analytics
 Information Visualization & Visual Analytics Jack van Wijk Dept. Math. & Computer Science TU Eindhoven BPM round table, March 28, 2011 Overview InfoVis Visual Analytics Why is my hard disk full?? SequoiaView
Overlapping Clustered Graphs: Co-authorship Networks Visualization
 Overlapping Clustered Graphs: Co-authorship Networks Visualization Rodrigo Santamaría and Roberto Therón University of Salamanca Abstract. The analysis of scientific articles produced by different groups
Differential Privacy. Seminar: Robust Data Mining Techniques. Thomas Edlich. July 16, 2017
 Differential Privacy Seminar: Robust Techniques Thomas Edlich Technische Universität München Department of Informatics kdd.in.tum.de July 16, 2017 Outline 1. Introduction 2. Definition and Features of
Operation Manual for Real Time Quotes Service
 Operation Manual for Real Time Quotes Service www.eafutures.com.hk Enquiry and Account Opening Hotline: (852) 3608-8181 E-mail Enquiry: accounts@eafutures.com.hk Table of Contents 1. Introduction... 2
Progressive Parallel Coordinates
 Progressive Parallel Coordinates Institute for Data Analysis and Visualization (IDAV), Department of Computer Science, University of California, Davis, CA 95616-8562, U.S.A. René Rosenbaum Visual Computing
Tuple Information Visualization Publications Browser
 Tuple Information Visualization Publications Browser Alex Gukov* University of British Columbia ABSTRACT As publication networks grow it becomes difficult to grasp their key influences and directions by
Learning a Distance Metric for Structured Network Prediction. Stuart Andrews and Tony Jebara Columbia University
 Learning a Distance Metric for Structured Network Prediction Stuart Andrews and Tony Jebara Columbia University Outline Introduction Context, motivation & problem definition Contributions Structured network
Statistical analysis of nancial networks
 Computational Statistics & Data Analysis 48 (25) 431 443 www.elsevier.com/locate/csda Statistical analysis of nancial networks VladimirBoginski a, Sergiy Butenko b, Panos M. Pardalos a; a Department of
Modeling Dynamic Behavior in Large Evolving Graphs
 Modeling Dynamic Behavior in Large Evolving Graphs R. Rossi, J. Neville, B. Gallagher, and K. Henderson Presented by: Doaa Altarawy 1 Outline - Motivation - Proposed Model - Definitions - Modeling dynamic
A Web Application to Visualize Trends in Diabetes across the United States
 A Web Application to Visualize Trends in Diabetes across the United States Final Project Report Team: New Bee Team Members: Samyuktha Sridharan, Xuanyi Qi, Hanshu Lin Introduction This project develops
A Dual-View Approach to Interactive Network Visualization
 A Dual-View Approach to Interactive Network Visualization Galileo Mark Namata Dept. of Computer Science Univ. of Maryland College Park, MD 20742 namatag@cs.umd.edu Lise Getoor Dept. of Computer Science
Lecture 13: Graphs and Trees
 Lecture 13: Graphs and Trees Information Visualization CPSC 533C, Fall 2006 Tamara Munzner UBC Computer Science 24 October 2006 Readings Covered Graph Visualisation in Information Visualisation: a Survey.
Visual Analysis of Classification Scheme
 Visual Analysis of Classification Scheme Veslava Osińska Institute of Information Science and Book Studies Nicolaus Copernicus University Toruń, Poland 1/26 Information Visualization (INFOVIS) Visualization
CIS 467/602-01: Data Visualization
 CIS 467/602-01: Data Visualization Interaction Dr. David Koop Interaction Recap The view changes over time Changes can affect almost any aspect of the visualization - encoding - arrangement - ordering
Graphs and Networks 2
 Topic Notes Graphs and Networks 2 CS 7450 - Information Visualization October 23, 2013 John Stasko Review Last time we looked at graph layout aesthetics and algorithms, as well as some example applications
Glyphs. Presentation Overview. What is a Glyph!? Cont. What is a Glyph!? Glyph Fundamentals. Goal of Paper. Presented by Bertrand Low
 Presentation Overview Glyphs Presented by Bertrand Low A Taxonomy of Glyph Placement Strategies for Multidimensional Data Visualization Matthew O. Ward, Information Visualization Journal, Palmgrave,, Volume
A Constrained Spreading Activation Approach to Collaborative Filtering
 A Constrained Spreading Activation Approach to Collaborative Filtering Josephine Griffith 1, Colm O Riordan 1, and Humphrey Sorensen 2 1 Dept. of Information Technology, National University of Ireland,
New Bee. Samyuktha Sridharan Xuanyi Qi Hanshu Lin
 New Bee Samyuktha Sridharan Xuanyi Qi Hanshu Lin Introduction Purpose of the application Information visualization Trend in diabetes Predictive analysis Correlate trends in diabetes Project Accomplishments
Multi-Dimensional Vis
 CSE512 :: 21 Jan 2014 Multi-Dimensional Vis Jeffrey Heer University of Washington 1 Last Time: Exploratory Data Analysis 2 Exposure, the effective laying open of the data to display the unanticipated,
OpenMP for next generation heterogeneous clusters
 OpenMP for next generation heterogeneous clusters Jens Breitbart Research Group Programming Languages / Methodologies, Universität Kassel, jbreitbart@uni-kassel.de Abstract The last years have seen great
Theme Identification in RDF Graphs
 Theme Identification in RDF Graphs Hanane Ouksili PRiSM, Univ. Versailles St Quentin, UMR CNRS 8144, Versailles France hanane.ouksili@prism.uvsq.fr Abstract. An increasing number of RDF datasets is published
OBJECT-CENTERED INTERACTIVE MULTI-DIMENSIONAL SCALING: ASK THE EXPERT
 OBJECT-CENTERED INTERACTIVE MULTI-DIMENSIONAL SCALING: ASK THE EXPERT Joost Broekens Tim Cocx Walter A. Kosters Leiden Institute of Advanced Computer Science Leiden University, The Netherlands Email: {broekens,
Overview of Clustering
 based on Loïc Cerfs slides (UFMG) April 2017 UCBL LIRIS DM2L Example of applicative problem Student profiles Given the marks received by students for different courses, how to group the students so that
Frequent Pattern Mining in Data Streams. Raymond Martin
 Frequent Pattern Mining in Data Streams Raymond Martin Agenda -Breakdown & Review -Importance & Examples -Current Challenges -Modern Algorithms -Stream-Mining Algorithm -How KPS Works -Combing KPS and
OVERVIEW AND DETAIL FOCUS+CONTEXT. Information Visualization Fall 2009 Jinwook Seo SNU CSE
 OVERVIEW AND DETAIL FOCUS+CONTEXT Information Visualization Fall 2009 Jinwook Seo SNU CSE Readings A review of overview+detail, zooming, and focus+context interfaces. Andy Cockburn, Amy Karlson, and Benjamin
Event Detection through Differential Pattern Mining in Internet of Things
 Event Detection through Differential Pattern Mining in Internet of Things Authors: Md Zakirul Alam Bhuiyan and Jie Wu IEEE MASS 2016 The 13th IEEE International Conference on Mobile Ad hoc and Sensor Systems
Fennel: Streaming Graph Partitioning for Massive Scale Graphs
 Fennel: Streaming Graph Partitioning for Massive Scale Graphs Charalampos E. Tsourakakis 1 Christos Gkantsidis 2 Bozidar Radunovic 2 Milan Vojnovic 2 1 Aalto University, Finland 2 Microsoft Research, Cambridge
Data Clustering Hierarchical Clustering, Density based clustering Grid based clustering
 Data Clustering Hierarchical Clustering, Density based clustering Grid based clustering Team 2 Prof. Anita Wasilewska CSE 634 Data Mining All Sources Used for the Presentation Olson CF. Parallel algorithms
Social-Network Graphs
 Social-Network Graphs Mining Social Networks Facebook, Google+, Twitter Email Networks, Collaboration Networks Identify communities Similar to clustering Communities usually overlap Identify similarities
Lecture 13: Graphs/Trees
 Lecture 13: Graphs/Trees Information Visualization CPSC 533C, Fall 2009 Tamara Munzner UBC Computer Science Mon, 31 October 2011 1 / 41 Readings Covered Graph Visualisation in Information Visualisation:
2015 Entrinsik, Inc.
 2015 Entrinsik, Inc. Table of Contents Chapter 1: Creating a Dashboard... 3 Creating a New Dashboard... 4 Choosing a Data Provider... 5 Scheduling Background Refresh... 10 Chapter 2: Adding Graphs and
Review: Identification of cell types from single-cell transcriptom. method
 Review: Identification of cell types from single-cell transcriptomes using a novel clustering method University of North Carolina at Charlotte October 12, 2015 Brief overview Identify clusters by merging
A Parallel Workflow for Online Correlation and Clique-finding
 A Parallel Workflow for Online Correlation and Clique-finding With Applications to Finance by Camilo Rostoker B.Sc., University of Regina, 2004 A THESIS SUBMITTED IN PARTIAL FULFILMENT OF THE REQUIREMENTS
Comp/Phys/Mtsc 715. Preview Videos 4/5/2012. Information Display and Spatial Embeddings. Information Visualization and Tufte. Vis 2004: robbins.
 Comp/Phys/Mtsc 715 Information Visualization and Tufte 1 Preview Videos Vis 2004: robbins.mpg Comparing two 2D time-varying neural responses Vis 2004: theisel.avi Flow topology for time-varying 2D flow
Data Visualization. Fall 2016
 Data Visualization Fall 2016 Information Visualization Upon now, we dealt with scientific visualization (scivis) Scivisincludes visualization of physical simulations, engineering, medical imaging, Earth
An Intelligent Clustering Algorithm for High Dimensional and Highly Overlapped Photo-Thermal Infrared Imaging Data
 An Intelligent Clustering Algorithm for High Dimensional and Highly Overlapped Photo-Thermal Infrared Imaging Data Nian Zhang and Lara Thompson Department of Electrical and Computer Engineering, University
Matrix Representation of Graphs
 Matrix Representation of Graphs Eva Rott Michael Glatzhofer Dominik Mocher Julian Wolf Institute of Interactive Systems and Data Science (ISDS), Graz University of Technology A-8010 Graz, Austria 18 May
Topological map merging
 Topological map merging Kris Beevers Algorithmic Robotics Laboratory Department of Computer Science Rensselaer Polytechnic Institute beevek@cs.rpi.edu March 9, 2005 Multiple robots create topological maps
An Empirical Analysis of Communities in Real-World Networks
 An Empirical Analysis of Communities in Real-World Networks Chuan Sheng Foo Computer Science Department Stanford University csfoo@cs.stanford.edu ABSTRACT Little work has been done on the characterization
Construction Change Order analysis CPSC 533C Analysis Project
 Construction Change Order analysis CPSC 533C Analysis Project Presented by Chiu, Chao-Ying Department of Civil Engineering University of British Columbia Problems of Using Construction Data Hybrid of physical
Visualization Tools. Interaction. How do people create visualizations? Jeffrey Heer Stanford University
 CS448B :: 23 Oct 2012 Interaction Visualization Tools Jeffrey Heer Stanford University How do people create visualizations? Today's first task is not to invent wholly new [graphical] techniques, though
Detecting Controversial Articles in Wikipedia
 Detecting Controversial Articles in Wikipedia Joy Lind Department of Mathematics University of Sioux Falls Sioux Falls, SD 57105 Darren A. Narayan School of Mathematical Sciences Rochester Institute of
i Maximum Number of Windows Open: 4 (incl. HK-Share & A-Share)
") 2.12 Watch List 2.12.1 Watch List (HK) In the Watch List (HK Stock), you may create multiple portfolios to monitor a number of stocks, warrants, indexes, or futures in one window at the same time. Each
2.12 Watch List 2.12.1 Watch List (HK) In the Watch List (HK Stock), you may create multiple portfolios to monitor a number of stocks, warrants, indexes, or futures in one window at the same time. Each
Independent Study Report IS2970, Fall How Your Users Help You: A Survey of Feedback Mechanism in Social Network Sites.
 Independent Study Report IS2970, Fall 2011 How Your Users Help You: A Survey of Feedback Mechanism in Social Network Sites Jing Li Abstract Online Feedback Mechanism becomes more important along with the
MODEL VERSIONING IN CONTEXT OF LIVING MODELS
 MODEL VERSIONING IN CONTEXT OF LIVING MODELS Waqar Mehmood and Arshad Ali Department of Computer Science, COMSATS Institute of Information Technology, Wah Campus. ABSTRACT In this paper we present an approach
Exploratory Analysis: Clustering
 Exploratory Analysis: Clustering (some material taken or adapted from slides by Hinrich Schutze) Heejun Kim June 26, 2018 Clustering objective Grouping documents or instances into subsets or clusters Documents
PSON: A Parallelized SON Algorithm with MapReduce for Mining Frequent Sets
 2011 Fourth International Symposium on Parallel Architectures, Algorithms and Programming PSON: A Parallelized SON Algorithm with MapReduce for Mining Frequent Sets Tao Xiao Chunfeng Yuan Yihua Huang Department
Multidimensional Visualization and Clustering
 Multidimensional Visualization and Clustering Presentation for Visual Analytics of Professor Klaus Mueller Xiaotian (Tim) Yin 04-26 26-20072007 Paper List HD-Eye: Visual Mining of High-Dimensional Data
Week 6: Networks, Stories, Vis in the Newsroom
 Week 6: Networks, Stories, Vis in the Newsroom Tamara Munzner Department of Computer Science University of British Columbia JRNL 520H, Special Topics in Contemporary Journalism: Data Visualization Week
Visual Analysis of Set Relations in a Graph
 Visual Analysis of Set Relations in a Graph Panpan Xu 1, Fan Du 2, Nan Cao 3, Conglei Shi 1, Hong Zhou 4, Huamin Qu 1 1 Hong Kong University of Science and Technology, 2 Zhejiang University, 3 IBM T. J.
InfoVis Systems & Toolkits
 Topic Notes InfoVis Systems & Toolkits CS 7450 - Information Visualization February 15, 2011 John Stasko Background In previous classes, we have examined different techniques for presenting multivariate
Web Structure Mining Community Detection and Evaluation
 Web Structure Mining Community Detection and Evaluation 1 Community Community. It is formed by individuals such that those within a group interact with each other more frequently than with those outside
Clustering in Networks
 Clustering in Networks (Spectral Clustering with the Graph Laplacian... a brief introduction) Tom Carter Computer Science CSU Stanislaus http://csustan.csustan.edu/ tom/clustering April 1, 2012 1 Our general
RINGS : A Technique for Visualizing Large Hierarchies
 RINGS : A Technique for Visualizing Large Hierarchies Soon Tee Teoh and Kwan-Liu Ma Computer Science Department, University of California, Davis {teoh, ma}@cs.ucdavis.edu Abstract. We present RINGS, a
Network visualization techniques and evaluation
 Network visualization techniques and evaluation The Charlotte Visualization Center University of North Carolina, Charlotte March 15th 2007 Outline 1 Definition and motivation of Infovis 2 3 4 Outline 1
Document Visualization Overview and Detail by Selectively Varying Density
 Document Visualization Overview and Detail by Selectively Varying Density Richard H. Fowler Department of Computer Science, University of Texas Pan American, Edinburg, TX, USA Abstract - The challenges
Unsupervised Data Mining: Clustering. Izabela Moise, Evangelos Pournaras, Dirk Helbing
 Unsupervised Data Mining: Clustering Izabela Moise, Evangelos Pournaras, Dirk Helbing Izabela Moise, Evangelos Pournaras, Dirk Helbing 1 1. Supervised Data Mining Classification Regression Outlier detection
CS Information Visualization Sep. 2, 2015 John Stasko
 Multivariate Visual Representations 2 CS 7450 - Information Visualization Sep. 2, 2015 John Stasko Recap We examined a number of techniques for projecting >2 variables (modest number of dimensions) down
INFO 424, UW ischool 11/1/2007
 Today s Lecture Trees and Networks Thursday 1 Nov 2007 Polle Zellweger Goals of tree & network visualization View structure & connectivity, node properties Challenges of trees & networks size, structure,
A Top-Down Visual Approach to GUI development
 A Top-Down Visual Approach to GUI development ROSANNA CASSINO, GENNY TORTORA, MAURIZIO TUCCI, GIULIANA VITIELLO Dipartimento di Matematica e Informatica Università di Salerno Via Ponte don Melillo 84084
Visualization of EU Funding Programmes
 Visualization of EU Funding Programmes 186.834 Praktikum aus Visual Computing WS 2016/17 Daniel Steinböck January 28, 2017 Abstract To fund research and technological development, not only in Europe but
Fast Efficient Clustering Algorithm for Balanced Data
 Vol. 5, No. 6, 214 Fast Efficient Clustering Algorithm for Balanced Data Adel A. Sewisy Faculty of Computer and Information, Assiut University M. H. Marghny Faculty of Computer and Information, Assiut
Incremental Real-time Bundle Adjustment for Multi-camera Systems with Points at Infinity
 Incremental Real-time Bundle Adjustment for Multi-camera Systems with Points at Infinity Johannes Schneider, Thomas Läbe, Wolfgang Förstner 1 Department of Photogrammetry Institute of Geodesy and Geoinformation
Understanding Clustering Supervising the unsupervised
 Understanding Clustering Supervising the unsupervised Janu Verma IBM T.J. Watson Research Center, New York http://jverma.github.io/ jverma@us.ibm.com @januverma Clustering Grouping together similar data
This tutorial has been prepared for computer science graduates to help them understand the basic-to-advanced concepts related to data mining.
 About the Tutorial Data Mining is defined as the procedure of extracting information from huge sets of data. In other words, we can say that data mining is mining knowledge from data. The tutorial starts
Further Thoughts on Precision
 Further Thoughts on Precision David Gray, David Bowes, Neil Davey, Yi Sun and Bruce Christianson Abstract Background: There has been much discussion amongst automated software defect prediction researchers
Clustering. Chapter 10 in Introduction to statistical learning
 Clustering Chapter 10 in Introduction to statistical learning 16 14 12 10 8 6 4 2 0 2 4 6 8 10 12 14 1 Clustering ² Clustering is the art of finding groups in data (Kaufman and Rousseeuw, 1990). ² What
Effects of Semantic Cache on Mobile Database System
 Effects of Semantic Cache on Mobile Database System S.QADRI, A.R SATTAR & T. MUSTAFA Department of Computer Sciences University of Agriculture Faisalabad PAKISTAN salmanbzu@gmail.com, ahsan@uaf.edu.pk,
Recommendation System for Location-based Social Network CS224W Project Report
 Recommendation System for Location-based Social Network CS224W Project Report Group 42, Yiying Cheng, Yangru Fang, Yongqing Yuan 1 Introduction With the rapid development of mobile devices and wireless
Predictive Analysis: Evaluation and Experimentation. Heejun Kim
 Predictive Analysis: Evaluation and Experimentation Heejun Kim June 19, 2018 Evaluation and Experimentation Evaluation Metrics Cross-Validation Significance Tests Evaluation Predictive analysis: training
Network Based Models For Analysis of SNPs Yalta Opt
 Outline Network Based Models For Analysis of Yalta Optimization Conference 2010 Network Science Zeynep Ertem*, Sergiy Butenko*, Clare Gill** *Department of Industrial and Systems Engineering, **Department
Graph/Network Visualization
 Graph/Network Visualization Data model: graph structures (relations, knowledge) and networks. Applications: Telecommunication systems, Internet and WWW, Retailers distribution networks knowledge representation
Panning and Zooming. CS 4460/ Information Visualization April 8, 2010 John Stasko
 Panning and Zooming CS 4460/7450 - Information Visualization April 8, 2010 John Stasko Fundamental Problem Scale - Many data sets are too large to visualize on one screen May simply be too many cases May
Interaction. What is Interaction? From Google: Reciprocal action between a human and a computer One of the two main components in infovis
 Interaction 1 What is Interaction? From Google: Reciprocal action between a human and a computer One of the two main components in infovis Representation Interaction Interaction is what distinguishes infovis
A P2P-based Incremental Web Ranking Algorithm
 A P2P-based Incremental Web Ranking Algorithm Sumalee Sangamuang Pruet Boonma Juggapong Natwichai Computer Engineering Department Faculty of Engineering, Chiang Mai University, Thailand sangamuang.s@gmail.com,