Basic Medical Statistics Course
|
|
|
- George Shepherd
- 5 years ago
- Views:
Transcription
1 Basic Medical Statistics Course S0 SPSS Intro December 2014 Wilma Heemsbergen
2 This Afternoon ~ SPSS lecture Short break Exercise 2

3 Database Example 3
4 Types of data Type Continous Categorical - binary - ordinal - nominal Text Date Example Age Treatment Arm T stage Hospital Remarks Date of Birth 4
5 SPSS 5
6 SPSS 6

7 SPSS - SPSS can import/export other formats (e.g. excel). - You can open multiple databases simultaneously. - You can copy output to other programs. 7

8 SPSS windows Data View 8
9 SPSS View Variable View 9

10 SPSS View Variable View 10

11 Windows in SPSS Open windows are shown in the tab Windows 11
, go to (menu): File new Script window.. 12")
12 Windows in SPSS To open new windows (data, syntax, output), go to (menu): File new Script window.. 12

13 Output Window 13

14 Syntax Window The syntax window is a script / commands window. 14
15 Menu: File 15
. *.dbf, *.")
16 Import Data in SPSS Using the paste button, corresponding syntax is pasted (ready to run). *.dbf, *.xls, *txt,/ 16
. To run: (select and) hit the run button. GET FILE='U:\data_statcursus\trial_rt.sav'. DATASET NAME DataSet1 WINDOW=FRONT.")
17 Get Data Menu: file open - data Use the paste button to get the syntax in the syntax window It is also possible to start with opening a syntax file, which will read / open the data (without using the menu). To run: (select and) hit the run button. GET FILE='U:\data_statcursus\trial_rt.sav'. DATASET NAME DataSet1 WINDOW=FRONT. 17

18 Data File Information 18

19 Data File Information 19


20 Save Subset There is a possibility to save a subset of the variables: save as, option variables Menu: File save as 20

21 Menu: Data 21

22 Menu: Data Sort Cases Sort Cases 22

23 Split File / Selection Cases Menu: Data - Split File Data - Select Cases 23


24 Split File / Selection Cases 24

25 Merge Data Menu: Data Merge Files Add Cases / Add Variables 25

26 Merge Data Menu: Data Merge Files Add Cases / Add Variables 26

27 Menu: Transform 27

28 Compute Menu: transform - compute DATASET ACTIVATE DataSet1. COMPUTE duur_rt=tend - tstart. EXECUTE. 28

 (70 thru 90=1)")
29 Recode Menu: transform - recode RECODE age (45 thru 69.99=0) (70 thru 90=1) INTO age70. EXECUTE. 29

30 Menu: Analyze 30
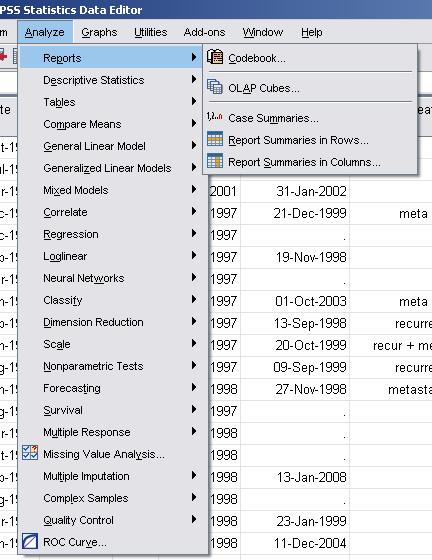
31 Case Summaries Menu: analyze reports case summaries overview, error checking, summary 31
32 Describing continuous data - Mean and standard deviation - Median - Range, min, max percentiles, - Stem-and-leaf - Box plot
33 Reports, Describing 33

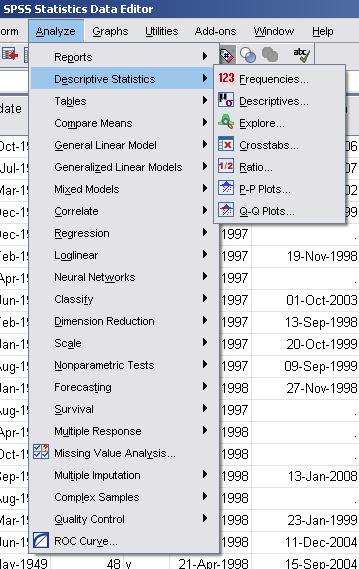
34 Descriptives Menu: analyze - descriptive statistics - descriptives DESCRIPTIVES VARIABLES=age /STATISTICS=MEAN STDDEV MIN MAX. 34
35 Explore Menu: Analyze - Descriptive statistics - Explore 35 39

36 Explore: factor (by group) Menu: analyze - descriptive statistics - explore EXAMINE VARIABLES=age BY arm /PLOT BOXPLOT STEMLEAF /COMPARE GROUPS /STATISTICS DESCRIPTIVES /CINTERVAL 95 /MISSING LISTWISE /NOTOTAL. (= default, you can change it) 36 40
37 37 41
38 Stem-and-Leaf A Stem-and-Leaf diagram is a special type of histogram. First: stem and leaf must be defined. Example Data: 23, 26, 26, 27, 28, 30, 31, 45, 45, 45 Typically, a Stem-and-Leaf plot looks then like this (with stem unit of 10 and leaf unit of 1) (stem = 2, leafs are ) SPSS: a Stem-and-Leaf plot is generated when the option explore is used (descriptive statistics)
39 Box Plot Visualizes: - distribution (normal? skew?) - full range of variation - outliers SPSS: a Box plot is generated when the option explore is used (descriptive statistics)
.")
40 Describing categorical/ordinal data Data can be described in absolute values (numbers) and/or in relative values (%). - Frequency tables - Crosstabs (at least 2 variables) - 40
41 Frequency Tables Menu: analyze - descriptive statistics - frequencies 41

42 Crosstabs Menu: analyze - descriptive statistics - crosstabs 42

43 Crosstabs 43
44 SPSS Help There are helpful SPSS manuals / guides available at the internet (english) (english) (dutch) SPSS has an extensive Help Function. Demo on youtube about types of data : 44
45 Addendum data / databases 45
46 Types of data: special cases Identifiers. A unique code / number to identify an individual patient. Key variable (for merging data, patient file research, etc ). Censored data. Most common is right-censored: event will occur, but we do not know when, e.g. death. Interval-censored: the event occurred in a certain time interval, but we do not know exactly when. Derived data. E.g.: age at start of treatment, derived from birth date and treatment date. Imputed data. A way of handling missing data. E.g. estimation of start treatment, based on blood values. Missing data. Missing data are often coded as missing. Beware of these values when you start analyzing data (e.g. 99 = missing). 46
47 Date and Time Variables To calculate the time between two dates, you can subtract dates from each other. E.g.: (date start therapy) (birth date) = (age at start therapy). Beware of the unit of the calculated age. In SPSS, it will be calculated in seconds (using the option compute ). Age at start (in days) = ( (date start) (birth date) ) / ( 60*60*24) Age at start (in years) = ( (date start) (birth date) ) / ( 60*60*24*365.25) SPSS also contains a date and time wizard, in which you can indicate the desired unit for calculations. 47
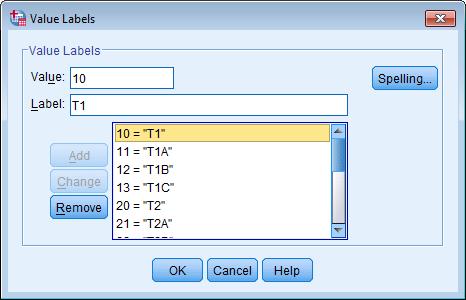
48 Code / Labels Two or more categories (not ordinal) Two: male, female 1, 2 or 0,1 More: Hospital A, B, C, D Whatever is convenient e.g. 1,2,3,4 or 11,17,22,33 Categories, ordinal Age: <40,40-60,>60 1, 2, 3 Risk factor: present, not present Prior surgery: yes, no 1, 0 48
49 Building a Database - Keep a short paper file per patient (study forms). - Enter original data preferably in a database environment (not Excel). - Construct a code book (next slide). - Keep your original data well-organized. - Save + backup original data, apart from derived data. - Include in your data file name: date, version, ref to study. - Use a text field to comment (and update) for every patient (e.g.: emigrated, lost to follow-up, no visit at 2 years follow-up ) - Check and double-check the data. 49
50 Code Book Define each variable (previous to data entry) in a code book: name of variables, type (e.g. numerical, text, date), length, decimals, labels / extended variable name (e.g. date of diagnosis in referring hospital ), values (e.g. 1=male, 2=female), missing values: list of defined missing values (e.g. 99=unknown). The code book can also be used to construct an electronic data form for data entry (to minimize errors). Variable names should be reasonably short + well-organized, also to avoid problems when exported to other programs. 50

51 Electronic Data Form Example of simple data entry form in ACCESS 51
52 Error Checking Range/outliers: are outliers true values, or errors? Missings: are missing values really missing? Dates: are dates within the expected range? Queries (logical rules): E.g. stop date must be between x and y weeks after start date. 52
Basic Medical Statistics Course
 Basic Medical Statistics Course S0 SPSS Intro November 2013 Wilma Heemsbergen w.heemsbergen@nki.nl 1 13.00 ~ 15.30 Database (20 min) SPSS (40 min) Short break Exercise (60 min) This Afternoon During the
IBMSPSSSTATL1P: IBM SPSS Statistics Level 1
 SPSS IBMSPSSSTATL1P IBMSPSSSTATL1P: IBM SPSS Statistics Level 1 Version: 4.4 QUESTION NO: 1 Which statement concerning IBM SPSS Statistics application windows is correct? A. At least one Data Editor window
Brief Guide on Using SPSS 10.0
 Brief Guide on Using SPSS 10.0 (Use student data, 22 cases, studentp.dat in Dr. Chang s Data Directory Page) (Page address: http://www.cis.ysu.edu/~chang/stat/) I. Processing File and Data To open a new
IENG484 Quality Engineering Lab 1 RESEARCH ASSISTANT SHADI BOLOUKIFAR
 IENG484 Quality Engineering Lab 1 RESEARCH ASSISTANT SHADI BOLOUKIFAR SPSS (Statistical package for social science) Originally is acronym of Statistical Package for the Social Science but, now it stands
Crash Course in Statistics
 Neuroscience Center Zurich Crash Course in Statistics Introduction to SPSS July 2014 Dr. Jürg Schwarz juerg.schwarz@schwarzpartners.ch Slide 2 Program 8 July 2014: Morning Lessons (09.00 12.00) First Part
Intermediate SPSS. If you have an SPSS dataset (*.sav), you can open it in the following way:
, you can open it in the following way:") Center for Teaching, Research & Learning Research Support Group at the Social Science Research lab American University, Washington, D.C. http://www.american.edu/provost/ctrl/ 202-885-3862 Intermediate
Center for Teaching, Research & Learning Research Support Group at the Social Science Research lab American University, Washington, D.C. http://www.american.edu/provost/ctrl/ 202-885-3862 Intermediate
PSS718 - Data Mining
 Lecture 5 - Hacettepe University October 23, 2016 Data Issues Improving the performance of a model To improve the performance of a model, we mostly improve the data Source additional data Clean up the
Chapter 3: Data Description - Part 3. Homework: Exercises 1-21 odd, odd, odd, 107, 109, 118, 119, 120, odd
 Chapter 3: Data Description - Part 3 Read: Sections 1 through 5 pp 92-149 Work the following text examples: Section 3.2, 3-1 through 3-17 Section 3.3, 3-22 through 3.28, 3-42 through 3.82 Section 3.4,
Dr Wan Nor Arifin Unit of Biostatistics and Research Methodology, Universiti Sains Malaysia.
 Introduction to SPSS Dr Wan Nor Arifin Unit of Biostatistics and Research Methodology, Universiti Sains Malaysia. wnarifin@usm.my Outlines Introduction Data Editor Data View Variable View Menus Shortcut
Math 120 Introduction to Statistics Mr. Toner s Lecture Notes 3.1 Measures of Central Tendency
 Math 1 Introduction to Statistics Mr. Toner s Lecture Notes 3.1 Measures of Central Tendency lowest value + highest value midrange The word average: is very ambiguous and can actually refer to the mean,
Surviving SPSS.
 Surviving SPSS http://dataservices.gmu.edu/workshops/spss http://dataservices.gmu.edu/software/spss Debby Kermer George Mason University Libraries Data Services Research Consultant Mason Data Services
INTRODUCTION TO SPSS. Anne Schad Bergsaker 13. September 2018
 INTRODUCTION TO SPSS Anne Schad Bergsaker 13. September 2018 BEFORE WE BEGIN... LEARNING GOALS 1. Be familiar with and know how to navigate between the different windows in SPSS 2. Know how to write a
1. Basic Steps for Data Analysis Data Editor. 2.4.To create a new SPSS file
 1 SPSS Guide 2009 Content 1. Basic Steps for Data Analysis. 3 2. Data Editor. 2.4.To create a new SPSS file 3 4 3. Data Analysis/ Frequencies. 5 4. Recoding the variable into classes.. 5 5. Data Analysis/
LSP 121. LSP 121 Math and Tech Literacy II. Topics. Quartiles. Intro to Statistics. More Descriptive Statistics
 Greg Brewster, DePaul University Page 1 LSP 121 Math and Tech Literacy II More Descriptive Statistics Greg Brewster DePaul University Topics More Descriptive Statistics Quartiles Percentiles Categorical
SPSS TRAINING SPSS VIEWS
 SPSS TRAINING SPSS VIEWS Dataset Data file Data View o Full data set, structured same as excel (variable = column name, row = record) Variable View o Provides details for each variable (column in Data
STA 570 Spring Lecture 5 Tuesday, Feb 1
 STA 570 Spring 2011 Lecture 5 Tuesday, Feb 1 Descriptive Statistics Summarizing Univariate Data o Standard Deviation, Empirical Rule, IQR o Boxplots Summarizing Bivariate Data o Contingency Tables o Row
Research Methods for Business and Management. Session 8a- Analyzing Quantitative Data- using SPSS 16 Andre Samuel
 Research Methods for Business and Management Session 8a- Analyzing Quantitative Data- using SPSS 16 Andre Samuel A Simple Example- Gym Purpose of Questionnaire- to determine the participants involvement
MHPE 494: Data Analysis. Welcome! The Analytic Process
 MHPE 494: Data Analysis Alan Schwartz, PhD Department of Medical Education Memoona Hasnain,, MD, PhD, MHPE Department of Family Medicine College of Medicine University of Illinois at Chicago Welcome! Your
Introduction (SPSS) Opening SPSS Start All Programs SPSS Inc SPSS 21. SPSS Menus
 Opening SPSS Start All Programs SPSS Inc SPSS 21. SPSS Menus") Introduction (SPSS) SPSS is the acronym of Statistical Package for the Social Sciences. SPSS is one of the most popular statistical packages which can perform highly complex data manipulation and analysis
Introduction (SPSS) SPSS is the acronym of Statistical Package for the Social Sciences. SPSS is one of the most popular statistical packages which can perform highly complex data manipulation and analysis
FREQUENCIES VARIABLES=CAT_MSDS /STATISTICS=STDDEV MINIMUM MAXIMUM MEAN MEDIAN MODE /ORDER=ANALYSIS.
 1. Uji Univariat FREQUENCIES VARIABLES=CAT_MSDS /STATISTICS=STDDEV MINIMUM MAXIMUM MEAN MEDIAN MODE /ORDER=ANALYSIS. Frequencies Notes Output Created 31-MAY-2017 20:53:29 Comments Input Data Active Dataset
SPSS QM II. SPSS Manual Quantitative methods II (7.5hp) SHORT INSTRUCTIONS BE CAREFUL
 SHORT INSTRUCTIONS BE CAREFUL") SPSS QM II SHORT INSTRUCTIONS This presentation contains only relatively short instructions on how to perform some statistical analyses in SPSS. Details around a certain function/analysis method not covered
SPSS QM II SHORT INSTRUCTIONS This presentation contains only relatively short instructions on how to perform some statistical analyses in SPSS. Details around a certain function/analysis method not covered
CHAPTER 1. Introduction. Statistics: Statistics is the science of collecting, organizing, analyzing, presenting and interpreting data.
 1 CHAPTER 1 Introduction Statistics: Statistics is the science of collecting, organizing, analyzing, presenting and interpreting data. Variable: Any characteristic of a person or thing that can be expressed
Example how not to do it: JMP in a nutshell 1 HR, 17 Apr Subject Gender Condition Turn Reactiontime. A1 male filler
 JMP in a nutshell 1 HR, 17 Apr 2018 The software JMP Pro 14 is installed on the Macs of the Phonetics Institute. Private versions can be bought from
TYPES OF VARIABLES, STRUCTURE OF DATASETS, AND BASIC STATA LAYOUT
 PRIMER FOR ACS OUTCOMES RESEARCH COURSE: TYPES OF VARIABLES, STRUCTURE OF DATASETS, AND BASIC STATA LAYOUT STEP 1: Install STATA statistical software. STEP 2: Read through this primer and complete the
User Services Spring 2008 OBJECTIVES Introduction Getting Help Instructors
 User Services Spring 2008 OBJECTIVES Use the Data Editor of SPSS 15.0 to to import data. Recode existing variables and compute new variables Use SPSS utilities and options Conduct basic statistical tests.
Select Cases. Select Cases GRAPHS. The Select Cases command excludes from further. selection criteria. Select Use filter variables
 Select Cases GRAPHS The Select Cases command excludes from further analysis all those cases that do not meet specified selection criteria. Select Cases For a subset of the datafile, use Select Cases. In
WELCOME! Lecture 3 Thommy Perlinger
 Quantitative Methods II WELCOME! Lecture 3 Thommy Perlinger Program Lecture 3 Cleaning and transforming data Graphical examination of the data Missing Values Graphical examination of the data It is important
Chapter 6: DESCRIPTIVE STATISTICS
 Chapter 6: DESCRIPTIVE STATISTICS Random Sampling Numerical Summaries Stem-n-Leaf plots Histograms, and Box plots Time Sequence Plots Normal Probability Plots Sections 6-1 to 6-5, and 6-7 Random Sampling
3 Graphical Displays of Data
 3 Graphical Displays of Data Reading: SW Chapter 2, Sections 1-6 Summarizing and Displaying Qualitative Data The data below are from a study of thyroid cancer, using NMTR data. The investigators looked
Digital literacy training
 Digital literacy training SPSS Introduction 2018 ANU Library anulib.anu.edu.au/training digital.literacy@anu.edu.au Table of Contents To start SPSS... 1 Import Excel files... 1 The Data View window...
SPSS. (Statistical Packages for the Social Sciences)
") Inger Persson SPSS (Statistical Packages for the Social Sciences) SHORT INSTRUCTIONS This presentation contains only relatively short instructions on how to perform basic statistical calculations in SPSS.
Inger Persson SPSS (Statistical Packages for the Social Sciences) SHORT INSTRUCTIONS This presentation contains only relatively short instructions on how to perform basic statistical calculations in SPSS.
Ivy s Business Analytics Foundation Certification Details (Module I + II+ III + IV + V)
") Ivy s Business Analytics Foundation Certification Details (Module I + II+ III + IV + V) Based on Industry Cases, Live Exercises, & Industry Executed Projects Module (I) Analytics Essentials 81 hrs 1. Statistics
Ivy s Business Analytics Foundation Certification Details (Module I + II+ III + IV + V) Based on Industry Cases, Live Exercises, & Industry Executed Projects Module (I) Analytics Essentials 81 hrs 1. Statistics
Opening a Data File in SPSS. Defining Variables in SPSS
 Opening a Data File in SPSS To open an existing SPSS file: 1. Click File Open Data. Go to the appropriate directory and find the name of the appropriate file. SPSS defaults to opening SPSS data files with
3 Graphical Displays of Data
 3 Graphical Displays of Data Reading: SW Chapter 2, Sections 1-6 Summarizing and Displaying Qualitative Data The data below are from a study of thyroid cancer, using NMTR data. The investigators looked
Chapter 3 - Displaying and Summarizing Quantitative Data
 Chapter 3 - Displaying and Summarizing Quantitative Data 3.1 Graphs for Quantitative Data (LABEL GRAPHS) August 25, 2014 Histogram (p. 44) - Graph that uses bars to represent different frequencies or relative
1 Introduction. 1.1 What is Statistics?
 1 Introduction 1.1 What is Statistics? MATH1015 Biostatistics Week 1 Statistics is a scientific study of numerical data based on natural phenomena. It is also the science of collecting, organising, interpreting
Acquisition Description Exploration Examination Understanding what data is collected. Characterizing properties of data.
 Summary Statistics Acquisition Description Exploration Examination what data is collected Characterizing properties of data. Exploring the data distribution(s). Identifying data quality problems. Selecting
2.1 Objectives. Math Chapter 2. Chapter 2. Variable. Categorical Variable EXPLORING DATA WITH GRAPHS AND NUMERICAL SUMMARIES
 EXPLORING DATA WITH GRAPHS AND NUMERICAL SUMMARIES Chapter 2 2.1 Objectives 2.1 What Are the Types of Data? www.managementscientist.org 1. Know the definitions of a. Variable b. Categorical versus quantitative
SPSS for Survey Analysis
 STC: SPSS for Survey Analysis 1 SPSS for Survey Analysis STC: SPSS for Survey Analysis 2 SPSS for Surveys: Contents Background Information... 4 Opening and creating new documents... 5 Starting SPSS...
BIOSTATISTICS LABORATORY PART 1: INTRODUCTION TO DATA ANALYIS WITH STATA: EXPLORING AND SUMMARIZING DATA
 BIOSTATISTICS LABORATORY PART 1: INTRODUCTION TO DATA ANALYIS WITH STATA: EXPLORING AND SUMMARIZING DATA Learning objectives: Getting data ready for analysis: 1) Learn several methods of exploring the
Special Review Section. Copyright 2014 Pearson Education, Inc.
 Special Review Section SRS-1--1 Special Review Section Chapter 1: The Where, Why, and How of Data Collection Chapter 2: Graphs, Charts, and Tables Describing Your Data Chapter 3: Describing Data Using
Surviving SPSS.
 Surviving SPSS http://dataservices.gmu.edu/workshops/spss http://dataservices.gmu.edu/software/spss Debby Kermer George Mason University Libraries Data Services Research Consultant Mason Data Services
CHAPTER 2 DESCRIPTIVE STATISTICS
 CHAPTER 2 DESCRIPTIVE STATISTICS 1. Stem-and-Leaf Graphs, Line Graphs, and Bar Graphs The distribution of data is how the data is spread or distributed over the range of the data values. This is one of
Right-click on whatever it is you are trying to change Get help about the screen you are on Help Help Get help interpreting a table
 Q Cheat Sheets What to do when you cannot figure out how to use Q What to do when the data looks wrong Right-click on whatever it is you are trying to change Get help about the screen you are on Help Help
Introductions Overview of SPSS
 Introductions Overview of SPSS Welcome to our SPSS tutorials. This first tutorial will provide a basic overview of the SPSS environment. We will be using SPSS version 22 for these tutorials, however, versions
AND NUMERICAL SUMMARIES. Chapter 2
 EXPLORING DATA WITH GRAPHS AND NUMERICAL SUMMARIES Chapter 2 2.1 What Are the Types of Data? 2.1 Objectives www.managementscientist.org 1. Know the definitions of a. Variable b. Categorical versus quantitative
Data can be in the form of numbers, words, measurements, observations or even just descriptions of things.
 + What is Data? Data is a collection of facts. Data can be in the form of numbers, words, measurements, observations or even just descriptions of things. In most cases, data needs to be interpreted and
13-FEB :53:53. /Users/yizheng/Dropbo x (ASU) /Work/Alias/ASU/Course /COE502/Labs/sample_ work/lab2/fl_student_s urvey_modified.
 /Work/Alias/ASU/Course /COE502/Labs/sample_ work/lab2/fl_student_s urvey_modified.") GET FILE='/Users/yizheng/Dropbox (ASU)/Work/Alias/ASU/Course/COE502/Labs/dataset s/fl_student_survey_modified.sav '. DATASET NAME DataSet1 WINDOW=FRONT. GET FILE='/Users/yizheng/Dropbox (ASU)/Work/Alias/ASU/Course/COE502/Labs/sample_
GET FILE='/Users/yizheng/Dropbox (ASU)/Work/Alias/ASU/Course/COE502/Labs/dataset s/fl_student_survey_modified.sav '. DATASET NAME DataSet1 WINDOW=FRONT. GET FILE='/Users/yizheng/Dropbox (ASU)/Work/Alias/ASU/Course/COE502/Labs/sample_
INTRODUCTION to SAS STATISTICAL PACKAGE LAB 3
 Topics: Data step Subsetting Concatenation and Merging Reference: Little SAS Book - Chapter 5, Section 3.6 and 2.2 Online documentation Exercise I LAB EXERCISE The following is a lab exercise to give you
Statistics Lecture 6. Looking at data one variable
 Statistics 111 - Lecture 6 Looking at data one variable Chapter 1.1 Moore, McCabe and Craig Probability vs. Statistics Probability 1. We know the distribution of the random variable (Normal, Binomial)
GETTING STARTED. A Step-by-Step Guide to Using MarketSight
 GETTING STARTED A Step-by-Step Guide to Using MarketSight Analyze any dataset Run crosstabs Test statistical significance Create charts and dashboards Share results online Introduction MarketSight is a
12. A(n) is the number of times an item or number occurs in a data set.
 is the number of times an item or number occurs in a data set.") Chapter 15 Vocabulary Practice Match each definition to its corresponding term. a. data b. statistical question c. population d. sample e. data analysis f. parameter g. statistic h. survey i. experiment
Chapter 15 Vocabulary Practice Match each definition to its corresponding term. a. data b. statistical question c. population d. sample e. data analysis f. parameter g. statistic h. survey i. experiment
Preparing for Data Analysis
 Preparing for Data Analysis Prof. Andrew Stokes March 27, 2018 Managing your data Entering the data into a database Reading the data into a statistical computing package Checking the data for errors and
After opening Stata for the first time: set scheme s1mono, permanently
 Stata 13 HELP Getting help Type help command (e.g., help regress). If you don't know the command name, type lookup topic (e.g., lookup regression). Email: tech-support@stata.com. Put your Stata serial
Prepare a stem-and-leaf graph for the following data. In your final display, you should arrange the leaves for each stem in increasing order.
 Chapter 2 2.1 Descriptive Statistics A stem-and-leaf graph, also called a stemplot, allows for a nice overview of quantitative data without losing information on individual observations. It can be a good
Section 6.3: Measures of Position
 Section 6.3: Measures of Position Measures of position are numbers showing the location of data values relative to the other values within a data set. They can be used to compare values from different
Data Management Project Using Software to Carry Out Data Analysis Tasks
 Data Management Project Using Software to Carry Out Data Analysis Tasks This activity involves two parts: Part A deals with finding values for: Mean, Median, Mode, Range, Standard Deviation, Max and Min
Univariate Statistics Summary
 Further Maths Univariate Statistics Summary Types of Data Data can be classified as categorical or numerical. Categorical data are observations or records that are arranged according to category. For example:
Page 1. Graphical and Numerical Statistics
 TOPIC: Description Statistics In this tutorial, we show how to use MINITAB to produce descriptive statistics, both graphical and numerical, for an existing MINITAB dataset. The example data come from Exercise
STA Module 2B Organizing Data and Comparing Distributions (Part II)
") STA 2023 Module 2B Organizing Data and Comparing Distributions (Part II) Learning Objectives Upon completing this module, you should be able to 1 Explain the purpose of a measure of center 2 Obtain and
STA 2023 Module 2B Organizing Data and Comparing Distributions (Part II) Learning Objectives Upon completing this module, you should be able to 1 Explain the purpose of a measure of center 2 Obtain and
STA Learning Objectives. Learning Objectives (cont.) Module 2B Organizing Data and Comparing Distributions (Part II)
 Module 2B Organizing Data and Comparing Distributions (Part II)") STA 2023 Module 2B Organizing Data and Comparing Distributions (Part II) Learning Objectives Upon completing this module, you should be able to 1 Explain the purpose of a measure of center 2 Obtain and
STA 2023 Module 2B Organizing Data and Comparing Distributions (Part II) Learning Objectives Upon completing this module, you should be able to 1 Explain the purpose of a measure of center 2 Obtain and
UNIT 4. Research Methods in Business
 UNIT 4 Preparing Data for Analysis:- After data are obtained through questionnaires, interviews, observation or through secondary sources, they need to be edited. The blank responses, if any have to be
SPSS Statistics 19.0 Fix Pack 2 Fix List Release notes Abstract Content Number Description
 SPSS Statistics 19.0 Fix Pack 2 Fix List Release notes Abstract A comprehensive list of defect corrections for the SPSS Statistics 19.0 Fix Pack 2. Details of the fixes are listed below. If you have questions
SPSS - Beginnings Data, Descriptive Statistics, Select cases, recode Structure SPSS has 3 different fields (windows) 1. Data window (double window). O
 1. Data window (double window). O") SPSS - Beginnings Data, Descriptive Statistics, Select cases, recode Structure SPSS has 3 different fields (windows) 1. Data window (double window). One can see a) data; b) Variable information. 2. Output
SPSS - Beginnings Data, Descriptive Statistics, Select cases, recode Structure SPSS has 3 different fields (windows) 1. Data window (double window). One can see a) data; b) Variable information. 2. Output
Frances Provan i #)# #%'
# #%'") !"#$%&#& Frances Provan i ##+), &'!#( $& #)# *% #%' & SPSS Versions... 2 Some slide shorthand... 2 Did you know you could... 2 Nice newish graphs... 2 Population Pyramids... 2 Population Pyramids: categories...
!"#$%&#& Frances Provan i ##+), &'!#( $& #)# *% #%' & SPSS Versions... 2 Some slide shorthand... 2 Did you know you could... 2 Nice newish graphs... 2 Population Pyramids... 2 Population Pyramids: categories...
Things you ll know (or know better to watch out for!) when you leave in December: 1. What you can and cannot infer from graphs.
 when you leave in December: 1. What you can and cannot infer from graphs.") 1 2 Things you ll know (or know better to watch out for!) when you leave in December: 1. What you can and cannot infer from graphs. 2. How to construct (in your head!) and interpret confidence intervals.
1 2 Things you ll know (or know better to watch out for!) when you leave in December: 1. What you can and cannot infer from graphs. 2. How to construct (in your head!) and interpret confidence intervals.
Lecture Notes 3: Data summarization
 Lecture Notes 3: Data summarization Highlights: Average Median Quartiles 5-number summary (and relation to boxplots) Outliers Range & IQR Variance and standard deviation Determining shape using mean &
Statistical Package for the Social Sciences INTRODUCTION TO SPSS SPSS for Windows Version 16.0: Its first version in 1968 In 1975.
 Statistical Package for the Social Sciences INTRODUCTION TO SPSS SPSS for Windows Version 16.0: Its first version in 1968 In 1975. SPSS Statistics were designed INTRODUCTION TO SPSS Objective About the
Data 100. Lecture 5: Data Cleaning & Exploratory Data Analysis
 Data 100 Lecture 5: Data Cleaning & Exploratory Data Analysis Slides by: Joseph E. Gonzalez, Deb Nolan, & Joe Hellerstein jegonzal@berkeley.edu deborah_nolan@berkeley.edu hellerstein@berkeley.edu? Last
Data 100 Lecture 5: Data Cleaning & Exploratory Data Analysis
 OrderNum ProdID Name OrderId Cust Name Date 1 42 Gum 1 Joe 8/21/2017 2 999 NullFood 2 Arthur 8/14/2017 2 42 Towel 2 Arthur 8/14/2017 1/31/18 Data 100 Lecture 5: Data Cleaning & Exploratory Data Analysis
International Graduate School of Genetic and Molecular Epidemiology (GAME) Computing Notes and Introduction to Stata
 Computing Notes and Introduction to Stata") International Graduate School of Genetic and Molecular Epidemiology (GAME) Computing Notes and Introduction to Stata Paul Dickman September 2003 1 A brief introduction to Stata Starting the Stata program
International Graduate School of Genetic and Molecular Epidemiology (GAME) Computing Notes and Introduction to Stata Paul Dickman September 2003 1 A brief introduction to Stata Starting the Stata program
Preparing for Data Analysis
 Preparing for Data Analysis Prof. Andrew Stokes March 21, 2017 Managing your data Entering the data into a database Reading the data into a statistical computing package Checking the data for errors and
Exploratory Data Analysis
 Chapter 10 Exploratory Data Analysis Definition of Exploratory Data Analysis (page 410) Definition 12.1. Exploratory data analysis (EDA) is a subfield of applied statistics that is concerned with the investigation
QUESTION PORTOFOLIO FOR THE GRID TEST MVE
 1*Which of the following rules is not recommended when writing of a text in Microsoft Word: 0. Typing a space after a common punctuation mark; 1. Typing a space before a common punctuation mark; 2. Typing
Lecture 6: Chapter 6 Summary
 1 Lecture 6: Chapter 6 Summary Z-score: Is the distance of each data value from the mean in standard deviation Standardizes data values Standardization changes the mean and the standard deviation: o Z
Creating a data file and entering data
 4 Creating a data file and entering data There are a number of stages in the process of setting up a data file and analysing the data. The flow chart shown on the next page outlines the main steps that
Univariate descriptives
 Univariate descriptives Johan A. Elkink University College Dublin 18 September 2014 18 September 2014 1 / Outline 1 Graphs for categorical variables 2 Graphs for scale variables 3 Frequency tables 4 Central
CHAPTER 2: DESCRIPTIVE STATISTICS Lecture Notes for Introductory Statistics 1. Daphne Skipper, Augusta University (2016)
") CHAPTER 2: DESCRIPTIVE STATISTICS Lecture Notes for Introductory Statistics 1 Daphne Skipper, Augusta University (2016) 1. Stem-and-Leaf Graphs, Line Graphs, and Bar Graphs The distribution of data is
CHAPTER 2: DESCRIPTIVE STATISTICS Lecture Notes for Introductory Statistics 1 Daphne Skipper, Augusta University (2016) 1. Stem-and-Leaf Graphs, Line Graphs, and Bar Graphs The distribution of data is
IT 403 Practice Problems (1-2) Answers
 Answers") IT 403 Practice Problems (1-2) Answers #1. Using Tukey's Hinges method ('Inclusionary'), what is Q3 for this dataset? 2 3 5 7 11 13 17 a. 7 b. 11 c. 12 d. 15 c (12) #2. How do quartiles and percentiles
IT 403 Practice Problems (1-2) Answers #1. Using Tukey's Hinges method ('Inclusionary'), what is Q3 for this dataset? 2 3 5 7 11 13 17 a. 7 b. 11 c. 12 d. 15 c (12) #2. How do quartiles and percentiles
Data Analyst Nanodegree Syllabus
 Data Analyst Nanodegree Syllabus Discover Insights from Data with Python, R, SQL, and Tableau Before You Start Prerequisites : In order to succeed in this program, we recommend having experience working
Statistical Methods. Instructor: Lingsong Zhang. Any questions, ask me during the office hour, or me, I will answer promptly.
 Statistical Methods Instructor: Lingsong Zhang 1 Issues before Class Statistical Methods Lingsong Zhang Office: Math 544 Email: lingsong@purdue.edu Phone: 765-494-7913 Office Hour: Monday 1:00 pm - 2:00
Applied Regression Modeling: A Business Approach
 i Applied Regression Modeling: A Business Approach Computer software help: SPSS SPSS (originally Statistical Package for the Social Sciences ) is a commercial statistical software package with an easy-to-use
Maximizing Statistical Interactions Part II: Database Issues Provided by: The Biostatistics Collaboration Center (BCC) at Northwestern University
 at Northwestern University") Maximizing Statistical Interactions Part II: Database Issues Provided by: The Biostatistics Collaboration Center (BCC) at Northwestern University While your data tables or spreadsheets may look good to
Maximizing Statistical Interactions Part II: Database Issues Provided by: The Biostatistics Collaboration Center (BCC) at Northwestern University While your data tables or spreadsheets may look good to
IBM SPSS Statistics 22 Brief Guide
 IBM SPSS Statistics 22 Brief Guide Note Before using this information and the product it supports, read the information in Notices on page 77. Product Information This edition applies to version 22, release
> glucose = c(81, 85, 93, 93, 99, 76, 75, 84, 78, 84, 81, 82, 89, + 81, 96, 82, 74, 70, 84, 86, 80, 70, 131, 75, 88, 102, 115, + 89, 82, 79, 106)
") This document describes how to use a number of R commands for plotting one variable and for calculating one variable summary statistics Specifically, it describes how to use R to create dotplots, histograms,
This document describes how to use a number of R commands for plotting one variable and for calculating one variable summary statistics Specifically, it describes how to use R to create dotplots, histograms,
Road Map. Data types Measuring data Data cleaning Data integration Data transformation Data reduction Data discretization Summary
 2. Data preprocessing Road Map Data types Measuring data Data cleaning Data integration Data transformation Data reduction Data discretization Summary 2 Data types Categorical vs. Numerical Scale types
SPSS Statistics 21.0 GA Fix List. Release notes. Abstract
 SPSS Statistics 21.0 GA Fix List Release notes Abstract A comprehensive list of defect corrections for SPSS Statistics 21 GA. Details of the fixes are listed below. If you have questions about a particular
DEPARTMENT OF HEALTH AND HUMAN SCIENCES HS900 RESEARCH METHODS
 DEPARTMENT OF HEALTH AND HUMAN SCIENCES HS900 RESEARCH METHODS Using SPSS Topics addressed today: 1. Accessing data from CMR 2. Starting SPSS 3. Getting familiar with SPSS 4. Entering data 5. Saving data
Data Analyst Nanodegree Syllabus
 Data Analyst Nanodegree Syllabus Discover Insights from Data with Python, R, SQL, and Tableau Before You Start Prerequisites : In order to succeed in this program, we recommend having experience working
Table of Contents (As covered from textbook)
") Table of Contents (As covered from textbook) Ch 1 Data and Decisions Ch 2 Displaying and Describing Categorical Data Ch 3 Displaying and Describing Quantitative Data Ch 4 Correlation and Linear Regression
Table of Contents (As covered from textbook) Ch 1 Data and Decisions Ch 2 Displaying and Describing Categorical Data Ch 3 Displaying and Describing Quantitative Data Ch 4 Correlation and Linear Regression
Error-Bar Charts from Summary Data
 Chapter 156 Error-Bar Charts from Summary Data Introduction Error-Bar Charts graphically display tables of means (or medians) and variability. Following are examples of the types of charts produced by
DO NOT SEND DUPLICATE COPIES OF YOUR LOG AND DO NOT SEND A PRINTED COPY.
 AMERICAN BOARD OF UROLOGY 2018 LIFE LONG LEARNING (LLL) LEVEL 2 PEDIATRIC UROLOGY SUBSPECIALTY CERTIFICATION EXAMINATION PROCESS INSTRUCTIONS FOR SUBMISSION OF ELECTRONIC LOGS Please read all instructions
Introduction to SPSS Edward A. Greenberg, PhD
 Introduction to SPSS Edward A. Greenberg, PhD ASU HEALTH SOLUTIONS DATA LAB JANUARY 7, 2013 Files for this workshop Files can be downloaded from: http://www.public.asu.edu/~eagle/spss or (with less typing):
Chapter 1. Looking at Data-Distribution
 Chapter 1. Looking at Data-Distribution Statistics is the scientific discipline that provides methods to draw right conclusions: 1)Collecting the data 2)Describing the data 3)Drawing the conclusions Raw
DSC 201: Data Analysis & Visualization
 DSC 201: Data Analysis & Visualization Exploratory Data Analysis Dr. David Koop What is Exploratory Data Analysis? "Detective work" to summarize and explore datasets Includes: - Data acquisition and input
- 1 - Fig. A5.1 Missing value analysis dialog box
 WEB APPENDIX Sarstedt, M. & Mooi, E. (2019). A concise guide to market research. The process, data, and methods using SPSS (3 rd ed.). Heidelberg: Springer. Missing Value Analysis and Multiple Imputation
Introduction to StatsDirect, 15/03/2017 1
 INTRODUCTION TO STATSDIRECT PART 1... 2 INTRODUCTION... 2 Why Use StatsDirect... 2 ACCESSING STATSDIRECT FOR WINDOWS XP... 4 DATA ENTRY... 5 Missing Data... 6 Opening an Excel Workbook... 6 Moving around
Lab #1: Introduction to Basic SAS Operations
 Lab #1: Introduction to Basic SAS Operations Getting Started: OVERVIEW OF SAS (access lab pages at http://www.stat.lsu.edu/exstlab/) There are several ways to open the SAS program. You may have a SAS icon
LIFE LONG LEARNING LEVEL INSTRUCTIONS FOR SUBMISSION OF ELECTRONIC LOGS
 AMERICAN BOARD OF UROLOGY LIFE LONG LEARNING LEVEL 2 2018 INSTRUCTIONS FOR SUBMISSION OF ELECTRONIC LOGS Please read all instructions carefully before preparing your log. It is imperative that you carefully
Week 2: Frequency distributions
 Types of data Health Sciences M.Sc. Programme Applied Biostatistics Week 2: distributions Data can be summarised to help to reveal information they contain. We do this by calculating numbers from the data