Exploratory Data Analysis with R. Matthew Renze Iowa Code Camp Fall 2013
|
|
|
- Barnaby Bryan
- 5 years ago
- Views:
Transcription
1 Exploratory Data Analysis with R Matthew Renze Iowa Code Camp Fall 2013
2 Motivation The ability to take data to be able to understand it, to process it, to extract value from it, to visualize it, to communicate it that s going to be a hugely important skill in the next decades, because now we really do have essentially free and ubiquitous data. So the complimentary scarce factor is the ability to understand that data and extract value from it. Hal Varian, Google s Chief Economist The McKinsey Quarterly, Jan 2009
3 Motivation


4 A Flood of Data is Coming... Sink or Swim Source: Source: Wikipedia
5 How Does This Apply to Me? As a software developer, I often: Perform log file analysis Perform performance analysis Analyze code metrics for code quality Detect anomalies in source data Transform or clean data files to make them usable Help decision makers make decisions based on data
6 Purpose Learn a bit about: R Exploratory Data Analysis How to use R for EDA
7 What You Will Not Learn Advanced programming with R Advanced statistical analysis Presentation-quality data visualization Data mining Machine learning
8 Audience Target audience is developers who: Want to learn about R Want to learn about EDA 100-level session (general audience) No prior background in statistics required General programming knowledge required
9 Overview Introduction R Exploratory Data Analysis Exploratory Data Analysis with R Data Munging Descriptive Statistics Data Visualization
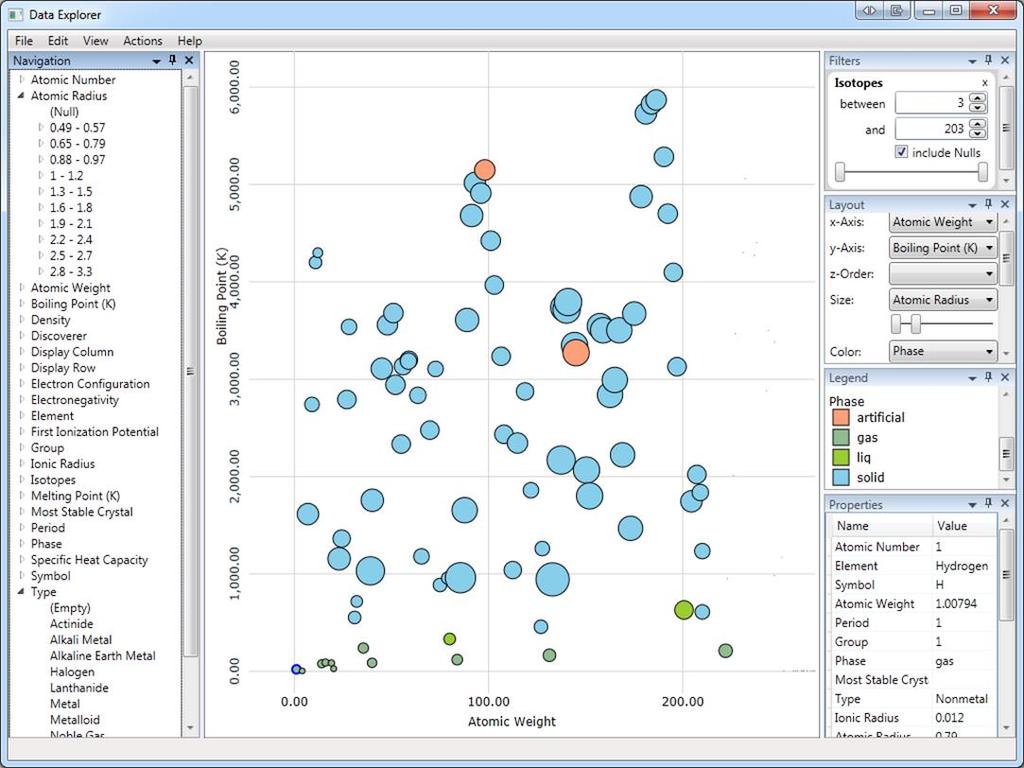
10 About Me Independent software consultant 14 years of professional software development experience Data-driven desktop, server, and web apps Web-based GIS data warehouse Energy data ETL application Global data management system Intelligent lighting control systems Open source data explorer
11


12 Education BS in Computer Science BA in Philosophy Minor in Economics Focus on Artificial Intelligence and Machine Learning AS in MIS AS in Business Administration


13 Training and Certification Kimball Group Training in Data Warehousing ESRI ArcGIS, ArcSDE, ArcGIS Server Training Online Courses on Data Analysis
14 Introduction to R
15 What is R? R is an open source implementation of S

16 What is S? Statistical programming language Developed at Bell Labs in 1976 Originally implemented in Fortran Later rewritten in C Currently owned by TIBCO Software


17 A Brief History of R R is developed by: Ross Ihaka Robert Gentleman R became open source R v.1.0 was released Today, R is at v Source: ~ihaka/downloads/the-r-project.pdf Source:

18 What is R? R is: an open source implementation of S a language and an environment provides methods for both statistical and graphical data analysis runs on Windows, Mac, and Unix systems Source:
19 What is R? R is also: actively under development has a large user community is very modular and extensible has over 4000 extension packages is free (as in beer and as in speech)
20 Popularity of R 26 th most popular programming language 2 nd most popular statistical language Source: TIOBE Index
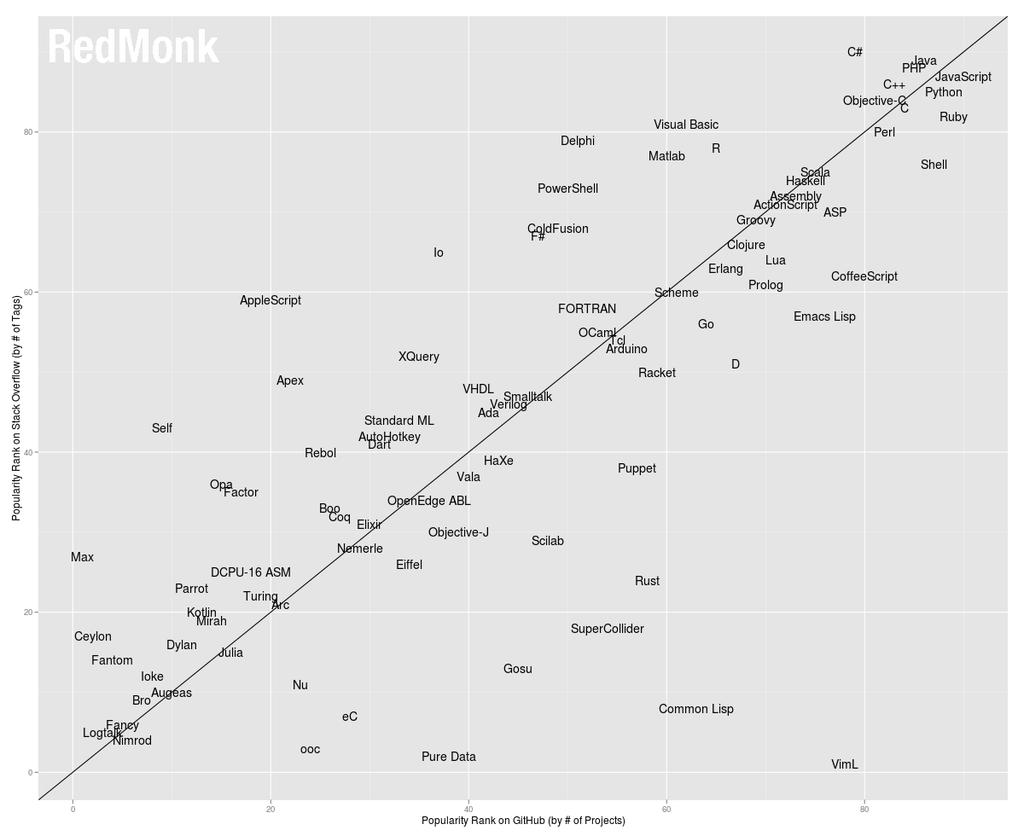
21 Source:

22 What is R?

23 R-Studio Source:
24 Code Demo
25 Exploratory Data Analysis
26 What is Exploratory Data Analysis? An approach to analyzing data, to find previously unknown relationships, typically involving highly visual and interactive methods.
27 Munge Data Analysis Communicate

28 Exploratory Data Analysis (EDA) One of many approaches to data analysis Objectives: Discover patterns Identify anomalies Suggest hypotheses Check assumptions Promoted by John Tukey Source: Time Magazine
29 Exploratory Data Analysis vs. Other Methods of Data Analysis Descriptive Describe the features of the data Inferential Draw generalizations from a sample to a population Predictive Predict values of new data given existing data Causal Determine how one variable affects another variable

30 Confirmatory vs. Exploratory Data Analysis Confirmatory Start with hypothesis Test the null hypothesis Uses statistical models Exploratory No hypothesis at first Generating hypothesis Uses graphical methods p-value = 0.34 α 2 Reject H 0 Accept H 0 Reject H 0

31 Expository vs. Exploratory Data Visualizations Expository Goal is communication of information Wide audience Clean and polished Exploratory Goal is personal understanding Small audience Quick and dirty
32 Problems with EDA Some problems with EDA: Not rigorous like formal statistical methods Susceptible to specific types of statistical biases Not useful for inference or prediction Not efficient for massive data sets There are ways to avoid some of these issues Don t practice statistics without a license!
33 Data Munging
34 Data Munging Transforming data from a raw form to a usable form aka: Data cleaning or data wrangling Many data sets are not initially ready for data analysis Data must be transformed or cleaned first in order to be analyzed Source: Wikimedia
35 Data Munging Tasks Renaming variables Data Type conversion Encoding, decoding, or recoding data Merging data sets Transforming data Handling missing data (imputing) Handling anomalous values
36 Loading Data in R R supports a wide variety of data sources File-based data CSV, TAB, Excel, etc. Web-based data XML, HTML, JSON, etc. Databases JDBC, ODBC, SQL Server, Oracle, MySQL, Access, etc. Statistical data SAS, SPSS, Stata And many more
37 Cleaning Data This step is often the: Most difficult Most time consuming TIP: Record all steps using a script so you can reapply the steps whenever they are needed Source: Wikimedia
38 What are Clean Data? Structure Observations in rows Variables in columns Tables contain only one kind of observation Column names are human readable Rows are uniquely identified ID Date Customer Product Quantity John Pizza John Soda Jill Salad Bob Milk Sue Soda Bob Pizza Jill Pizza Jill Soda 3
39 What are Clean Data? Data No errors No missing values Properly encoded Internally consistent Data types Units of measure Scale ID Date Customer Product Quantity John Pizza John Soda Jill Salad Bob Milk Sue Soda Bob Pizza Jill Pizza Jill Soda 3

40 Code Demo: Lending Club Dataset Sample of 2,500 peer-topeer loans 14 measures include: Amount Requested Amount Funded Interest Rate Monthly Income FICO Score Problem: The data are not in a digestible format Goal: Prepare the data for analysis Source:
41 Code Demo
42 Descriptive Statistics
43 Descriptive Statistics Describe data in quantitative or qualitative ways Provides a summary of the shape of the data aka: Summary statistics Interest Rate Statistic Value Minimum st Quartile Median Mean rd Quartile Maximum Variance Standard Deviation 4.17
44 Statistical Concepts Observations Rows in the table Variables Columns in the table Qualitative variable Categorical values Quantitative variable Numeric values Distribution Function describing the probability of an expected value occurring ID Date Customer Product Quantity John Pizza John Soda Jill Salad Bob Milk Sue Soda Bob Pizza Jill Pizza Jill Soda 3

45 Univariate Analysis Analysis of a single variable Measures include: Central tendency Mean Median Mode Dispersion Min Max Range Quartiles Variance Standard deviation Source: Wikipedia
46 Bivariate Analysis Analysis of the relationship between two variables Predictor Outcome Measures include: Covariance Correlation Source: Wikipedia
47 Code Demo: Movies Data Set Collection of movies from 2003 Measurements include: Movie Name Rating (e.g., G, PG, R) Genre (e.g., Action) Running Length (min) Rotten Tomatoes Score Box Office Revenue ($) Goal: Determine what types of movies make the most money Source:
48 Code Demo
49 Data Visualization

50 Data Visualization Representation of data via visual means Human brain is exceptionally good at visual pattern recognition Map dimensions of data to visual characteristics: Location Size Color Shape
 Quantitative (Numerical) Number of Variables Univariate Bivariate Multivariate Source:")
51 Types of Data Visualizations Several types of data visualizations based on: Type of Variable(s) Qualitative (Categorical) Quantitative (Numerical) Number of Variables Univariate Bivariate Multivariate Source: Wikipedia
52 Code Demo: Movies Data Set Goal: Visualize what types of movies make the most money Source:
53 Code Demo

54 This is just the tip of the iceberg!
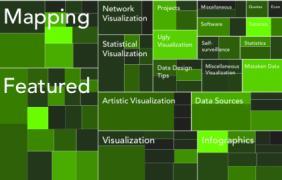
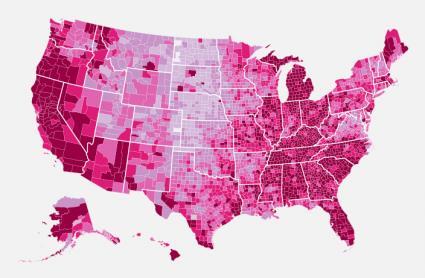
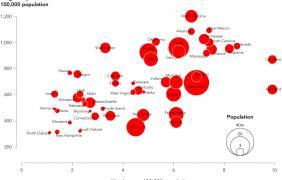
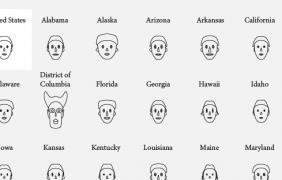

55 Advanced Visualizations Source: Flowing Data


56 Advanced EDA Analysis of Variance (ANOVA) Cluster Analysis Statistical Modeling Dimensionality Reduction

57 Machine-based EDA EDA uses human for pattern recognition Doesn t scale well for higher dimensional data Need to use machines for pattern recognition Data Mining Machine Learning


58 Alternatives to R for EDA Spreadsheets Interactive Data Visualization Tools Statistical Analysis Software Statistical Programming Languages General-Purpose Programming Languages Source: Microsoft Source: Tableau
59 Where to Go Next R website: R Studio: Coursera: Revolutions: Flowing Data: R-Blogger: R Quick Reference Card:
60 Conclusion
61 Conclusion R is a very popular language for data analysis EDA provides rapid understanding of data R + EDA = Powerful insight into your data!
62 Feedback Feedback is very important to me Please fill out a feedback card Specific feedback I m looking for: Did you enjoy the presentation? What could I do to improve this presentation? What other topics would you be interested in?
63 Contact Info Matthew Renze Renze Consulting Data Explorer
Hal Varian, Google s Chief Economist The McKinsey Quarterly, Jan 2009
 The ability to take data to be able to understand it, to process it, to extract value from it, to visualize it, to communicate it that s going to be a hugely important skill in the next decades, because
Practical Data Science with R. Matthew Renze CFT Training for AIG
 Practical Data Science with R Matthew Renze CFT Training for AIG Motivation The ability to take data to be able to understand it, to process it, to extract value from it, to visualize it, to communicate
Practical Data Science with #DevoxxMA
 Practical Data Science with R @matthewrenze #DevoxxMA The ability to take data to be able to understand it, to process it, to extract value from it, to visualize it, to communicate it that s going
Data Analyst Nanodegree Syllabus
 Data Analyst Nanodegree Syllabus Discover Insights from Data with Python, R, SQL, and Tableau Before You Start Prerequisites : In order to succeed in this program, we recommend having experience working
Data Analyst Nanodegree Syllabus
 Data Analyst Nanodegree Syllabus Discover Insights from Data with Python, R, SQL, and Tableau Before You Start Prerequisites : In order to succeed in this program, we recommend having experience working
BIG DATA SCIENTIST Certification. Big Data Scientist
 BIG DATA SCIENTIST Certification Big Data Scientist Big Data Science Professional (BDSCP) certifications are formal accreditations that prove proficiency in specific areas of Big Data. To obtain a certification,
DSC 201: Data Analysis & Visualization
 DSC 201: Data Analysis & Visualization Exploratory Data Analysis Dr. David Koop What is Exploratory Data Analysis? "Detective work" to summarize and explore datasets Includes: - Data acquisition and input
Data Science. Data Analyst. Data Scientist. Data Architect
 Data Science Data Analyst Data Analysis in Excel Programming in R Introduction to Python/SQL/Tableau Data Visualization in R / Tableau Exploratory Data Analysis Data Scientist Inferential Statistics &
Ivy s Business Analytics Foundation Certification Details (Module I + II+ III + IV + V)
") Ivy s Business Analytics Foundation Certification Details (Module I + II+ III + IV + V) Based on Industry Cases, Live Exercises, & Industry Executed Projects Module (I) Analytics Essentials 81 hrs 1. Statistics
Ivy s Business Analytics Foundation Certification Details (Module I + II+ III + IV + V) Based on Industry Cases, Live Exercises, & Industry Executed Projects Module (I) Analytics Essentials 81 hrs 1. Statistics
Slice Intelligence!
 Intern @ Slice Intelligence! Wei1an(Wu( September(8,(2014( Outline!! Details about the job!! Skills required and learned!! My thoughts regarding the internship! About the company!! Slice, which we call
Introduction to Data Science. Introduction to Data Science with Python. Python Basics: Basic Syntax, Data Structures. Python Concepts (Core)
") Introduction to Data Science What is Analytics and Data Science? Overview of Data Science and Analytics Why Analytics is is becoming popular now? Application of Analytics in business Analytics Vs Data
Introduction to Data Science What is Analytics and Data Science? Overview of Data Science and Analytics Why Analytics is is becoming popular now? Application of Analytics in business Analytics Vs Data
Think & Work like a Data Scientist with SQL 2016 & R DR. SUBRAMANI PARAMASIVAM (MANI)
") Think & Work like a Data Scientist with SQL 2016 & R DR. SUBRAMANI PARAMASIVAM (MANI) About the Speaker Dr. SubraMANI Paramasivam PhD., MCT, MCSE, MCITP, MCP, MCTS, MCSA CEO, Principal Consultant & Trainer
Think & Work like a Data Scientist with SQL 2016 & R DR. SUBRAMANI PARAMASIVAM (MANI) About the Speaker Dr. SubraMANI Paramasivam PhD., MCT, MCSE, MCITP, MCP, MCTS, MCSA CEO, Principal Consultant & Trainer
Data Preprocessing. S1 Teknik Informatika Fakultas Teknologi Informasi Universitas Kristen Maranatha
 Data Preprocessing S1 Teknik Informatika Fakultas Teknologi Informasi Universitas Kristen Maranatha 1 Why Data Preprocessing? Data in the real world is dirty incomplete: lacking attribute values, lacking
DSC 201: Data Analysis & Visualization
 DSC 201: Data Analysis & Visualization Exploratory Data Analysis Dr. David Koop Python Support for Time The datetime package - Has date, time, and datetime classes -.now() method: the current datetime
Introduction to Data Science
 Introduction to Data Science CS 491, DES 430, IE 444, ME 444, MKTG 477 UIC Innovation Center Fall 2017 and Spring 2018 Instructors: Charles Frisbie, Marco Susani, Michael Scott and Ugo Buy Author: Ugo
Applied Regression Modeling: A Business Approach
 i Applied Regression Modeling: A Business Approach Computer software help: SAS SAS (originally Statistical Analysis Software ) is a commercial statistical software package based on a powerful programming
Dr. SubraMANI Paramasivam. Think & Work like a Data Scientist with SQL 2016 & R
 Dr. SubraMANI Paramasivam Think & Work like a Data Scientist with SQL 2016 & R About the Speaker Group Leader Dr. SubraMANI Paramasivam PhD., MVP, MCT, MCSE (x2), MCITP (x2), MCP, MCTS (x3), MCSA CEO,
An Introduction to R- Programming
 An Introduction to R- Programming Hadeel Alkofide, Msc, PhD NOT a biostatistician or R expert just simply an R user Some slides were adapted from lectures by Angie Mae Rodday MSc, PhD at Tufts University
Data Mining. Ryan Benton Center for Advanced Computer Studies University of Louisiana at Lafayette Lafayette, La., USA.
 Data Mining Ryan Benton Center for Advanced Computer Studies University of Louisiana at Lafayette Lafayette, La., USA January 13, 2011 Important Note! This presentation was obtained from Dr. Vijay Raghavan
Nuts and Bolts Research Methods Symposium
 Organizing Your Data Jenny Holcombe, PhD UT College of Medicine Nuts & Bolts Conference August 16, 3013 Topics to Discuss: Types of Variables Constructing a Variable Code Book Developing Excel Spreadsheets
intro to data science Module 1
 intro to data science Module 1 what is data science? [Data science is] The sexiest job of the 21st century Harvard Business Review (2012) The ability to take data to be able to understand it, to process
Chapter 3: Data Description - Part 3. Homework: Exercises 1-21 odd, odd, odd, 107, 109, 118, 119, 120, odd
 Chapter 3: Data Description - Part 3 Read: Sections 1 through 5 pp 92-149 Work the following text examples: Section 3.2, 3-1 through 3-17 Section 3.3, 3-22 through 3.28, 3-42 through 3.82 Section 3.4,
Organizing Your Data. Jenny Holcombe, PhD UT College of Medicine Nuts & Bolts Conference August 16, 3013
 Organizing Your Data Jenny Holcombe, PhD UT College of Medicine Nuts & Bolts Conference August 16, 3013 Learning Objectives Identify Different Types of Variables Appropriately Naming Variables Constructing
PSS718 - Data Mining
 Lecture 5 - Hacettepe University October 23, 2016 Data Issues Improving the performance of a model To improve the performance of a model, we mostly improve the data Source additional data Clean up the
Cornerstone 7. DoE, Six Sigma, and EDA
 Cornerstone 7 DoE, Six Sigma, and EDA Statistics made for engineers Cornerstone data analysis software allows efficient work to design experiments and explore data, analyze dependencies, and find answers
Antrix Academy of Data Science TM
 TM Preparing for MOST Promising Career Opportunities in Data Analytics... Excel Tableau SAS Excel & SQL IBM SPSS Business Analytics COURSES # Duration* 1 Excel Proficiency 5 Hrs 2 Data Analytics with SAS
Data Mining Chapter 3: Visualizing and Exploring Data Fall 2011 Ming Li Department of Computer Science and Technology Nanjing University
 Data Mining Chapter 3: Visualizing and Exploring Data Fall 2011 Ming Li Department of Computer Science and Technology Nanjing University Exploratory data analysis tasks Examine the data, in search of structures
STATISTICS FOR PSYCHOLOGISTS
 STATISTICS FOR PSYCHOLOGISTS SECTION: JAMOVI CHAPTER: USING THE SOFTWARE Section Abstract: This section provides step-by-step instructions on how to obtain basic statistical output using JAMOVI, both visually
Learning Objectives for Data Concept and Visualization
 Learning Objectives for Data Concept and Visualization Assignment 1: Data Quality Concept and Impact of Data Quality Summarize concepts of data quality. Understand and describe the impact of data on actuarial
A detailed comparison of EasyMorph vs Tableau Prep
 A detailed comparison of vs We at keep getting asked by our customers and partners: How is positioned versus?. Well, you asked, we answer! Short answer and are similar, but there are two important differences.
Data analysis using Microsoft Excel
 Introduction to Statistics Statistics may be defined as the science of collection, organization presentation analysis and interpretation of numerical data from the logical analysis. 1.Collection of Data
DATA. Business Statistics
 DATA Business Statistics CONTENTS The role of data The data matrix Data types Aspects of data Obtaining data Further study THE ROLE OF DATA Data refers to observed facts there are 82 persons in this train
CHAPTER 3: Data Description
 CHAPTER 3: Data Description You ve tabulated and made pretty pictures. Now what numbers do you use to summarize your data? Ch3: Data Description Santorico Page 68 You ll find a link on our website to a
DATA SCIENCE INTRODUCTION QSHORE TECHNOLOGIES. About the Course:
 DATA SCIENCE About the Course: In this course you will get an introduction to the main tools and ideas which are required for Data Scientist/Business Analyst/Data Analyst/Analytics Manager/Actuarial Scientist/Business
Business Analytics Nanodegree Syllabus
 Business Analytics Nanodegree Syllabus Master data fundamentals applicable to any industry Before You Start There are no prerequisites for this program, aside from basic computer skills. You should be
Data Mining. ❷Chapter 2 Basic Statistics. Asso.Prof.Dr. Xiao-dong Zhu. Business School, University of Shanghai for Science & Technology
 ❷Chapter 2 Basic Statistics Business School, University of Shanghai for Science & Technology 2016-2017 2nd Semester, Spring2017 Contents of chapter 1 1 recording data using computers 2 3 4 5 6 some famous
Data Wrangling in the Tidyverse
 Data Wrangling in the Tidyverse 21 st Century R DS Portugal Meetup, at Farfetch, Porto, Portugal April 19, 2017 Jim Porzak Data Science for Customer Insights 4/27/2017 1 Outline 1. A very quick introduction
ECLT 5810 Data Preprocessing. Prof. Wai Lam
 ECLT 5810 Data Preprocessing Prof. Wai Lam Why Data Preprocessing? Data in the real world is imperfect incomplete: lacking attribute values, lacking certain attributes of interest, or containing only aggregate
Data Visualization Tools & Techniques
 Data Visualization Tools & Techniques John Brosz Research Data & Visualization Coordinator Renée Reaume Digital Media & Technical Services Director http://bit.ly/tfdlvis Plan for Today 9:00 Intro 9:30
SOFTWARE DEVELOPMENT: DATA SCIENCE
 PROFESSIONAL CAREER TRAINING INSTITUTE SOFTWARE DEVELOPMENT: DATA SCIENCE www.pcti.edu/data-science applicant@pcti.edu 832-484-9100 PROGRAM OVERVIEW Prepare for a life changing career as a data scientist
BUSINESS ANALYTICS. 96 HOURS Practical Learning. DexLab Certified. Training Module. Gurgaon (Head Office)
") SAS (Base & Advanced) Analytics & Predictive Modeling Tableau BI 96 HOURS Practical Learning WEEKDAY & WEEKEND BATCHES CLASSROOM & LIVE ONLINE DexLab Certified BUSINESS ANALYTICS Training Module Gurgaon
SAS (Base & Advanced) Analytics & Predictive Modeling Tableau BI 96 HOURS Practical Learning WEEKDAY & WEEKEND BATCHES CLASSROOM & LIVE ONLINE DexLab Certified BUSINESS ANALYTICS Training Module Gurgaon
Pengolahan dan Analisa Data
 Pengolahan dan Analisa Data Data Analysis In most social research the data analysis involves three major steps, done in roughly this order: Cleaning and organizing the data for analysis (Data Preparation)
Bluman & Mayer, Elementary Statistics, A Step by Step Approach, Canadian Edition
 Bluman & Mayer, Elementary Statistics, A Step by Step Approach, Canadian Edition Online Learning Centre Technology Step-by-Step - Minitab Minitab is a statistical software application originally created
An Introduction to Data Mining in Institutional Research. Dr. Thulasi Kumar Director of Institutional Research University of Northern Iowa
 An Introduction to Data Mining in Institutional Research Dr. Thulasi Kumar Director of Institutional Research University of Northern Iowa AIR/SPSS Professional Development Series Background Covering variety
Python With Data Science
 Course Overview This course covers theoretical and technical aspects of using Python in Applied Data Science projects and Data Logistics use cases. Who Should Attend Data Scientists, Software Developers,
Introduction to Data Mining and Data Analytics
 1/28/2016 MIST.7060 Data Analytics 1 Introduction to Data Mining and Data Analytics What Are Data Mining and Data Analytics? Data mining is the process of discovering hidden patterns in data, where Patterns
Introducing Microsoft SQL Server 2016 R Services. Julian Lee Advanced Analytics Lead Global Black Belt Asia Timezone
 Introducing Microsoft SQL Server 2016 R Services Julian Lee Advanced Analytics Lead Global Black Belt Asia Timezone SQL Server 2016: Everything built-in built-in built-in built-in built-in built-in $2,230
8. MINITAB COMMANDS WEEK-BY-WEEK
 8. MINITAB COMMANDS WEEK-BY-WEEK In this section of the Study Guide, we give brief information about the Minitab commands that are needed to apply the statistical methods in each week s study. They are
SPSS TRAINING SPSS VIEWS
 SPSS TRAINING SPSS VIEWS Dataset Data file Data View o Full data set, structured same as excel (variable = column name, row = record) Variable View o Provides details for each variable (column in Data
Data Foundations. Topic Objectives. and list subcategories of each. its properties. before producing a visualization. subsetting
 CS 725/825 Information Visualization Fall 2013 Data Foundations Dr. Michele C. Weigle http://www.cs.odu.edu/~mweigle/cs725-f13/ Topic Objectives! Distinguish between ordinal and nominal values and list
Building Self-Service BI Solutions with Power Query. Written By: Devin
 Building Self-Service BI Solutions with Power Query Written By: Devin Knight DKnight@PragmaticWorks.com @Knight_Devin CONTENTS PAGE 3 PAGE 4 PAGE 5 PAGE 6 PAGE 7 PAGE 8 PAGE 9 PAGE 11 PAGE 17 PAGE 20 PAGE
Data Mining. Data preprocessing. Hamid Beigy. Sharif University of Technology. Fall 1395
 Data Mining Data preprocessing Hamid Beigy Sharif University of Technology Fall 1395 Hamid Beigy (Sharif University of Technology) Data Mining Fall 1395 1 / 15 Table of contents 1 Introduction 2 Data preprocessing
alteryx training courses
 alteryx training courses alteryx designer 2 day course This course covers Alteryx Designer for new and intermediate Alteryx users. It introduces the User Interface and works through core Alteryx capability,
Statistical Package for the Social Sciences INTRODUCTION TO SPSS SPSS for Windows Version 16.0: Its first version in 1968 In 1975.
 Statistical Package for the Social Sciences INTRODUCTION TO SPSS SPSS for Windows Version 16.0: Its first version in 1968 In 1975. SPSS Statistics were designed INTRODUCTION TO SPSS Objective About the
Data Mining. Data preprocessing. Hamid Beigy. Sharif University of Technology. Fall 1394
 Data Mining Data preprocessing Hamid Beigy Sharif University of Technology Fall 1394 Hamid Beigy (Sharif University of Technology) Data Mining Fall 1394 1 / 15 Table of contents 1 Introduction 2 Data preprocessing
ENTERPRISE MINER: 1 DATA EXPLORATION AND VISUALISATION
 ENTERPRISE MINER: 1 DATA EXPLORATION AND VISUALISATION JOZEF MOFFAT, ANALYTICS & INNOVATION PRACTICE, SAS UK 10, MAY 2016 DATA EXPLORATION AND VISUALISATION AGENDA SAS Webinar 10th May 2016 at 10:00 AM
Mean Tests & X 2 Parametric vs Nonparametric Errors Selection of a Statistical Test SW242
 Mean Tests & X 2 Parametric vs Nonparametric Errors Selection of a Statistical Test SW242 Creation & Description of a Data Set * 4 Levels of Measurement * Nominal, ordinal, interval, ratio * Variable Types
Research Data Analysis using SPSS. By Dr.Anura Karunarathne Senior Lecturer, Department of Accountancy University of Kelaniya
 Research Data Analysis using SPSS By Dr.Anura Karunarathne Senior Lecturer, Department of Accountancy University of Kelaniya MBA 61013- Business Statistics and Research Methodology Learning outcomes At
Welcome! Power BI User Group (PUG) Copenhagen
 Copenhagen") Welcome! Power BI User Group (PUG) Copenhagen Connect to Data in Power BI Desktop Just Thorning Blindbæk Consultant, Trainer and Speaker Connect to Data in Power BI Desktop Basic introduction to data connectivity
Welcome! Power BI User Group (PUG) Copenhagen Connect to Data in Power BI Desktop Just Thorning Blindbæk Consultant, Trainer and Speaker Connect to Data in Power BI Desktop Basic introduction to data connectivity
Applied Regression Modeling: A Business Approach
 i Applied Regression Modeling: A Business Approach Computer software help: SPSS SPSS (originally Statistical Package for the Social Sciences ) is a commercial statistical software package with an easy-to-use
Introduction to Data Analytics. David Walling
 Introduction to Data Analytics David Walling walling@tacc.utexas.edu Source: http://research.microsoft.com/en-us/collaboration/fourthparadigm/default.aspx Computational Simulation Model first, given initial
Exploratory data analysis with one and two variables
 Exploratory data analysis with one and two variables Instructions for Lab # 1 Statistics 111 - Probability and Statistical Inference DUE DATE: Upload on Sakai on July 10 Lab Objective To explore data with
Multivariate Data & Tables and Graphs. Agenda. Data and its characteristics Tables and graphs Design principles
 Multivariate Data & Tables and Graphs CS 7450 - Information Visualization Aug. 24, 2015 John Stasko Agenda Data and its characteristics Tables and graphs Design principles Fall 2015 CS 7450 2 1 Data Data
R Language for the SQL Server DBA
 R Language for the SQL Server DBA Beginning with R Ing. Eduardo Castro, PhD, Principal Data Analyst Architect, LP Consulting Moderated By: Jose Rolando Guay Paz Thank You microsoft.com idera.com attunity.com
Data 100 Lecture 5: Data Cleaning & Exploratory Data Analysis
 OrderNum ProdID Name OrderId Cust Name Date 1 42 Gum 1 Joe 8/21/2017 2 999 NullFood 2 Arthur 8/14/2017 2 42 Towel 2 Arthur 8/14/2017 1/31/18 Data 100 Lecture 5: Data Cleaning & Exploratory Data Analysis
Data 100. Lecture 5: Data Cleaning & Exploratory Data Analysis
 Data 100 Lecture 5: Data Cleaning & Exploratory Data Analysis Slides by: Joseph E. Gonzalez, Deb Nolan, & Joe Hellerstein jegonzal@berkeley.edu deborah_nolan@berkeley.edu hellerstein@berkeley.edu? Last
1. Basic Steps for Data Analysis Data Editor. 2.4.To create a new SPSS file
 1 SPSS Guide 2009 Content 1. Basic Steps for Data Analysis. 3 2. Data Editor. 2.4.To create a new SPSS file 3 4 3. Data Analysis/ Frequencies. 5 4. Recoding the variable into classes.. 5 5. Data Analysis/
Quick Start Guide Jacob Stolk PhD Simone Stolk MPH November 2018
 Quick Start Guide Jacob Stolk PhD Simone Stolk MPH November 2018 Contents Introduction... 1 Start DIONE... 2 Load Data... 3 Missing Values... 5 Explore Data... 6 One Variable... 6 Two Variables... 7 All
Data Interoperability An Introduction
 Data Interoperability An Introduction Bruce Harold Dale Lutz - Esri Inc - Safe Software What is the Data Interoperability Extension? Moving data from app to app ETL in industry jargon If you are not the
Minitab 17 commands Prepared by Jeffrey S. Simonoff
 Minitab 17 commands Prepared by Jeffrey S. Simonoff Data entry and manipulation To enter data by hand, click on the Worksheet window, and enter the values in as you would in any spreadsheet. To then save
DSC 201: Data Analysis & Visualization
 DSC 201: Data Analysis & Visualization Exploratory Data Analysis Dr. David Koop http://www.cis.umassd.edu/~dkoop/dsc201 2 Chicago Food Inspections Exploration Based on David Beazley's PyData Chicago talk
Writing Analytical Queries for Business Intelligence
 MOC-55232 Writing Analytical Queries for Business Intelligence 3 Days Overview About this Microsoft SQL Server 2016 Training Course This three-day instructor led Microsoft SQL Server 2016 Training Course
WELCOME! Lecture 3 Thommy Perlinger
 Quantitative Methods II WELCOME! Lecture 3 Thommy Perlinger Program Lecture 3 Cleaning and transforming data Graphical examination of the data Missing Values Graphical examination of the data It is important
Oracle Big Data Discovery
 Oracle Big Data Discovery Turning Data into Business Value Harald Erb Oracle Business Analytics & Big Data 1 Safe Harbor Statement The following is intended to outline our general product direction. It
Yunfeng Zhang 1, Huan Wang 2, Jie Zhu 1 1 Computer Science & Engineering Department, North China Institute of Aerospace
 [Type text] [Type text] [Type text] ISSN : 0974-7435 Volume 10 Issue 20 BioTechnology 2014 An Indian Journal FULL PAPER BTAIJ, 10(20), 2014 [12526-12531] Exploration on the data mining system construction
Now, Data Mining Is Within Your Reach
 Clementine Desktop Specifications Now, Data Mining Is Within Your Reach Data mining delivers significant, measurable value. By uncovering previously unknown patterns and connections in data, data mining
Designing a New. Data Dashboard. January Page 1
 Designing a New Data Dashboard January 2018 Page 1 Acknowledgements This guide was created under JSI s Center for Health Information, Monitoring & Evaluation (CHIME) with efforts led by Allison Schlak
SPSS QM II. SPSS Manual Quantitative methods II (7.5hp) SHORT INSTRUCTIONS BE CAREFUL
 SHORT INSTRUCTIONS BE CAREFUL") SPSS QM II SHORT INSTRUCTIONS This presentation contains only relatively short instructions on how to perform some statistical analyses in SPSS. Details around a certain function/analysis method not covered
SPSS QM II SHORT INSTRUCTIONS This presentation contains only relatively short instructions on how to perform some statistical analyses in SPSS. Details around a certain function/analysis method not covered
SQL Server 2016 R Integration for database administrators
 SQL Server 2016 R Integration for database administrators What can DBA gain by using R Integration for SQL Server 2016? Tomaž Kaštrun 20.Jänner, 2017 Our Sponsors About BI Developer and data analyst (SQL
An introduction to SPSS
 An introduction to SPSS To open the SPSS software using U of Iowa Virtual Desktop... Go to https://virtualdesktop.uiowa.edu and choose SPSS 24. Contents NOTE: Save data files in a drive that is accessible
Data Mining: Concepts and Techniques. (3 rd ed.) Chapter 3. Chapter 3: Data Preprocessing. Major Tasks in Data Preprocessing
 Chapter 3. Chapter 3: Data Preprocessing. Major Tasks in Data Preprocessing") Data Mining: Concepts and Techniques (3 rd ed.) Chapter 3 1 Chapter 3: Data Preprocessing Data Preprocessing: An Overview Data Quality Major Tasks in Data Preprocessing Data Cleaning Data Integration Data
Data Mining: Concepts and Techniques (3 rd ed.) Chapter 3 1 Chapter 3: Data Preprocessing Data Preprocessing: An Overview Data Quality Major Tasks in Data Preprocessing Data Cleaning Data Integration Data
SPSS INSTRUCTION CHAPTER 9
 SPSS INSTRUCTION CHAPTER 9 Chapter 9 does no more than introduce the repeated-measures ANOVA, the MANOVA, and the ANCOVA, and discriminant analysis. But, you can likely envision how complicated it can
Analytical model A structure and process for analyzing a dataset. For example, a decision tree is a model for the classification of a dataset.
 Glossary of data mining terms: Accuracy Accuracy is an important factor in assessing the success of data mining. When applied to data, accuracy refers to the rate of correct values in the data. When applied
Business Intelligence Roadmap HDT923 Three Days
 Three Days Prerequisites Students should have experience with any relational database management system as well as experience with data warehouses and star schemas. It would be helpful if students are
Oracle Big Data Science
 Oracle Big Data Science Tim Vlamis and Dan Vlamis Vlamis Software Solutions 816-781-2880 www.vlamis.com @VlamisSoftware Vlamis Software Solutions Vlamis Software founded in 1992 in Kansas City, Missouri
COMP33111: Tutorial/lab exercise 2
 COMP33111: Tutorial/lab exercise 2 Part 1: Data cleaning, profiling and warehousing Note: use lecture slides and additional materials (see Blackboard and COMP33111 web page). 1. Explain why legacy data
MHPE 494: Data Analysis. Welcome! The Analytic Process
 MHPE 494: Data Analysis Alan Schwartz, PhD Department of Medical Education Memoona Hasnain,, MD, PhD, MHPE Department of Family Medicine College of Medicine University of Illinois at Chicago Welcome! Your
Product Catalog. AcaStat. Software
 Product Catalog AcaStat Software AcaStat AcaStat is an inexpensive and easy-to-use data analysis tool. Easily create data files or import data from spreadsheets or delimited text files. Run crosstabulations,
Data Preprocessing. Data Mining 1
 Data Preprocessing Today s real-world databases are highly susceptible to noisy, missing, and inconsistent data due to their typically huge size and their likely origin from multiple, heterogenous sources.
Multivariate Data & Tables and Graphs. Agenda. Data and its characteristics Tables and graphs Design principles
 Topic Notes Multivariate Data & Tables and Graphs CS 7450 - Information Visualization Aug. 27, 2012 John Stasko Agenda Data and its characteristics Tables and graphs Design principles Fall 2012 CS 7450
Dr. Michael Curry. Oregon. The Big Picture: SQL Overview and Getting the Most from SQL Saturday
 Dr. Michael Curry michael.curry@wsu.edu Oregon The Big Picture: SQL Overview and Getting the Most from SQL Saturday Academic Data Management E-Commerce Entrepreneurship Dr. Michael Curry /michaellcurry/
IJMIE Volume 2, Issue 9 ISSN:
 WEB USAGE MINING: LEARNER CENTRIC APPROACH FOR E-BUSINESS APPLICATIONS B. NAVEENA DEVI* Abstract Emerging of web has put forward a great deal of challenges to web researchers for web based information
Basic Statistical Terms and Definitions
 I. Basics Basic Statistical Terms and Definitions Statistics is a collection of methods for planning experiments, and obtaining data. The data is then organized and summarized so that professionals can
Viságe.BIT. An OLAP/Data Warehouse solution for multi-valued databases
 Viságe.BIT An OLAP/Data Warehouse solution for multi-valued databases Abstract : Viságe.BIT provides data warehouse/business intelligence/olap facilities to the multi-valued database environment. Boasting
3. Data Preprocessing. 3.1 Introduction
 3. Data Preprocessing Contents of this Chapter 3.1 Introduction 3.2 Data cleaning 3.3 Data integration 3.4 Data transformation 3.5 Data reduction SFU, CMPT 740, 03-3, Martin Ester 84 3.1 Introduction Motivation
2. Data Preprocessing
 2. Data Preprocessing Contents of this Chapter 2.1 Introduction 2.2 Data cleaning 2.3 Data integration 2.4 Data transformation 2.5 Data reduction Reference: [Han and Kamber 2006, Chapter 2] SFU, CMPT 459
Basic concepts and terms
 CHAPTER ONE Basic concepts and terms I. Key concepts Test usefulness Reliability Construct validity Authenticity Interactiveness Impact Practicality Assessment Measurement Test Evaluation Grading/marking
2) familiarize you with a variety of comparative statistics biologists use to evaluate results of experiments;
 familiarize you with a variety of comparative statistics biologists use to evaluate results of experiments;") A. Goals of Exercise Biology 164 Laboratory Using Comparative Statistics in Biology "Statistics" is a mathematical tool for analyzing and making generalizations about a population from a number of individual
A. Goals of Exercise Biology 164 Laboratory Using Comparative Statistics in Biology "Statistics" is a mathematical tool for analyzing and making generalizations about a population from a number of individual
1 Overview of Statistics; Essential Vocabulary
 1 Overview of Statistics; Essential Vocabulary Statistics: the science of collecting, organizing, analyzing, and interpreting data in order to make decisions Population and sample Population: the entire
USERS CONFERENCE Copyright 2016 OSIsoft, LLC
 Bridge IT and OT with a process data warehouse Presented by Matt Ziegler, OSIsoft Complexity Problem Complexity Drives the Need for Integrators Disparate assets or interacting one-by-one Monitoring Real-time