Introduction to ArcGIS
|
|
|
- Lee Harmon
- 6 years ago
- Views:
Transcription
1 Introduction to ArcGIS Prepared by David R. Maidment Center for Research in Water Resources University of Texas at Austin Updated by David Tarboton, September 2015 Table of Contents Goals Computer and Data Requirements Procedure 1. Viewing Shapefiles in ArcMap 2. Viewing Shapefiles in ArcCatalog 3. Using Basemaps from ArcGIS Online 4. Accessing and querying attribute data 5. Selecting features from a feature class 6. Mapping annual evaporation 7. Making a chart 8. Making a map layout 9. Mapping in ArcGIS Online 10. Adding Pan Evaporation Data 11. Configuring Pop-Ups 12. Adding Counties and Map Notes 13. Sharing the Map on the Web Items to be turned in. Goals of the Exercise This exercise introduces you to ArcMap and ArcCatalog. You use these applications to create a map of pan evaporation stations in Texas, and to draw a graph of monthly pan evaporation data measured at these stations. You use ArcCatalog to create a new personal geodatabase and import shapefiles to a feature dataset. The relationship between ArcGIS and MS Word and Excel is demonstrated so that you can create graphs in Excel, maps in ArcGIS and place the result in a Word file as a report for this homework. In this way, you link the spatial location of the observation sites, with the time variation of the water observations data at those sites. You will also use ArcGIS Online to create a web map of evaporation data and save that so that it can be publicly viewed. 1
2 Computer and Data Requirements To carry out this exercise, you need to have a computer, which runs ArcGIS Desktop version (This exercise will also work with version 10.2 if you do not have access to 10.3.) You will also need an ESRI Global Account to enable you to login to ArcGIS Online. If you do not already have an ESRI Global Account, go to: and create one. In the first part of this exercise using ArcGIS Desktop, you will be working with the following spatial datasets: 1. A polygon shapefile of the counties of Texas, called Counties 2. A point shapefile of pan evaporation stations, called Evap 3. A polygon shapefile of the state of Texas, called Texas These shapefiles consist of several files (e.g. evap.dbf, evap.shp, evap.shx). You can get them from this zip file: You need to establish a working folder to do the exercise on. This can be in any convenient location on the computer you are working on (e.g. C:\Users\dtarb\Ex1). After you have downloaded the zip file Ex1Data.zip double click on the file and you should see Winzip or other zip utility to open the file on your computer (if it doesn t open you ll have to unzip this file on a computer that has a zip utility installed). Extract all files from the zip file to the working folder that you ve set up to do this exercise. You should end up with a file list that looks something like this. You may see these data within a sequence of folder names, and if so, click on each folder down through the sequence until you locate the required files. 2


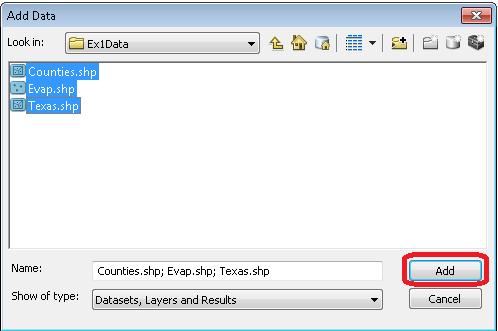
3 Procedure Please note that the following procedure is a general outline, which can be followed to complete this lesson. However, you are encouraged to experiment with the program and to be creative. 1. Viewing Shapefiles in ArcMap A shapefile is a homogenous collection of simple features that includes geometry and feature attributes. The attributes are contained in a dbase table, which allows for the joining with a feature based on the attribute key. Open ArcMap and select the A new empty map option. If you are using Windows 7, hit the Start button and you ll see a series of options for ArcGIS. Select ArcMap. If you are using Windows 8, you ll see in your Windows display. If you don t see that, then just type ArcMap.. and you ll see the program symbol appear. Use the Add Data button to add the data for this exercise to the ArcMap display. 3


4 To enable navigation to the folder, which contains the data, first select Connect to Folder and navigate to the folder that contains your files. Here I selected my entire user folder so that ArcGIS has access to any files there. Then navigate to the folder containing the exercise data and select all three files at once by using the shift key. Click the Add button to add the data to your ArcMap display. 4
5 5

6 The display should look something like the above. Depending on the order in which themes were added the Texas theme may lie above the counties theme so you cannot see the counties theme. Click on the List by Drawing Order button in the Table of Contents page: Click in the Table of Contents area below the feature class names so that three themes are no longer highlighted, then click on the counties theme and drag it up so that it is located above the Texas theme. You ll then get a display showing the counties. 6

7 To change the appearance of a map display, you can access the Symbology menu just by clicking on the Symbol displayed in the ArcMap table of contents, and you ll get the Symbol Selector window Click on the symbol color box, make your selections for the Fill Color, Outline Width and Outline Color, and click OK. You can show the outline of the State of Texas more distinctly by using the No Color 7


8 symbology for the Fill Color and then changing the Outline Color to Green and the Outline Width to 2. Drag the Texas layer above the Counties layer, and you ll see that the Counties are not obscured as they were before and the State of Texas is highlighted with a nice Green outline! We are green in Texas! If you have another color for your Counties, then click on the Counties symbol in the Legend and in the Symbol Selector window that appears select a nice green color and hit Ok to recolor your counties. 8
. When you do this, the Ex1.")

9 Save your work in ArcMap by choosing File/Save and, after navigating to your working directory, naming the file Ex1 (the file will be assigned the extension mxd). When you do this, the Ex1.mxd file contains the table of contents and symbology information for your map. You can shut down Arc Map and then invoke Arc Map again and reload the same map display by clicking on Ex1.mxd. 9


10 Note that the mxd file that is saved does not contain the data. Rather it contains references to the data. This means that if you move the data files and then try and load the map document that ArcMap may not be able to find the data. Helpful Tips: It is often helpful to set Map Document Properties to store relative pathnames to data sources. Then if you keep the map document and its data in the same folder and move the entire folder between computers the references to the data in the map persist. Also, if you open your ArcMap Ex1.mxd file later from another location in your file system, you may see a red exclamation points beside your feature classes. If this happens, in ArcMap, right click on the feature class use Data/RepairData Sources to relocate the file location where the corresponding data are now stored and your map will display correctly again. 10


11 2. Viewing Shapefiles in ArcCatalog Open ArcCatalog by clicking on the Catalog tab on the right hand side of the map display Click on the Folder Connections button and navigate to where your data are stored. If you right click on a data layer, you can obtain an Item Description 11


12 Select the Preview tab and then Geography to see a map of the feature class And then select the Table view 12


13 The attributes FID, Shape, Area and Perimeter are standard attributes for ArcGIS feature classes. The units of the area and perimeter are defined from the map units of the feature class. If you right click on a feature class and then select Properties And select XY Coordinate System which shows you the parameters of the coordinate system of these data, NAD83, or the North American Datum of This provides a rather complicated set of parameters that we ll learn more about later. 13

14 If you click on the Fields tab, you ll see a formal definition of each attribute field with its Field Name and Data Type. In this case, ObjectID means a special data type that indexes each feature as an object in the GIS, Geometry means that the Shape field has geographical coordinates stored in it, and Float and Double mean decimal numbers in single or double precision, respectively. There are some other data types such as Short and Long integers, Text and Date types that we ll encounter later in the course. Click on the other two data layers, Evap and Texas to preview them also. 3. Using Base Maps from ArcGIS Online Up to this point we have just used local GIS data in our display. Let s instead using base maps from ArcGIS Online. Use Add Basemap (the little arrow to the right of the + for Add Data): 14


15 Click on Streets and Add. If you get a message asking about Hardware Acceleration, say Yes to it. You should see a background map appear behind your Texas display like that shown below. Pretty cool! 15


16 If your BaseMap does not show up, use the Refresh tool in the bottom left hand corner of the ArcMap display to redraw the map and the BaseMap should then show up. To quickly get the map to center on Texas, right click on the Texas layer and select Zoom to Layer 16


17 Click on the Counties theme and use the Symbol Selector to change the Fill Color to No Color so we can see through it to the background map, and the new display appears. Click on the symbol for the Evap points and use the Symbol Selector to change the size of the points to 10 and the color to Red. Let s examine Travis County. 17


18 Use the Zoom in button to select a box around Travis County Zoom in to Travis County by Austin in the center of Texas, and let s examine the evaporation site by Lake Travis to the Northwest of the city. Notice how more detailed information appears as you zoom in closer. 18


19 Let s label the sites with their names. Right click on the Evap theme and select Properties at the bottom of the display that appears. Select the Labels tab and for the Label Field, select Station, and 16 point as the type size. Hit Apply and then Ok, to close this window. 19


20 Now, right click on the Evap theme again and select Label Features, and you ll see a nice label Lake Travis appear by the site next to Lake Travis. Now we ve got a nice map that shows the location of our observation site labeled with its name. If you zoom in a bit closer, you can see just where the site is located near Lake Travis. You can even see the access roads you d use to go to this site. 20


21 Now, let s look at some imagery for this location. Proceeding as you did before to get the Street map, use Add BaseMap, to add data for Imagery Turn off the Street Map (uncheck it in the table of contents) so you can see the imagery. And now you ll see the same information displayed against a background map of orthoimagery, and let s zoom in a bit to see more detail. For the Evap theme, I have used the Properties/Label to change the color of my site labels from black to blue to make them easier to see against the image background. This is really cool stuff! You can really get a sense of context about where this observation site is located. Use File/Save to save this map display as Ex1.mxd so that you can get it back later if you need it. 21

22 4. Accessing and Querying Attribute Data Let s go back to the view we had earlier of Travis County. Use the Go Back to Previous Extent arrow to step back through the views we have just been working on, and turn off the Image basemap so that you can see the Streets basemap again. Change the Label color for the evap sites back to Black. Numerical and text information stored in the fields of the shapefile tables are called attributes. To access attribute data of the feature at a specific location: Click on the Identify tool Click on the feature on the map you are interested in. In the Identify window that pops up you ll see the attributes of that particular feature. In this instance, what you see is that the data for Lake Travis, cover the range from 2003 to 2010, the latitude and longitude are and , and the values from Jan through Dec are the mean monthly evaporation recorded at this location, in inches, whose annual total is an Annual of inches. 22

23 These are pan evaporation data recorded using an instrument like that shown below. The evaporation data were obtained from the Texas Water Development Board. Only data from 2001 onwards is used since the TWDB has quality control checked that information. Monthly evaporation is found by averaging the daily values of evaporation read from the pan, and multiplying by the number of days in the month. If a month has fewer than 20 daily values recorded, it is excluded from the dataset. Only years with valid monthly data for all 12 months are used in computing the mean monthly and mean annual pan evaporation data shown in the attribute table. 23


24 Viewing an Attribute Table To access attribute data of an entire layer, in ArcMap: right click on the Evap layer name in the table of contents, and select Open Attribute Table: And if you scroll down the resulting Table and click on FID 24 you ll see the record that contains the attributes of the Lake Travis station that you identified earlier. Click on this to select it, and you ll see the corresponding point selected in the map this is a key idea of GIS map features are described by records in attribute tables. 24


25 To Clear a Selected feature and select a new one, use: Selection/Clear Selected Features in the ArcMap toolbar: 5. Selecting features from a feature class Selecting features from a feature class involves choosing a subset of all the features in the class for a specific purpose. Feature selection can be made from a map by identifying the geometric shape or from an attribute table by identifying the record. Regardless of how you select an object, both the shape in the map and the record in the attribute table will be selected. Click on the Select Features by Rectangle tool If zoom back a little bit and drag a box over the three evaporation sites in the Highland Lakes reservoir system, you ll see both records highlighted on the map and in the attribute table. I ve turned off the Counties layer and used Show selected records at the bottom of the Attribute Table to just show the three highlighted stations. 25


26 To clear your selection, choose Selection/Clear Selected Features. Clicking on Show all records, then displays all the records in the attribute table again. 26


27 6. Mapping Annual Evaporation Let s suppose we want to map the values of annual evaporation recorded at the stations, rather than just symbolizing them by their location. Right click on the Evap layer and select Properties/Symbology Show Quantities/Graduated Symbols with the Value field of Annual, and make the Template color blue. 27


28 I have turned off all the other layers and added the Topographic base map to get the image below. Very cool! 28

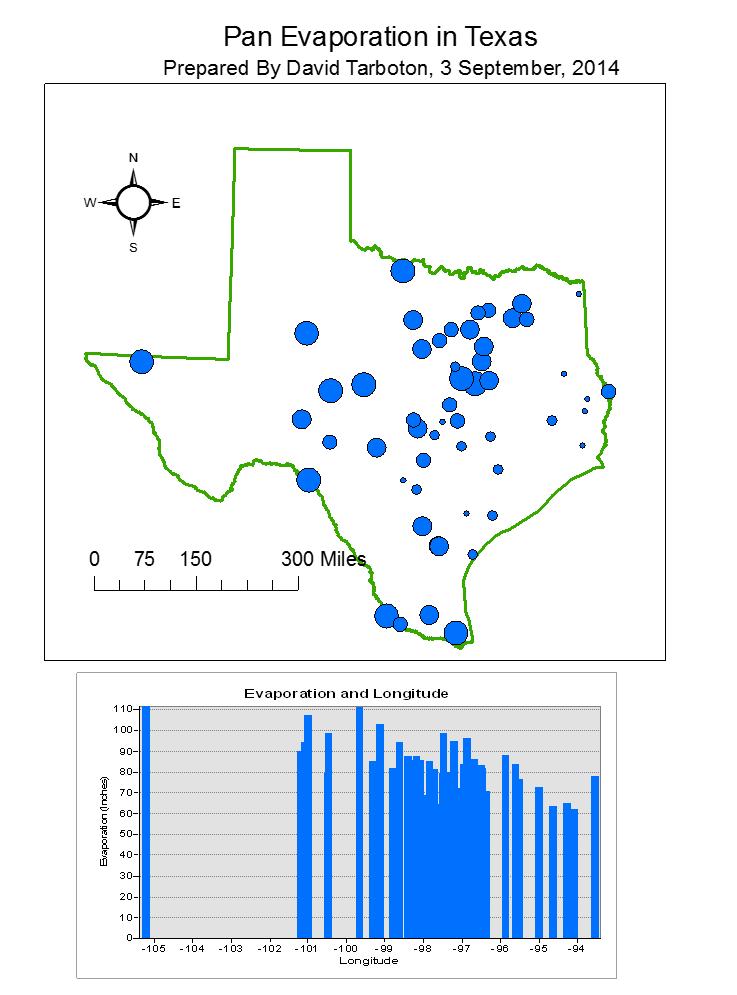
29 7. Making a Chart You can see from the map that there is some tendency for lower evaporation values near the coast and to the East and higher values to the West. Charts are useful because they allow you to visualize trends in data. Open the Evap layer attribute table. Click on Table Options at the top left of the Table and select Create Graph to open the Create Graph Wizard. You will be making a Vertical bar chart (the default option). The next screen will allow you to indicate the data to be used in the graph. Here is a graph of the Annual Evaporation (Annual) of all the stations plotted against the Longitude of the station. You can see that there is a general trend of the evaporation increasing as you go from East to West in Texas. The color of the chart bars is blue, the same as the map 29

30 points. Click off Add to Legend to get rid of the legend on the right hand side. Hit Next and edit the graph properties to make them nicer. Add a title Evaporation and Longitude and relabel the vertical axis Evaporation (Inches) 30

31 Click Finish, and you ve created a graph linked to mapped features in ArcMap. If you create the same kind of graph for Evaporation and Latitude, you can see that there isn t a tendency for evaporation to vary with latitude in Texas, as there is for variation of evaporation with longitude. 31

32 Save your ArcMap document Ex1.mxd so that you can retain this display. 32

.")
33 Graphing in Excel Another graphing option is to make a chart in Excel using the dbase tables given by the evaporation shapefile. Open the evaporation attributes table Evap.dbf as a table in Excel. Use Files of Type: dbase files in Excel to focus only on.dbf tables when you open the table. When you open the file, you ll see that the Station name is very wide (254 characters). Right click on this column in Excel and select Column width of 30 characters to correct this. 33
 12 10 8 6 4 2 0 Jan Feb Mar Apr May Jun Jul Aug Sep Oct Nov Dec 8.")
34 Select the stations you want to plot, copy their records to a new worksheet, delete the columns you don't need there, and then create a chart. Here is an example chart created this way. Monthly Evaporation at Lake Travis Evaporation (Inches) Jan Feb Mar Apr May Jun Jul Aug Sep Oct Nov Dec 8. Creating a Map Layout Now we are going to create a formal map of evaporation in Texas that includes the charts that we ve created. Change the format of the display window from Data View to Layout View by clicking on View/Layout View, If nothing shows up in your layout, hit Focus Data Frame to put your map in the Layout Window. 34

35 . Reduce the size of the data frame in the layout (i.e., rectangle where the spatial data is contained) -- to make room for the graph -- by clicking on the map and moving its handlers. If you have a zoomed in view in Arc Map, you ll get the same image in the Layout. To move your map around use the Pan tool in the Tools toolbar You can switch back and forth between data view and layout view. Changes made in one view will be reflected in the other view. I have turned off the Basemap to make the map easier to interpret. 35

36 Keep saving your ArcMap document as you proceed through the map making steps so that if you mess up something you can get back the work you ve already done. To insert the ArcMap Chart into the Layout, right-click on the upper blue bar at the top of the Chart and select Add to Layout. Move and resize the graph as necessary. If you want to copy your graph from Excel, highlight the graph, and click on Copy in Excel, then Paste in ArcMap and your graph should appear in the map layout. 36


37 You can also insert a North Arrow and a Scale Bar by using the Insert menu in ArcMap. When you put up the scale bar you can select the distance units to be displayed. I have used miles. Note that if you look at the bottom right of ArcMap in Data View you see coordinates in Decimal Degrees. This is an indication that the map is being displayed using geographic coordinates. It is not strictly correct to use a length scale when data is displayed in geographic coordinates as lengths are different in the North-South and East-West directions. You will learn more about this in future classes. For now let's switch the coordinates used in the display. 37
.")
38 Right click on the Layers entry in the table of contents and select properties. Layers is the name of the Data Frame used to display information in ArcMap. In Data Frame Properties click on Coordinate System and navigate to Projected Coordinate Systems -> State Systems -> NAD 1983 Texas Centric Mapping System Albers (Meters). Click OK and Yes to the Warning about the coordinate system differing from one or more data sources in the map. 38

39 Note that for this exercise it does not really matter which coordinate system we select, but we need a projected coordinate system so that the scale bar is correct. Note that the display of Texas is adjusted according to the new projection. 39

40 In the above I also set the Data Frame Display units to Meters for consistency with this coordinate system. 40

41 Switch back to Layout View. Select Customize -> Toolbars -> Draw to open the Draw Tool 41


42 You can add a Title or Text with the text tool shown next to the line draw tool. The text displays in very small font sizes. Select and click on them, and use Properties to resize them. You can also add title and text from the Insert menu. Your map might look like this: 42

43 You can export your map from ArcGIS using File/Export Map from the ArcMap menu, and you can store this as Ex1.emf in your data file. 43


44 Then you can add it to a Word document using Insert/Picture/From File and load this emf file, as shown below. This preserves the crisp resolution of the ArcMap display in a word document. However there are some cautions embedding emf files in other documents. They do depend on ESRI fonts so if you try to print them on a computer that does not have these fonts installed you may get unexpected results. Also sometimes PDF is not properly created for documents that contain emf objects. 44
45 45


46 Helpful Tip: A more general procedure is to simply copy the screen to the clipboard and crop out the part that you want, saving it to a file for later use. That is how all the images in this exercise were prepared. To copy any image, use the Snipping Tool in All Programs/Accessories on your Windows Desktop interface Drag the cursor around the area that you want to capture and you ll see it copied into a new display, then use Paste to insert this snippet into a specific location in your document. If you only want to capture the active frame, press Alt + Print Screen and then Paste it to the new document. This approach can also be used to add a map to a chart in Excel: Evaporation (Inches) Monthly Evaporation at Lake Travis Jan Feb Mar Apr May Jun Jul Aug Sep Oct Nov Dec The manipulations just described transfer objects from one application to another. To be turned in: An ArcMap map layout in it showing a map of Texas with gages, coupled with a graph showing monthly evaporation data plotted from the gages. In the presentation of information on maps and charts it is important to include sufficient labeling detail so that the information can be clearly and unambiguously interpreted. You should include a scale bar to indicate distance, a north arrow to indicate direction and labels or legends with units wherever they are needed to interpret map or quantitative values. 46
47 9. Mapping in ArcGIS Online Now, let s suppose that you don t have ArcGIS Desktop and you want to make a map anyway. Let s do this in ArcGIS Online. You can make a map in ArcGIS Online without an ESRI Global Account, but if you want to save the map and share it with others on the web, you have to have an ESRI Global Account to do that. If you don t have and ESRI Global Account, go to and create an account. For Organization use University of Texas at Austin or Utah State University, whichever applies for you. To execute this part of the exercise you need to have two files: (1) A Comma Separated Variable (CSV) file of Texas Pan Evaporation: (2) A zipped shape file of Texas Counties: These files are also available in the zip file linked on the class website. Go to and sign in with your ArcGIS Online Username and Password The landing page should look similar to the screen below. Click on "My Content" 47


48 This opens a section where you can manage the content you have added to ArcGIS.com. I have created a New Folder called GISWR2015 to store information in from this class and to keep this separate from what I have done in ArcGIS Online for other purposes. Click on. Enter a Title and Tags, then click OK. 48
49 This brings up a Topographic Map of the United States to which we ll add the pan evaporation data. Zoom in to Texas. You can press Shift and then use your mouse to drag a box across Texas to facilitate zooming in. 49


50 10. Adding Pan Evaporation Data Add a Layer from File Browse to TexasPanEvap.csv and click Import Layer 50
51 You ll see the points added to the map. This works because the.csv file has the Latitude and Longitude of the points in decimal degrees: 51
 for the drawing style Here you can adjust the Symbols. For example, click on the Symbols circle and change the color to blue.")
52 You will also see that the YearCount column was selected to scale attributes. Next to the blue 1, choose "Annual" Evaporation for attribute to show. Select Options below Counts and Amounts (size) for the drawing style Here you can adjust the Symbols. For example, click on the Symbols circle and change the color to blue. Click OK and Done when you are satisfied. Hit Apply and Done Changing Symbols and you ll see a new map, and if you click on one of the observation sites, you can see a pop up with the data values at that point. 52

53 Ok, this is pretty cool. You ve just created a web map with your own data in it. Now, let s save the map into your ArcGIS Online workspace: Now if you look in Home/My Content, 53


54 You ll see that you have the new map stored there. If you click on the Texas Evaporation map title, you ll see a window open that tells you about this map. If you Open in map viewer, 54

55 you ll see your map again as you had it before. If you Open in ArcGIS for Desktop ArcMap will open and you will be prompted to enter your username and password. Then the map will open in ArcMap. There is thus interoperability between the desktop application and web mapping application. 11. Configuring Pop-Ups Let s configure the content of the information displayed when a point is clicked so that it shows just selected attributes, and also a chart of monthly pan evaporation. Select Configure Pop-Up for the TexasPanEvap layer. 55

56 Hit Configure Attributes. At the panel that opens select Station and all the monthly and annual evaporation values. Unselect other attributes. Hit OK and Save Pop-up. Now, your map will show a reduced set of attributes when you click on a point. 56

57 Now, Configure the Pop-up again, Scroll down the Pop-up properties and add a Line Chart 57

58 Make the title Monthly Pan Evaporation and select all the monthly pan evaporation values to display. Click Ok to apply these choices. Click Save Pop-Up to get the new chart in the Pop-Up display. 58

59 And now when you click on a point you get rather a nice chart, which along with the annual value of pan evaporation tells you the total evaporation and gives an image of how it is distributed over the year. 59


60 Click on Save to save these changes to your map for next time you open it. If you forget to Save the map configuration changes seem to be lost when you close the browser. 12. Adding Counties and Map Notes Now, let s add the Counties layer to provide some more spatial context for the observation points We ll add the Counties as a zipped file of the Counties shape file. 60


61 Under drawing style select Location (Single symbol). Change the color if you like. When the Counties layer displays, it is the first layer on top of the map and it obscures the pan evaporation points. The Counties layer can be moved down so that the points are more clearly displayed 61


62 And if you set the Transparency of the Counties layer to 75%, a rather pleasant map appears: 62

63 Let s Save the map so we can retrieve it in this condition again. Now, let s suppose we want to Add some Notes on this map. Just accept the template as it is presented to you using Create Add Stickpins to highlight the Pan Evaporation Sites at Lake Travis and Ivie Reservoir, both important water supply lakes on the Colorado River in Texas. Click on the Stickpin tool, then click on the map to place the stickpin. Add Title and Description Text. Click Close. 63


64 When you are done click on the Edit button to toggle editing off. The result is a Map Notes layer where you can click on the Map Notes symbol to see the information you added. 64

65 Save your map. The save step sometimes takes a while. 65

66 13. Sharing your Map on the Web Now let s suppose you want to Share this map with colleagues online. Click on Share I am a member of a number of Groups in ArcGIS Online, and I could choose just to share my map with one or more of those, but instead, let s share the map to Everyone (public), and that way anyone can see it. I get back a web link for this 66
 for your map so that I can view it online.")
67 And if I put this address into a web browser, my map appears again! Ok, this is pretty cool. I ve created a map on the web and shared it with others. To be turned in: The web link (equivalent to my for your map so that I can view it online. Summary of Items to be Turned In: (1) An ArcMap map layout in it showing a map of Texas with evaporation gages, coupled with a graph showing evaporation data plotted from the gages. In the presentation of information on maps and charts it is important to include sufficient labeling detail so that the information can be clearly and unambiguously interpreted. You should include a scale bar to indicate distance, a north arrow to indicate direction and labels or legends with units wherever they are needed to interpret map or quantitative values. Let s see some nice cartography!! (2) The web link (equivalent to for your map so that I can view it online. The assignment is due in a week from the date it was assigned in class. 67
68 UT Austin: Please submit your solution through Canvas to assignment Exercise 1. USU: Please submit your assignment as a single Microsoft word or PDF document in Canvas. 68
Introduction to ArcGIS
 Introduction to ArcGIS Prepared by David R. Maidment Center for Research in Water Resources University of Texas at Austin September 2013 Table of Contents Goals Computer and Data Requirements Procedure
Introduction to ArcGIS Desktop
 Introduction to ArcGIS Desktop Prepared by David R. Maidment Center for Research in Water Resources University of Texas at Austin September 2011 Contents Goals of the Exercise Computer and Data Requirements
Introduction to ArcGIS
 Introduction to ArcGIS Prepared by David R. Maidment and David G. Tarboton Center for Research in Water Resources University of Texas at Austin Updated to ArcGIS Pro by Paul Ruess, August 2016 Updated
Exercise 1: An Overview of ArcMap and ArcCatalog
 Exercise 1: An Overview of ArcMap and ArcCatalog Introduction: ArcGIS is an integrated collection of GIS software products for building a complete GIS. ArcGIS enables users to deploy GIS functionality
Geographical Information Systems Institute. Center for Geographic Analysis, Harvard University. LAB EXERCISE 1: Basic Mapping in ArcMap
 Harvard University Introduction to ArcMap Geographical Information Systems Institute Center for Geographic Analysis, Harvard University LAB EXERCISE 1: Basic Mapping in ArcMap Individual files (lab instructions,
METIER Course n februray Introduction to ArcView 3
 METIER Course n 2 Information Management in Environmental Sciences 19-23 februray 2007 Introduction to ArcView 3 tél : (33) 04 67 54 87 54 Maison de la Télédétection en Languedoc-Roussillon fax : (33)
Explore some of the new functionality in ArcMap 10
 Explore some of the new functionality in ArcMap 10 Scenario In this exercise, imagine you are a GIS analyst working for Old Dominion University. Construction will begin shortly on renovation of the new
GIS Basics for Urban Studies
 GIS Basics for Urban Studies Date: March 21, 2018 Contacts: Mehdi Aminipouri, Graduate Peer GIS Faciliator, SFU Library (maminipo@sfu.ca) Keshav Mukunda, GIS & Map Librarian Librarian for Geography (kmukunda@sfu.ca)
Introduction to GIS & Mapping: ArcGIS Desktop
 Introduction to GIS & Mapping: ArcGIS Desktop Your task in this exercise is to determine the best place to build a mixed use facility in Hudson County, NJ. In order to revitalize the community and take
GIS LAB 1. Basic GIS Operations with ArcGIS. Calculating Stream Lengths and Watershed Areas.
 GIS LAB 1 Basic GIS Operations with ArcGIS. Calculating Stream Lengths and Watershed Areas. ArcGIS offers some advantages for novice users. The graphical user interface is similar to many Windows packages
Exercise 1, Part B: GIS on the Web
 Exercise 1, Part B: GIS on the Web GIS in Water Resources, Fall 2011 Prepared by David Tarboton, Utah State University Purpose The purpose of this part of the exercise is to illustrate and gain experience
Geography 281 Mapmaking with GIS Project One: Exploring the ArcMap Environment
 Geography 281 Mapmaking with GIS Project One: Exploring the ArcMap Environment This activity is designed to introduce you to the Geography Lab and to the ArcMap software within the lab environment. Please
In order to follow this set of directions you will need the following
 How to Create Maps & Figures in ArcView 9x In order to follow this set of directions you will need the following 1) the Jenny s Louisiana GIS Instructional CD 2) a computer with ArcGIS on it (version 9.0
Step by Step GIS. Section 1
 Step by Step GIS Section 1 Contact the web page given below for the data required to do the exercises (http://www.pasda.psu.edu/default.asp) Before beginning the tutorials please visit the Preparation
Introduction to ArcGIS for Brushy Creek
 Introduction to ArcGIS for Brushy Creek Course exercise for CE 374K Hydrology University of Texas at Austin Prepared by Sili Liu and David R. Maidment January, 2012 DESCRIPTION A geographic information
INTRODUCTION TO GIS WORKSHOP EXERCISE
 111 Mulford Hall, College of Natural Resources, UC Berkeley (510) 643-4539 INTRODUCTION TO GIS WORKSHOP EXERCISE This exercise is a survey of some GIS and spatial analysis tools for ecological and natural
Geography 281 Mapmaking with GIS Project One: Exploring the ArcMap Environment
 Geography 281 Mapmaking with GIS Project One: Exploring the ArcMap Environment This activity is designed to introduce you to the Geography Lab and to the ArcMap software within the lab environment. Before
LAB 1: Introduction to ArcGIS 8
 LAB 1: Introduction to ArcGIS 8 Outline Introduction Purpose Lab Basics o About the Computers o About the software o Additional information Data ArcGIS Applications o Starting ArcGIS o o o Conclusion To
Lab Assignment 4 Basics of ArcGIS Server. Due Date: 01/19/2012
 Lab Assignment 4 Basics of ArcGIS Server Due Date: 01/19/2012 Overview This lab assignment is designed to help you develop a good understanding about the basics of ArcGIS Server and how it works. You will
Getting Started with GIS using ArcGIS 10.6 What is GIS? and - Module 1 Creating a map document
 Getting Started with GIS using ArcGIS 10.6 What is GIS? and - Module 1 Creating a map document Marcel Fortin Map & Data Library mdl@library.utoronto.ca 2018 http://mdl.library.utoronto.ca This workshop
Chapter 6. Building Maps with ArcGIS Online
 Chapter 6 Building Maps with ArcGIS Online Summary: ArcGIS Online is an on-line mapping software that allows you to upload tables with latitude and longitude geographic coordinates to create map layers
The ArcMap Interface and Using Basic ArcMap Analysis Tools to Create a Map
 The ArcMap Interface and Using Basic ArcMap Analysis Tools to Create a Map *You will need a computer with ESRI ArcGIS Desktop version 9.3 or higher installed* Data Download 1. Save the zipped folder with
An Introduction to Geographic Information Systems (GIS) using ArcGIS 9.2
 using ArcGIS 9.2") An Introduction to Geographic Information Systems (GIS) using ArcGIS 9.2 by Marcel Fortin, GIS and Map Librarian, University of Toronto Libraries, 2009 gis.maps@utoronto.ca http://www.library.utoronto.ca/maplib/
An Introduction to Geographic Information Systems (GIS) using ArcGIS 9.2 by Marcel Fortin, GIS and Map Librarian, University of Toronto Libraries, 2009 gis.maps@utoronto.ca http://www.library.utoronto.ca/maplib/
1. Start ArcMap by going to the Start menu > All Programs > ArcGIS > ArcMap.
 Learning ArcGIS: Introduction to ArcMap 10.1 The Map Document Feature Manipulation Navigating ArcMap Map Documents, Layers, and Features Shapes, Location, and Attribute Data Symbology Zoom, Pan and Map
4. If you are prompted to enable hardware acceleration to improve performance, click
 Exercise 1a: Creating new points ArcGIS 10 Complexity: Beginner Data Requirement: ArcGIS Tutorial Data Setup About creating new points In this exercise, you will use an aerial photograph to create a new
Exercise 1: Getting to know ArcGIS
 The Scenario You are working for the California Visitor s Commission. You have been asked to prepare a map of California for several dignitaries from out of the country. Your map will need to include enough
_Tutorials. Arcmap. Linking additional files outside from Geodata
 _Tutorials Arcmap Linking additional files outside from Geodata 2017 Sourcing the Data (Option 1): Extracting Data from Auckland Council GIS P1 First you want to get onto the Auckland Council GIS website
Tutorial 1 Exploring ArcGIS
 Tutorial 1 Exploring ArcGIS Before beginning this tutorial, you should make sure your GIS network folder is mapped on the computer you are using. Please refer to the How to map your GIS server folder as
RAPIDMAP Geocortex HTML5 Viewer Manual
 RAPIDMAP Geocortex HTML5 Viewer Manual This site was developed using the evolving HTML5 web standard and should work in most modern browsers including IE, Safari, Chrome and Firefox. Even though it was
City of La Crosse Online Mapping Website Help Document
 City of La Crosse Online Mapping Website Help Document This document was created to assist in using the new City of La Crosse online mapping sites. When the website is first opened, a map showing the City
GIS IN ECOLOGY: CREATING RESEARCH MAPS
 GIS IN ECOLOGY: CREATING RESEARCH MAPS Contents Introduction... 2 Elements of Cartography... 2 Course Data Sources... 3 Tasks... 3 Establishing the Map Document... 3 Laying Out the Map... 5 Exporting Your
ArcGIS Basics: Mapping the US
 ArcGIS Basics: Mapping the US Revised February 15, 2010 Tufts University Author: Barbara Parmenter Introduction...1 Part 1 - Opening ArcMap and adding data layers...1 Part 2 Moving around the Map...4 Part
Name: Date: June 27th, 2011 GIS Boot Camps For Educators Lecture_3
 Name: Date: June 27th, 2011 GIS Boot Camps For Educators Lecture_3 Practical: Creating and Editing Shapefiles Using Straight, AutoComplete and Cut Polygon Tools Use ArcCatalog to copy data files from:
STUDENT PAGES GIS Tutorial Treasure in the Treasure State
 STUDENT PAGES GIS Tutorial Treasure in the Treasure State Copyright 2015 Bear Trust International GIS Tutorial 1 Exercise 1: Make a Hand Drawn Map of the School Yard and Playground Your teacher will provide
Downloading shapefiles and using essential ArcMap tools
 CHAPTER 1 KEY CONCEPTS downloading shapefiles learning essential tools exploring the ArcMap table of contents understanding shapefiles customizing shapefiles saving projects Downloading shapefiles and
OnCOR Silverlight Viewer Guide
 Getting Around There are many ways to move around the map! The simplest option is to use your mouse in the map area. If you hold the left button down, then click and drag, you can pan the map to a new
Office of Geographic Information Systems
 Office of Geographic Information Systems Print this Page Fall 2012 - Working With Layers in the New DCGIS By Kent Tupper The new version of DCGIS has access to all the same GIS information that our old
Page 1 of 16 CONTENTS:
 Page 1 of 16 CONTENTS: HOME-BOX -- (PG.2) o PROPERTY OWNERSHIP o ADDRESS SEARCH o I WANT TO AERIAL IMAGERY AND BASE MAPS -- (PG.2) o IMAGERY WITH LABELS ON/OFF o TOPOGRAPHY ON/OFF o TRANSPARENCY ZOOM IN
Basic Tasks in ArcGIS 10.3.x
 Basic Tasks in ArcGIS 10.3.x This guide provides instructions for performing a few basic tasks in ArcGIS 10.3.1, such as adding data to a map document, viewing and changing coordinate system information,
Geography 281 Map Making with GIS Project Two: Map Design Issues in ArcMap
 Geography 281 Map Making with GIS Project Two: Map Design Issues in ArcMap This activity provides an introduction to the map design process. It takes you through a typical sequence from the initial decision
Tutorial 1: Finding and Displaying Spatial Data Using ArcGIS
 Tutorial 1: Finding and Displaying Spatial Data Using ArcGIS This tutorial will introduce you to the following: Websites where you may browse to find geospatial information Identifying spatial data, usable
BIO8014 GIS & Remote Sensing Practical Series. Practical 1: Introduction to ArcGIS Desktop
 BIO8014 GIS & Remote Sensing Practical Series Practical 1: Introduction to ArcGIS Desktop 0. Introduction There are various activities associated with the term GIS, these include visualisation, manipulation
LAB EXERCISE #1 (25pts)
") Grossmont College Introduction to Geographic Information Science Name: Instructors: Judd Curran & Mark Goodman 1 LAB EXERCISE #1 (25pts) ArcGIS Map Projection on the Fly: Working with: U.S. Map illustrating
Grossmont College Introduction to Geographic Information Science Name: Instructors: Judd Curran & Mark Goodman 1 LAB EXERCISE #1 (25pts) ArcGIS Map Projection on the Fly: Working with: U.S. Map illustrating
Exercise 1: Introduction to MapInfo
 Geog 578 Exercise 1: Introduction to MapInfo Page: 1/22 Geog 578: GIS Applications Exercise 1: Introduction to MapInfo Assigned on January 25 th, 2006 Due on February 1 st, 2006 Total Points: 10 0. Convention
Map Direct Lite. Quick Start Guide: Map Layers 5/14/2018
 Map Direct Lite Quick Start Guide: Map Layers 5/14/2018 Contents Quick Start Guide: Map Layers... 1 Map Layers in Map Direct Lite.... 3 What is a Basemap Layer?... 4 Change the Basemap Using the Basemap
Lab 3: Digitizing in ArcMap
 Lab 3: Digitizing in ArcMap What You ll Learn: In this Lab you ll be introduced to basic digitizing techniques using ArcMap. You should read Chapter 4 in the GIS Fundamentals textbook before starting this
Making a Sackville Coastal Flood Map
 Making a Sackville Coastal Flood Map Demo covers: Accessing and previewing map templates Modifying map elements such as titles, data frames, legends & scale bars Drawing a graphic on a map Adding text
THE HONG KONG POLYTECHNIC UNIVERSITY DEPARTMENT OF LAND SURVEYING & GEO-INFORMATICS LSGI521 PRINCIPLES OF GIS
 THE HONG KONG POLYTECHNIC UNIVERSITY DEPARTMENT OF LAND SURVEYING & GEO-INFORMATICS LSGI521 PRINCIPLES OF GIS Student name: Student ID: Table of Content Working with files, folders, various software and
GEOG 487 Lesson 4: Step-by-Step Activity
 GEOG 487 Lesson 4: Step-by-Step Activity Part I: Visually Explore Trends In Part I, we will explore several tools and technique to make it easier to visually interpret patterns in your data using ArcGIS.
Intro to GIS (requirements: basic Windows computer skills and a flash drive)
") Introduction to GIS Intro to GIS (requirements: basic Windows computer skills and a flash drive) Part 1. What is GIS. 1. System: hardware (computers, devices), software (proprietary or free), people. 2.
Introduction to GIS Intro to GIS (requirements: basic Windows computer skills and a flash drive) Part 1. What is GIS. 1. System: hardware (computers, devices), software (proprietary or free), people. 2.
Downloading Census Data from American Factfinder for use in ArcGIS
 Downloading Census Data from American Factfinder for use in ArcGIS Written by Barbara Parmenter, revised September 24 2013 OBTAINING DATA FROM AMERICAN FACTFINDER (AFF)... 1 PREPARING AMERICAN FACTFINDER
In this lab, you will create two maps. One map will show two different projections of the same data.
 Projection Exercise Part 2 of 1.963 Lab for 9/27/04 Introduction In this exercise, you will work with projections, by re-projecting a grid dataset from one projection into another. You will create a map
Development Authority of the North Country (DANC) Internet Mapping Application Instructions Public Viewer 1. Purpose. 2. Logging-in. 3.
 Internet Mapping Application Instructions Public Viewer 1. Purpose. 2. Logging-in. 3.") Development Authority of the North Country (DANC) Internet Mapping Application Instructions Public Viewer 1. Purpose The purpose of this document is to outline basic functionality of the DANC Internet
Development Authority of the North Country (DANC) Internet Mapping Application Instructions Public Viewer 1. Purpose The purpose of this document is to outline basic functionality of the DANC Internet
CE 549 Lab 1 - Linking Streamflow Data to a Gauging Station
 CE 549 Lab 1 - Linking Streamflow Data to a Gauging Station Prepared by Venkatesh Merwade Lyles School of Civil Engineering, Purdue University vmerwade@purdue.edu January 2018 Objective The objective of
ArcGIS 10.x Basic Exercise GMU Libraries
 ArcGIS 10.x Basic Exercise GMU Libraries Goals of this exercise To introduce basic functions available in ArcGIS 10.x to create a simple thematic map You are going to create a thematic map using VA county
SilvAssist 3.5 Instruction Manual Instruction Manual for the SilvAssist Toolbar For ArcGIS. Version 3.5
 Instruction Manual for the SilvAssist Toolbar For ArcGIS Version 3.5 1 2 Contents Introduction... 5 Preparing to Use SilvAssist... 6 Polygon Selection... 6 Plot Allocator... 7 Requirements:... 7 Operation...
Geocoding vs. Add XY Data using Reference USA data in ArcMap
 Geocoding vs. Add XY Data using Reference USA data in ArcMap 10.4.1 Written by Barbara Parmenter. Revised by Carolyn Talmadge 2/27/2017 GETTING BUSINESS DATA FROM REFERENCE USA BY NAICS AND CITY... 2 MODIFY
Introduction to GIS 2011
 Introduction to GIS 2011 Digital Elevation Models CREATING A TIN SURFACE FROM CONTOUR LINES 1. Start ArcCatalog from either Desktop or Start Menu. 2. In ArcCatalog, create a new folder dem under your c:\introgis_2011
Press the Plus + key to zoom in. Press the Minus - key to zoom out. Scroll the mouse wheel away from you to zoom in; towards you to zoom out.
 Navigate Around the Map Interactive maps provide many choices for displaying information, searching for more details, and moving around the map. Most navigation uses the mouse, but at times you may also
Map Viewer User Guide
 Map Viewer User Guide Sea Level Scenario Sketch Planning Tool Version 2, 2017 University of Florida GeoPlan Center Introduction The purpose of this document is to guide users on how to use the Sea Level
Digitising a map in arcgis desktop 10.3
 Digitising a map in arcgis desktop 10.3 1 CONTENTS 2 Evaluating your map... 2 3 Setting up the base map... 3 4 Georeferencing your map/maps... 3 4.1 Georeferencing tips.... 4 5 Digitising your maps...
Exercise 4: Import Tabular GPS Data and Digitizing
 Exercise 4: Import Tabular GPS Data and Digitizing You can create NEW GIS data layers by digitizing on screen with an aerial photograph or other image as a back-drop. You can also digitize using imported
Lab 1: Exploring ArcMap and ArcCatalog In this lab, you will explore the ArcGIS applications ArcCatalog and ArcMap. You will learn how to use
 Lab 1: Exploring ArcMap and ArcCatalog In this lab, you will explore the ArcGIS applications ArcCatalog and ArcMap. You will learn how to use ArcCatalog to find maps and data and how to display maps in
MAPLOGIC CORPORATION. GIS Software Solutions. Getting Started. With MapLogic Layout Manager
 MAPLOGIC CORPORATION GIS Software Solutions Getting Started With MapLogic Layout Manager Getting Started with MapLogic Layout Manager 2011 MapLogic Corporation All Rights Reserved 330 West Canton Ave.,
Session 3: Cartography in ArcGIS. Mapping population data
 Exercise 3: Cartography in ArcGIS Mapping population data Background GIS is well known for its ability to produce high quality maps. ArcGIS provides useful tools that allow you to do this. It is important
GIS DATA SUBMISSION USER GUIDE. Innovation and Networks Executive Agency
 Innovation and Networks Executive Agency GIS DATA SUBMISSION USER GUIDE Innovation and Networks Executive Agency (INEA) W910 Chaussée de Wavre 910 B-1049 Brussels, Belgium Tel: +32 (0)2 29 95252 Fax: +32
Overview of ArcGIS Online Applications. Champaign County
 Overview of ArcGIS Online Applications Champaign County Champaign County GIS Consortium Updated: April 2017 Table of Contents ArcGIS Online Application Overview... 3 Map Interface Symbology and Terminology...
Geocoding Reference USA data in ArcMap 9.3
 Tufts GIS Tip Sheet Geocoding Reference USA data in ArcMap 9.3 Written by Barbara Parmenter Revised 3/1/2011 In this exercise, you will map businesses or services for a town in the Boston metropolitan
The Preparing for Success Online Mapping Tool
 The Preparing for Success Online Mapping Tool Baker Polito Administration The Executive Office of Housing and Economic Development and MassGIS Questions & Comments? Please contact MassWorks@state.ma.us
Guide to Mapping Website (Public) December 2016 GC_236594
 December 2016 GC_236594") Guide to Mapping Website (Public) December 2016 GC_236594 Table of Contents Guide to Mapping Website (Public)... 1 December 2016... 1 Quick Start... 3 Map Layers... 4 How do I?... 5 Draw on the Map...
Guide to Mapping Website (Public) December 2016 GC_236594 Table of Contents Guide to Mapping Website (Public)... 1 December 2016... 1 Quick Start... 3 Map Layers... 4 How do I?... 5 Draw on the Map...
Calculate a Distance Matrix of Locations along River Network
 Calculate a Distance Matrix of Locations along River Network These instructions enable you to measure the length of line segments between points, which is much more useful than simple straight-line distances
Lab 3: Digitizing in ArcGIS Pro
 Lab 3: Digitizing in ArcGIS Pro What You ll Learn: In this Lab you ll be introduced to basic digitizing techniques using ArcGIS Pro. You should read Chapter 4 in the GIS Fundamentals textbook before starting
Mn/DOT MnCMAT Crash Analysis Application Help
 Mn/DOT MnCMAT Crash Analysis Application Contents Login... 5 User Login Dialog... 5 Login... 5 Request Access Dialog... 5 Forgotten Password Dialog... 6 Create/Open Project... 7 Create/Open Project Dialog...
Managing Multiple Layouts in ArcGIS Pro
 Managing Multiple Layouts in ArcGIS Pro By Mike Price, Entrada/San Juan, Inc. What you will need ArcGIS Desktop with ArcMap 10.4 or higher and ArcGIS Pro 1.4 licenses ArcGIS Online for organizations account
City of Richmond Interactive Map (RIM) User Guide for the Public
 User Guide for the Public") Interactive Map (RIM) User Guide for the Public Date: March 26, 2013 Version: 1.0 3479477 3479477 Table of Contents Table of Contents Table of Contents... i About this
Interactive Map (RIM) User Guide for the Public Date: March 26, 2013 Version: 1.0 3479477 3479477 Table of Contents Table of Contents Table of Contents... i About this
Juniata County, Pennsylvania
 GIS Parcel Viewer Web Mapping Application Functional Documentation June 21, 2017 Juniata County, Pennsylvania Presented by www.worldviewsolutions.com (804) 767-1870 (phone) (804) 545-0792 (fax) 115 South
GIS Exercise 10 March 30, 2018 The USGS NCGMP09v11 tools
 GIS Exercise 10 March 30, 2018 The USGS NCGMP09v11 tools As a result of the collaboration between ESRI (the manufacturer of ArcGIS) and USGS, ESRI released its Geologic Mapping Template (GMT) in 2009 which
Downloading Census Data from American Factfinder2 for use in ArcGIS
 Downloading Census Data from American Factfinder2 for use in ArcGIS Written by Barbara Parmenter, revised November 18, 2011 OBTAINING DATA FROM AMERICAN FACTFINDER2... 1 PREPARING AMERICAN FACTFINDER DATA
Greenville County Internet Mapping System User s Guide
 Greenville County Internet Mapping System User s Guide Version 2.0 Greenville County Geographic Information Systems May 30, 2006 Table of Contents NAVIGATING TO THE ONLINE MAPPING APPLICATIONS...- 3 -
Lesson 8 : How to Create a Distance from a Water Layer
 Created By: Lane Carter Advisor: Paul Evangelista Date: July 2011 Software: ArcGIS 10 Lesson 8 : How to Create a Distance from a Water Layer Background This tutorial will cover the basic processes involved
GIS DATA SUBMISSION USER GUIDE. Innovation and Networks Executive Agency
 Innovation and Networks Executive Agency GIS DATA SUBMISSION USER GUIDE Innovation and Networks Executive Agency (INEA) W910 Chaussée de Wavre 910 B-1049 Brussels, Belgium Tel: +32 (0)2 29 95252 Fax: +32
GPS TO GIS EXERCISE (30 PTS)
") GPS TO GIS EXERCISE (30 PTS) This exercise will allow you to demonstrate your cumulative knowledge of using a GPS receiver to collect data with locational information, downloading this data to a desktop
GPS TO GIS EXERCISE (30 PTS) This exercise will allow you to demonstrate your cumulative knowledge of using a GPS receiver to collect data with locational information, downloading this data to a desktop
Chapter 7. A Quick Tour of ArcGIS Pro
 Chapter 7 A Quick Tour of ArcGIS Pro Skills you will learn: This tutorial is intended to get you going using ArcGIS Pro, a new desktop application that is part of ArcGIS Desktop. A separate tutorial gives
Importing GPS points and Hyperlinking images.
 Geol 3050 GIS for Geologists Exercise 15 Exercise 15 Making a Virtual Fieldtrip: Importing GPS points and Hyperlinking images. Due: Thursday, March 22. Goal: A) Get familiar with importing GPS points and
9 Share results online
 Lesson 9 Share results online THE CITY COUNCIL WOULD LIKE to make the park analysis available to the public. A paper map, such as the one we made in the last lesson, is the traditional way to share results,
Creating a reference map
 Chapter 1 Creating a reference map Reference maps are basic, traditional maps. Their purpose is to illustrate geographic boundaries for cities, counties, and other areas. Reference maps have no underlying
Data for this exercise are located in the L1 subdirectory or the class web page. Videos for this exercise are located in the class web page.
 Lesson 1: What You ll Learn: -Start ArcMap -Create a new map -Add data layers -Pan and zoom -Change data symbology -Change display properties -Set relative paths -Add layers to features -Select data -Measure
BC Spatial Member Map Viewer. Version 2.0. User Guide. May 2015
 BC Spatial Member Map Viewer Version 2.0 User Guide May 2015 1 P a g e Revised: 16 June 2015 Contents Contents... 2 Introduction... 4 System Requirements... 5 BC Spatial Map Viewer... 6 I. Navigation Tools...
Answer the following general questions: 1. What happens when you right click on an icon on your desktop? When you left double click on an icon?
 Name: Date: June 27th, 2011 GIS Boot Camps For Educators Practical: Explore ArcGIS 10 Desktop Tools and functionality Day_1 Lecture 1 Sources: o ArcGIS Desktop help o ESRI website o Getting to Know ArcGIS
GIS Intro for G&G 304
 Geog_And_Epid.Doc Page 1 of 21 GIS Intro for G&G 304 Objectives By the end of this tutorial, you should understand: How to Open spatial data in ArcMap How to create a spatial data layer from tabular coordinates
Introduction to using QGIS for Archaeology and History Workshop by the Empirical Reasoning Center
 Introduction to using QGIS for Archaeology and History Workshop by the Empirical Reasoning Center In this workshop, we will cover the basics of working with spatial data, as well as its main uses for archaeology.
ArcGIS Basics 2: Creating a Map with ArcMap
 ArcGIS Basics 2: Creating a Map with ArcMap Revised 25 August 2010 Tufts University Author: Barbara Parmenter Introduction... 1 Part 1 - Opening ArcMap and adding data layers... 2 Part 2 - Defining the
Introduction to Geographic Information Systems Spring 2016
 Introduction to Geographic Information Systems Spring 2016 Exercise 2 Introduction to ArcGIS 10 Projects This exercise will introduce you to the common set-up functions of the ESRI ArcGIS software package.
ArcGIS Online (AGOL) Quick Start Guide Fall 2018
 Quick Start Guide Fall 2018") ArcGIS Online (AGOL) Quick Start Guide Fall 2018 ArcGIS Online (AGOL) is a web mapping tool available to UC Merced faculty, students and staff. The Spatial Analysis and Research Center (SpARC) provides
ArcGIS Online (AGOL) Quick Start Guide Fall 2018 ArcGIS Online (AGOL) is a web mapping tool available to UC Merced faculty, students and staff. The Spatial Analysis and Research Center (SpARC) provides
Create a personal geodatabase
 Create a personal geodatabase To create a personal geodatabase that corresponds to the same release as the ArcGIS for Desktop client you are using, follow these steps: 1. In ArcCatalog, right-click the
Lab 1: Introduction to ArcGIS
 Lab 1: Introduction to ArcGIS Objectives In this lab you will: 1) Learn the basics of the software package we will be using for the remainder of the semester, and 2) Discover the role that climate and
دورة تدريبية عن تطبيقات برنامج ARC GIS
 دورة تدريبية عن تطبيقات برنامج ARC GIS مايو 2009 دورة تدريبيت عن تطبيقاث برنامج ARC GIS 2009 مايو Table of Contents Introduction... viii Module 1: Introduction to ArcGIS 9 Module Objectives... 1-1 ArcGIS
MANITOBA LAND USE AND DEVELOPMENT WEB APPLICATION: How-to guide and help document
 MANITOBA LAND USE AND DEVELOPMENT WEB APPLICATION: How-to guide and help document 2 Index Index... 2 Layout & View... 3 Overview... 3 Layers... 4 Municipal Relations Data Layers... 4 Application Toolbar...
Lab 7: Tables Operations in ArcMap
 Lab 7: Tables Operations in ArcMap What You ll Learn: This Lab provides more practice with tabular data management in ArcMap. In this Lab, we will view, select, re-order, and update tabular data. You should
A Practical Guide to Using QGIS
 A Practical Guide to Using QGIS 1.1 INTRODUCTION Quantum GIS (QGIS) is a useful mapping software that enables the compilation and displaying of spatial data in the form of a map. Gaining experience in